S1
Mononuclear silver(I) complexes with 1,7-phenanthroline as potent
inhibitors of Candida growth
Nada D. Savića,#, Sandra Vojnovicb,#, Biljana Đ. Glišića, Aurélien Crochetc, Aleksandar
Pavicb, Goran V. Janjićd, Marina Pekmezoviće, Igor M. Opsenicaf, Katharina M. Frommc,*, Jasmina Nikodinovic-Runicb,*, Miloš I. Djurang,*
aUniversity of Kragujevac, Faculty of Science, Department of Chemistry, R. Domanovića
12, 34000 Kragujevac, Serbia
bInstitute of Molecular Genetics and Genetic Engineering, University of Belgrade, Vojvode
Stepe 444a, 11000 Belgrade
cDepartment of Chemistry, University of Fribourg, Chemin du Musée 9, CH-1700
Fribourg, Switzerland
dInstitute of Chemistry, Metallurgy and Technology, University of Belgrade, Njegoševa 12,
11000 Belgrade, Serbia
eDepartment of Microbial Pathogenicity Mechanisms, Hans Knöll Institute, Jena,
Germany
fUniversity of Belgrade-Faculty of Chemistry, Studentski trg 16, 11158 Belgrade, Serbia
gSerbian Academy of Sciences and Arts, Knez Mihailova 35, 11000 Belgrade, Serbia
#N.D.S. and S.V. contributed equally.
Corresponding authors. Tel.: +41 26 300 8732 (K. M. Fromm); Tel.: +381 11 397 6034;
fax: +381 11 397 5808 (J. Nikodinovic-Runic); Tel.: +381 34 300 251; fax: +381 34 335 040 (M. I. Djuran).
E-mail address: [email protected](K. M. Fromm);
S2
Abstract
Mononuclear silver(I) complexes with 1,7-phenanthroline (1,7-phen), [Ag(NO3
-O,O’)(1,7-phen-N7)2] (1) and [Ag(1,7-phen-N7)2]X, X = ClO4- (2), CF3SO3- (3), BF4- (4) and SbF6
-(5) were synthesized and structurally characterized by NMR (1H and 13C), IR and UV-Vis spectroscopy and ESI mass spectrometry. The crystal structures of 1, 3 and 4 were determined by single-crystal X-ray diffraction analysis. In all these complexes, 1,7-phen coordinates to the Ag(I) ion in a monodentate fashion via the less sterically hindered N7 nitrogen atom. The investigation of the solution stability of 1 – 5 in DMSO revealed that they are sufficiently stable in this solvent at room temperature. Complexes 1 – 5 showed selectivity towards Candida spp. in comparison to bacteria, effectively inhibiting the growth of four different Candida species with minimal inhibitory concentrations (MIC) between 1.2 and 11.3 µM. Based on the lowest MIC values and the lowest cytotoxicity against healthy human fibroblasts with selectivity index of more than 30, the antifungal potential was examined in detail for the complex 1. It had the ability to attenuate C.
albicans virulence and to reduce epithelial cell damage in the cell infection model.
Induction of reactive oxygen species (ROS) response has been detected in C. albicans, with fungal DNA being one of the possible target biomolecules. The toxicity profile of 1 in the zebrafish model (Danio rerio) revealed improved safety and activity in comparison to that of clinically utilized silver(I) sulfadiazine.
S3 TABLE OF CONTENTS 1H NMR spectrum of 1 S5 13C NMR spectrum of 1 S6 1H NMR spectrum of 2 S7 13C NMR spectrum of 2 S8 1H NMR spectrum of 3 S9 13C NMR spectrum of 3 S10 1H NMR spectrum of 4 S11 13C NMR spectrum of 4 S12 1H NMR spectrum of 5 S13 13C NMR spectrum of 5 S14
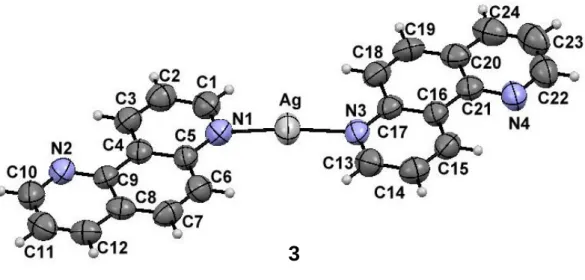
Fig. S1. Molecular structure of the silver(I) complex 3. Non-coordinating triflate anion in 3 is omitted for clarity. Displacement ellipsoids are drawn at 50% probability level and H atoms are represented by spheres of arbitrary size.
S15
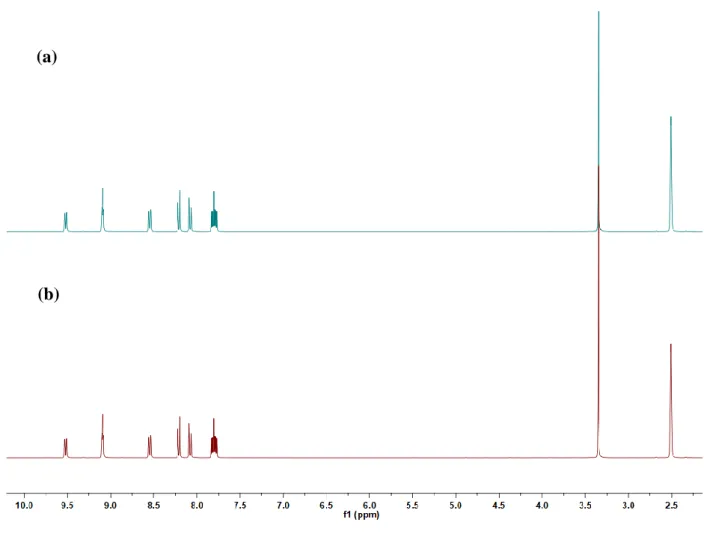
Fig. S2. Silver(I) complex 3 stability over time measured by 1H NMR
spectroscopy. 1H NMR spectrum was measured immediately (a) and 48 h (b) after complex dissolution in DMSO-d6.
S16
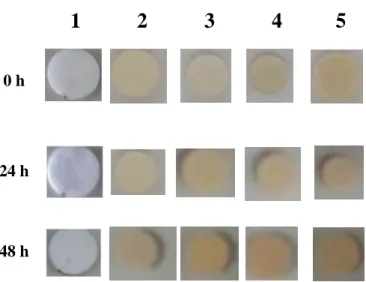
Fig. S3. Air/light stability of silver(I) complexes 1 – 5. S17
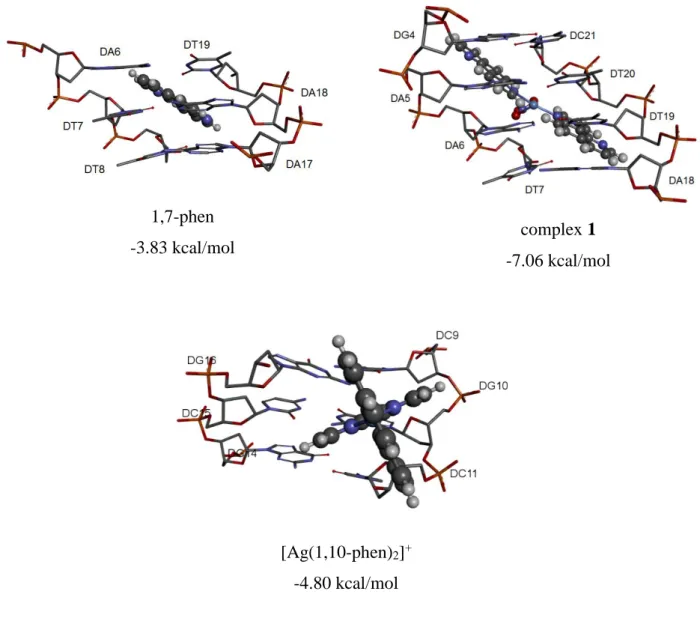
Fig. S4. The most stable binding of the tested compounds to base pairs of DNA and the corresponding binding energies, as assessed by molecular docking.
S18
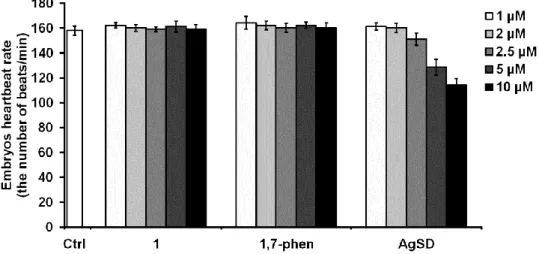
Fig. S5. The heartbeating rate of zebrafish embryos at 114 hpf upon different concentrations of complex 1, 1,7-phen and silver(I) sulfadiazine (AgSD). Statistically significant differences between data of untreated control and treatments were denoted with asterisk (*P < 0.5, **P < 0.01; ***P < 0.001;
S4 Student t’ test).
Table S1
Selected bond distances (Å) and valence angles (o) in the silver(I) complexes 1, 3
and 4.
S20
Table S2
Details of the crystal structure determinations of the silver(I) complexes 1, 3 and 4.
S21
Table S3
Lethal and teratogenic effects observed in zebrafish (Danio rerio) embryos at different hours post fertilization (hpf).
S5 HOD DMF DMF DMF 1H NMR (400 MHz, DMF-d 7) Ag N N N N [Ag(NO3-O,O')(1,7-phen-N7)2] (1) O O N O
S6 DMF DMF DMF 13C NMR (101 MHz, DMF-d 7) Ag N N N N [Ag(NO3-O,O')(1,7-phen-N7)2] (1) O O N O
S7 HOD DMF DMF DMF 1H NMR (400 MHz, DMF-d7) [Ag(1,7-phen-N7)2]ClO4 (2) Ag N N N N + ClO4
-S8 [Ag(1,7-phen-N7)2]ClO4 (2) Ag N N N N + ClO4- DMF DMF DMF 13C NMR (101 MHz, DMF-d 7)
S9 HOD DMF DMF DMF 1H NMR (400 MHz, DMF-d7) [Ag(1,7-phen-N7)2]CF3SO3 (3) Ag N N N N + CF3SO3
-S10 DMF DMF DMF 13C NMR (101 MHz, DMF-d7) [Ag(1,7-phen-N7)2]CF3SO3 (3) Ag N N N N + CF3SO3
-S11 [Ag(1,7-phen-N7)2]BF4 (4) Ag N N N N + BF4 -HOD DMF DMF DMF 1H NMR (400 MHz, DMF-d 7)
S12 [Ag(1,7-phen-N7)2]BF4 (4) Ag N N N N + BF4 -DMF DMF DMF 13C NMR (101 MHz, DMF-d 7)
S13 [Ag(1,7-phen-N7)2]SbF6 (5) Ag N N N N + SbF6 -HOD DMF DMF DMF 1H NMR (400 MHz, DMF-d 7)
S14 [Ag(1,7-phen-N7)2]SbF6 (5) Ag N N N N + SbF6 -DMF DMF DMF 13C NMR (101 MHz, DMF-d 7)
S15
Fig. S1. Molecular structure of the silver(I) complex 3. Non-coordinating triflate anion in 3 is omitted for clarity. Displacement ellipsoids are drawn at 50% probability level and H atoms are represented by spheres of arbitrary size.
S16
Fig. S2. Silver(I) complex 3 stability over time measured by 1H NMR spectroscopy. 1H NMR spectrum was measured immediately (a) and 48 h (b) after complex dissolution in DMSO-d6.
(a)
S17
Fig. S3. Air/light stability of silver(I) complexes 1 – 5.
1
2
3
4
5
0 h
24 h
S18
Fig. S4. The most stable binding of the tested compounds to base pairs of DNA and the corresponding binding energies, as assessed by molecular docking.
1,7-phen -3.83 kcal/mol complex 1 -7.06 kcal/mol [Ag(1,10-phen)2]+ -4.80 kcal/mol
S19
Fig. S5. The heartbeating rate of zebrafish embryos at 114 hpf upon different concentrations of complex 1, 1,7-phen and silver(I) sulfadiazine (AgSD). Statistically significant differences between data of untreated control and treatments were denoted with asterisk (*P < 0.5, **P < 0.01; ***P < 0.001; Student t’ test).
S20 Table S1
Selected bond distances (Å) and valence angles (o) in the silver(I) complexes 1, 3 and 4.
1 3 4 Ag—N1 2.203(4) 2.137(10) 2.172(7) Ag—N3 2.206(4) 2.146(9) 2.191(7) Ag—O2 2.630(4) / / Ag—O3 2.652(4) / / N1—Ag—N3 154.78(15) 174.2(3) 166.6(3) N1—Ag—O3 95.33(15) / / N3—Ag—O2 93.83(15) / / O2—Ag—O3 47.85(12) / / N1—Ag—O2 110.83(15) / / N3—Ag—O3 105.53(15) / / N5—O3—Ag 95.1(3) / / N5—O2—Ag 95.8(3) / / C1—N1—Ag 120.6(3) 118.4(8) 121.5(6) C5—N1—Ag 121.8(3) 121.7(8) 119.6(5) C13—N3—Ag 119.5(3) 119.2(8) 119.1(6) C17—N3—Ag 122.7(3) 120.1(7) 120.1(5)
S21 Table S2
Details of the crystal structure determinations of the silver(I) complexes 1, 3 and 4.
1 3 4
Empirical formula C24H16AgN5O3 C25H16AgF3N4O3S C24H16AgBF4N4
CCDC number CCDC-1829501 CCDC-1829502 CCDC-1829503
Formula weight (g.mol-1) 530.29 617.35 555.09
Crystal system, space group triclinic, Pī triclinic, Pī triclinic, Pī
a (Å) 7.1629(7) 6.9800(5) 7.1759(8) b (Å) 10.5142(9) 13.6380(9) 10.9209(12) c (Å) 14.5205(12) 13.9579(9) 14.5568(15) (°) 78.215(7) 109.122(5) 83.120(9) (°) 81.410(7) 103.327(5) 86.671(9) (°) 73.611(7) 103.352(5) 71.989(9) V (Å3) 1022.11(16) 1151.72(14) 1076.8(2) F000 532 616 552 2 2 2
X-radiation, /Å Mo-Kα 0.71073 Mo-Kα 0.71073 Mo-Kα 0.71073
data collect. temperat. /K 298(2) 298(2) 250(2)
Calculated density (Mg m-3) 1.723 1.780 1.712
Absorption coefficient (mm-1) 1.026 1.028 0.991
Crystal size (mm) 0.400 × 0.100 × 0.020 0.29 x 0.13 x 0.04 0.210 × 0.130 × 0.030
range (°) 1.4 to 25.2 1.6 to 25.1 1.4 to 25.3
index ranges h, k, l -8 ... 8, -12 ... 12, -17 ... 17 -7 … 8, -16… 16, -16... 16 -8 ... 8, -13 ... 13, -4 ... 17 No. of collected and independent
reflections
13116, 3640 14162, 4106 3842, 3842
Rint 0.1022 0.1034
Data / restraints / parameters 3640 / 0 / 298 4106/151/334 3842 / 0 / 308
Goodness-on-fit on F2 0.990 0.993 0.915 Final R indices [Fo > 4(Fo)] R(F), wR(F2) 0.0481, 0.1111 0.0868, 0.2212 0.0699, 0.1669 Final R indices (all data) R(F), wR(F2) 0.0741, 0.1237 0.1638, 0.2838 0.1335, 0.2031
Difference density: max, min (e Å-3) 1.06, -0.62 2.03, -0.66 0.68, -0.65
S22 Table S3
Lethal and teratogenic effects observed in zebrafish (Danio rerio) embryos at different hours post fertilization (hpf).
Category Developmental endpoints Exposure time (hpf)
24 48 72 96/114
Lethal effect Egg coagulationa ● ● ● ●
No somite formation ● ● ● ●
Tail not detached ● ● ● ●
No heartbeat ● ● ●
Teratogenic effect Malformation of head ● ● ● ●
Malformation of eyesb ● ● ● ● Malformation of sacculi/otolithsc ● ● ● ● Malformation of chorda ● ● ● ● Malformation of taild ● ● ● ● Scoliosis ● ● ● ● Heartbeat frequency ● ● ● Blood circulation ● ● ● Pericardial edema ● ● ● ● Yolk edema ● ● ● ● Yolk absosrption ● ● ● ● Growth retardatione ● ● ● ●
aNo clear organs structure is recognized.
bMalformation of eyes was recorded for the retardation in eye development and abnormality in shape and size.
cPresence of no, one or more than two otoliths per sacculus, as well as reduction and enlargement of otoliths and/or sacculi (otic vesicles).
dTail malformation was recorded when the tail was bent, twisted or shorter than to control embryos as assessed by optical comparation.
eGrowth retardation was recorded by comparing with the control embryos in development or size (before hatching, at 24 and 48 hpf) or in a body length (after hatching, at and onwards 72 hpf) using by optical comparation using an inverted microscope (CKX41; Olympus, Tokyo, Japan).