DOI 10.1007/s11135-012-9817-x
A Monte Carlo permutation test for co-occurrence data
Balázs Kovács
Published online: 19 December 2012
© Springer Science+Business Media Dordrecht 2012
Abstract Researchers commonly use co-occurrence counts to assess the similarity of objects. This paper illustrates how traditional association measures can lead to misguided sig-nificance tests of co-occurrence in settings where the usual multinomial sampling assumptions do not hold. I propose a Monte Carlo permutation test that preserves the original distributions of the co-occurrence data. I illustrate the test on a dataset of organizational categorization, in which I investigate the relations between organizational categories (such as “Argentine restaurants” and “Steakhouses”).
Keywords Co-occurrence data· Association tests · Permutation tests · Non-parametric statistics
1 Introduction
Co-occurrence is often used as a measure of similarity or relatedness. For example, in com-putational linguistics, two words are viewed related if they tend to appear together (Manning and Schütze 1999). In bibliometrics, scholars use citation overlap as a measure of similarity of articles (Garfield 1972). In social networks studies, actors are viewed as similar if they are members of the same clubs (Breiger 1974). In computer science, in-link overlap is an important measure for the similarity of webpages (Dean and Henzinger 1999).
Measuring the strength of association has a long tradition in statistics, going back to at leastPearson(1900). In this paper, I argue that the usual sampling assumptions in the above mentioned fields (e.g., multinomial or Poisson-distribution:Agresti 1992;Wickens 1989) are often not valid for co-occurrence data. First, a multinomial distribution does not take into account the degree distribution of the settings the objects appear in. Second, objects might have a tendency to appear in small or large settings, and this property is not captured in the multinomial assumption. In a Likehood Ratio test with multinomial distribution, for
B. Kovács (
B
)example, the expected count of co-occurrence is calculated as a product of the average probability of each object being present, multiplied by the number of settings. As I show, this is not a valid way to model the null distribution of co-occurrences if the space in which the objects can co-occur diverges from what is implied by a multinomial distribution, and this results in misguided significance levels. Therefore, to analyze associations in co-occurrence data, I introduce a significance test that provides a null-distribution for co-occurrences while preserving the original distribution of the data.
The rest of the paper is structured as follows. First, I introduce the data structure common to co-occurrence data. Second, I demonstrate why the classical assumptions of association measures often do not apply to this data structure, and propose an alternative significance test. Third, I illustrate the proposed significance test on a dataset of organizational classification. Finally, I discuss the findings and list a few applications in other fields for which our approach can be useful.
2 Establishing the significance of co-occurrence measures
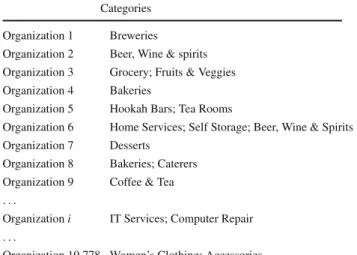
The new significance test is applied to a dataset that contains organizations and their classification to organizational categories. Our data contains the categorization of 19,778 San Francisco-based organizations, obtained from the website Yelp.com. There are 397 categories, ranging from “Accessories” through “Chinese” and “Gas station” to “Yoga.” Table1provides a few examples. The most common categories are “Coffee & Tea” with 666 instances, “Hair Salons” with 538, “Women’s Clothing” with 471, “Grocery” with 460, and “Dentists” with 456 instances. Table1illustrates the data.
The goal is to assess the similarity or relatedness of organizational categories. Researchers often count the co-occurrences, and compare the observed value to what would have been expected from a null-distribution. Below I present two significance tests. The first test is the standard practice of measuring associations: assuming a multinomial distribution and using Likelihood Ratio or Chi-2 tests to establish whether a pair of categories appear more or less frequently than expected under independence (Wickens 1989). Second, I present a Monte Carlo permutation test that simulates the null-distribution of the co-occurrences while keeping certain properties of the data constant (Hubert 1985;Good 2005).
Table 1 Data structure with
a few examples Categories
Organization 1 Breweries Organization 2 Beer, Wine & spirits Organization 3 Grocery; Fruits & Veggies Organization 4 Bakeries
Organization 5 Hookah Bars; Tea Rooms
Organization 6 Home Services; Self Storage; Beer, Wine & Spirits Organization 7 Desserts
Organization 8 Bakeries; Caterers Organization 9 Coffee & Tea
. . .
Organization i IT Services; Computer Repair
. . .
3 Multinomial distribution and the Likelihood Ratio test
The most common distributional assumption for co-occurrence data is the binomial distri-bution, or more generally, the multinomial distribution. When multinomial distribution is assumed, each category is assigned to each organization with a constant probability. Take the example of the category “Sandwiches,” which is assigned to 342 organizations in the dataset. There are 19,778 organizations, so the probability that a given organization is assigned the category “Sandwiches” is 342/19,778=.0173. Similarly, probabilities are assigned to all 397 categories. Based on these probabilities, the null-distribution of the number of co-occurrences for all pairs of categories can be calculated. Testing the significance involves comparing the observed values of co-occurrences to the null-distribution. In this case, the null-distribution approximates a Chi2-distribution (Wickens 1989).
4 A Monte Carlo permutation significance test for co-occurrence data
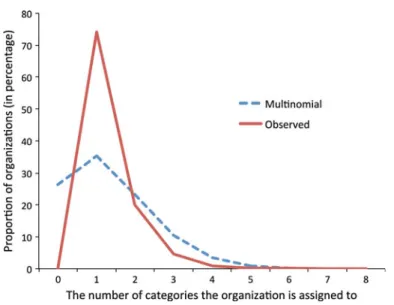
The problem with the multinomial distribution-based significance measures of co-occurrence is that the baseline model they imply often does not correspond to the structure of the co-occurrence data. In our example of organizational categories’ co-occurrences, there are two features of the observed data that a multinomial stochastic model does not recreate. First, as shown on Fig.1, the distribution of the number of categories the multinomial model assigns to the organizations distinctly deviates from the observed distribution. The multinomial model assigns zero categories to about 26 % of the organizations, and this clearly deviates from the observed data structure. Also, the multinomial model underestimates the proportion of orga-nizations with one category, but overestimates the proportion of orgaorga-nizations with two or more categories. Second, the multinomial distribution does not take into account that the cat-egories have different tendency to co-occur with other catcat-egories. For example, the category
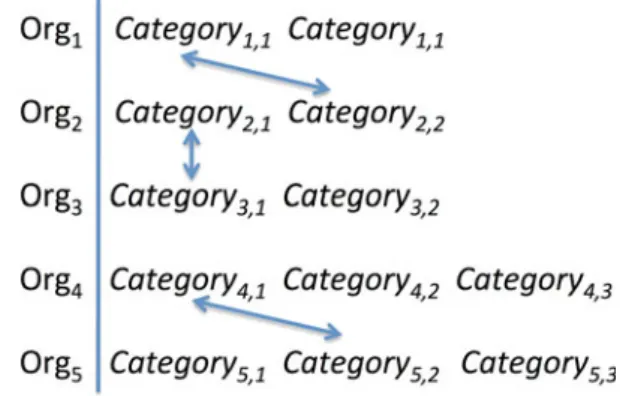
Fig. 2 The schematic structure
of randomizing the category co-occurrence while keeping the marginal distributions constant
“Sushi” tends to co-occur with other categories, while the category “Polish restaurant” is usually assigned to organizations with a single category.
To circumvent this problem, I propose a non-parametric approach to measure associations between categories. I propose a null-model that keeps both the marginals of the categories and the distribution of the count of co-occurrences constant while making the categories independent. To do this, I randomly permute the category assignments. Figure2provides a schematic illustration of the randomization. First, I randomly pick two organizations that have the same number of categories assigned to them. Second, I randomly pick one of the categories of each of these two organizations, and exchange them. If exchanging the categories were to result in assigning to the same category to an organization twice, I do not exchange them. Note that because switching categories between organizations with one category would not make a difference in the number of category co-occurrences, I only permute organizations that have at least two categories. I do 10,000 such random permutations1, and the result is a randomized category assignment. Note that this permutation preserves the distribution of the number of categories the organizations are assigned to. After the random permutation, for each pairwise combination of categories I count the number of organizations in which they co-occurred. Finally, I start over again from the original data, and create a random data set through permutation. Repeating the permutation results in null values of co-occurrences for all pairs of categories. These values serve as null distributions to which the observed values of co-occurrence are compared, and the significance level established.
5 An example: associations of organizational categories
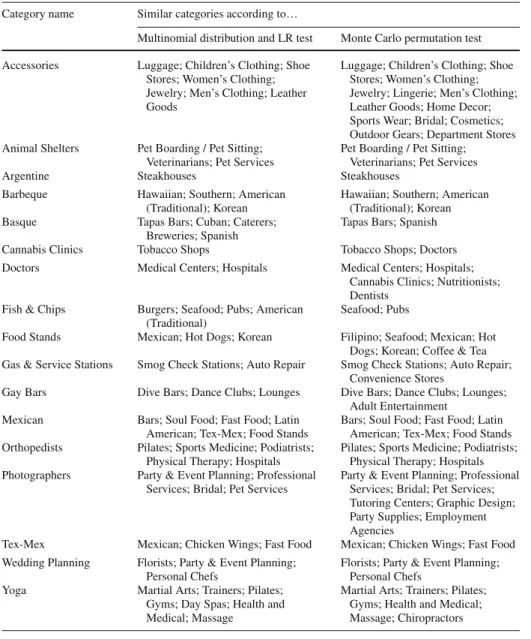
Table2shows the positive category associations for 16 randomly selected categories. The central and right columns list categories that are associated to the category in the left column, at 5 % significance level (based on 10,000 iterations and 10,000 permutations for each iteration). The central column of Table2lists the categories that are significantly associated to the focal categories, according to the Likelihood Ratio tests assuming a multinomial null-model. For most categories shown in Table2, the Likelihood Ratio test with multinomial distribu-tion provides a quite good measure of associadistribu-tion. For example, the category “Doctors” is significantly associated with “Medical Centers” and “Hospitals.” For “Wedding Planning,” 1 Obviously, the number of permutation needed depends on the sample size. Given that there are about 5,000
organizations with two or more categories, and given that most organizations are in two or three categories, 10,000 permutations are likely enough to arrive at random category associations.
Table 2 A few examples of organizational category associations (San Francisco data, 5 % significance at
10,000 iterations.)
Category name Similar categories according to…
Multinomial distribution and LR test Monte Carlo permutation test Accessories Luggage; Children’s Clothing; Shoe
Stores; Women’s Clothing; Jewelry; Men’s Clothing; Leather Goods
Luggage; Children’s Clothing; Shoe Stores; Women’s Clothing; Jewelry; Lingerie; Men’s Clothing; Leather Goods; Home Decor; Sports Wear; Bridal; Cosmetics; Outdoor Gears; Department Stores Animal Shelters Pet Boarding / Pet Sitting;
Veterinarians; Pet Services
Pet Boarding / Pet Sitting; Veterinarians; Pet Services
Argentine Steakhouses Steakhouses
Barbeque Hawaiian; Southern; American (Traditional); Korean
Hawaiian; Southern; American (Traditional); Korean Basque Tapas Bars; Cuban; Caterers;
Breweries; Spanish
Tapas Bars; Spanish Cannabis Clinics Tobacco Shops Tobacco Shops; Doctors Doctors Medical Centers; Hospitals Medical Centers; Hospitals;
Cannabis Clinics; Nutritionists; Dentists
Fish & Chips Burgers; Seafood; Pubs; American (Traditional)
Seafood; Pubs
Food Stands Mexican; Hot Dogs; Korean Filipino; Seafood; Mexican; Hot Dogs; Korean; Coffee & Tea Gas & Service Stations Smog Check Stations; Auto Repair Smog Check Stations; Auto Repair;
Convenience Stores
Gay Bars Dive Bars; Dance Clubs; Lounges Dive Bars; Dance Clubs; Lounges; Adult Entertainment
Mexican Bars; Soul Food; Fast Food; Latin American; Tex-Mex; Food Stands
Bars; Soul Food; Fast Food; Latin American; Tex-Mex; Food Stands Orthopedists Pilates; Sports Medicine; Podiatrists;
Physical Therapy; Hospitals
Pilates; Sports Medicine; Podiatrists; Physical Therapy; Hospitals Photographers Party & Event Planning; Professional
Services; Bridal; Pet Services
Party & Event Planning; Professional Services; Bridal; Pet Services; Tutoring Centers; Graphic Design; Party Supplies; Employment Agencies
Tex-Mex Mexican; Chicken Wings; Fast Food Mexican; Chicken Wings; Fast Food Wedding Planning Florists; Party & Event Planning;
Personal Chefs
Florists; Party & Event Planning; Personal Chefs
Yoga Martial Arts; Trainers; Pilates; Gyms; Day Spas; Health and Medical; Massage
Martial Arts; Trainers; Pilates; Gyms; Health and Medical; Massage; Chiropractors
the related categories are “Florists,” “Party & Event Planning,” and “Personal Chefs.” These categories are clearly related.
The right column shows the categories associated with the focal category according to the proposed permutation test.
The list of associated categories under the multinomial and Monte Carlo permutation test for significance overlap to a large extent, but there are numerous differences as well. There are 83 categories associated to the 17 focal categories listed in the left column of the table.
cide for 56 categories. There are six categories that only appear in the center column, and 21 categories that only appear in the right column. In general, the permutation significance test tends to identify on average 20 % more categories that are associated to the focal cate-gory. This can be explained by the fact that the multinomial distribution overestimates the number of co-occurring categories in the null-distribution (see Fig.1), which implies that when comparing the observed value of co-occurrence to the null-distribution, it identifies fewer significant associations. Note, however, that this is just a general tendency, and does not strictly hold for all categories. For example, for the category “Fish & Chips,” the multino-mial distribution-based significance test identifies “Burgers” and “American (Traditional)” as associated categories, while the Monte Carlo permutation test of significance does not identify them as similar.
6 Conclusion
In this paper, I proposed a Monte Carlo permutation test to establish the significance values of co-occurrence associations where the data diverge from the assumptions of multinomial distributions. I illustrated the test on a dataset on organizational categories, and demonstrated that the multinomial assumption often does not yield a proper significance test.
The proposed test is applicable in many other fields that rely on co-occurrence data, such as word-associations in linguistics, product associations in marketing, link-similarities in computer science, or vote classification in political science.
References
Agresti, A.: A survey of exact inference for contingency tables. Stat. Sci. 7, 131–177 (1992) Breiger, R.L.: The duality of persons and groups. Soc. Forces 53, 181–190 (1974)
Dean, J., Henzinger, M.R.: Finding related pages in the World Wide Web. Comput. Netw. 31, 1467–1479 (1999)
Garfield, E.: Citation analysis as a tool in journal evaluation. Science 178, 471–479 (1972) Good, P.I.: Permutation, Parametric and Bootstrap Tests of Hypotheses. Springer, New York (2005) Hubert, L.J.: Combinatorial data analysis. Psychometrika 50, 449–467 (1985)
Manning, C.D., Schütze, H.: Foundations of Statistical Natural Language Processing. MIT Press, Cambridge, MA (1999)
Pearson, K.: On a criterion that a given system of deviations from the probable in the case of correlated system of variables is such that it can be reasonably supposed to have arisen from random sampling. Philos. Mag.
5, 157–175 (1900)
Wickens, T.D.: Multiway Contingency Tables Analysis for the Social Sciences. Lawrence Erlbaum Associates, Hillsdale (1989)