Plume-lithosphere interactions in rifted margin tectonic settings: Inferences from thermo-mechanical modelling
Thomas François, Alexander Koptev, Sierd Cloetingh, Evgueni Burov, Taras Gerya
PII: S0040-1951(17)30490-0
DOI: doi:10.1016/j.tecto.2017.11.027
Reference: TECTO 127693
To appear in: Tectonophysics
Received date: 31 January 2017
Revised date: 14 November 2017
Accepted date: 19 November 2017
Please cite this article as: Thomas François, Alexander Koptev, Sierd Cloetingh, Evgueni Burov, Taras Gerya , Plume-lithosphere interactions in rifted margin tectonic settings: Inferences from thermo-mechanical modelling. The address for the corresponding author was captured as affiliation for all authors. Please check if appropriate. Tecto(2017), doi:10.1016/j.tecto.2017.11.027
This is a PDF file of an unedited manuscript that has been accepted for publication. As a service to our customers we are providing this early version of the manuscript. The manuscript will undergo copyediting, typesetting, and review of the resulting proof before it is published in its final form. Please note that during the production process errors may be discovered which could affect the content, and all legal disclaimers that apply to the journal pertain.
ACCEPTED MANUSCRIPT
Plume-lithosphere interactions in rifted margin tectonic settings: Inferences from thermo-mechanical modelling
Thomas François1*, Alexander Koptev2,3, Sierd Cloetingh1, Evgueni Burov2Ϯ, Taras Gerya4
1Utrecht University, Faculty of Earth Sciences, Utrecht, The Netherlands
2Sorbonne Universités, UPMC Univ Paris 06, CNRS, Institut des Sciences de la Terre de Paris (iSTeP), 4 place Jussieu 75005 Paris, France
3Now at Department of Geosciences, University of Tübingen, Tübingen, Germany 4ETH-Zurich, Institute of Geophysics, Sonnegstrasse 5, Zurich, Switzerland *: corresponding author, [email protected]
ϮDeceased 9 October 2015
Abstract
We present results from 2D and 3D thermo-mechanical studies of plume-lithosphere interactions in a rifted margin setting and compare inferences of these models with the Northern Atlantic volcanic rifted margin province. We first present a series of 2D models with three different initial locations of the plume: under the oceanic part of the rifted margin system; under the area affected by lithospheric thinning by passive rifting and under continental lithosphere which has not been affected by extension prior to plume emplacement. The style of final plume distribution appears to be controlled by its initial position with respect to different lithospheric segments and rheology of the mantle in the continent-ocean transitional zone rather than by other parameters such as external forcing and rheological structure of the mantle plume. The initial size of the mantle plume controls, to a large extent, the degree of plume head asymmetry. For a strong rheology of the overlaying transitional lithosphere, the effect of plume emplacement is mainly restricted to deep lithospheric levels. In contrast, a weak transitional mantle leads to plume-induced continental break-up when the plume head contributes to the formation of new oceanic lithosphere with asymmetrical propagation of hot plume material towards the continental segment. A common feature of most 2D models is that initially a hot plume weakens the overlying lithosphere, whereas at a later stage frozen mantle plume material is embedded into the lower part of the lithosphere, forming dense and high-velocity bodies. We extend our 2D numerical modelling study to three dimensions and investigate the first-order controls of continental break-up and plume emplacement. We demonstrate that the observed complex Iceland plume geometry with up to 400 km southern propagation can be reproduced
ACCEPTED MANUSCRIPT
numerically in 3D and explained by pre-imposed zones of lithospheric thinning along transform faults.
Key words: numerical modelling, plume-lithosphere interaction, lithosphere rheology, rifted margins, the Northern Atlantic.
Research highlights:
1. Inherited lithospheric structure and initial position of the mantle plume are key factors in plume-induced rifted margin evolution.
2. The degree of plume head asymmetry is largely controlled by the initial size of the mantle plume anomaly seeded at the bottom of the model box.
3. Several hundreds of kilometres of propagation of the Iceland plume towards southern Norway and the British Isles can be explained by the presence of pre-existing zones of lithospheric thinning along major transform faults.
ACCEPTED MANUSCRIPT
1. Introduction
Rifted continental margins are key elements in the process of continental break-up. Characteristic time scales for their rifting phase vary from over more than two hundred million years for the Norwegian margin (Van Wijk and Cloetingh, 2002) to a few million years for the Neogene back-arc margins in the western Mediterranean (Ziegler and Cloetingh, 2004). A number of mechanical factors, including the rigidity of the extending continent (Ziegler and Cloetingh, 2004; Franke, 2013), the presence of thermal anomalies in the upper mantle (Burov and Gerya, 2014; Koptev et al., 2017), changes in plate-tectonic regime affecting stress levels and strain rates in the lithosphere (Lundin and Doré, 2002) are likely to have contributed to the observed spectrum in margin formation histories. Many rifted margins are characterized by pronounced differential topography. Rift shoulders form most times a particularly important element in the geomorphology of rifted margins and have received considerable attention over the last few decades (e.g. Daradich et al., 2003; Cloetingh et al., 2013). As a result, a growing database has been accumulating, providing constraints on the timing and magnitude of their spatial and temporal evolution (e.g. Abdelmalak et al 2016; Daradich et al., 2003; Japsen et al., 2014; Mosar et al., 2002; Praeg et al., 2005; Rohrman et al., 1995; Vâgnes et al., 1998; Van Der Beek et al., 1994). Incorporation of flexural isostasy of the extending lithosphere in models for rifting (Braun and Beaumont, 1989; Chery et al., 1992; Kooi et al, 1992; Weissel and Karner, 1989; Cloetingh et al., 2015) has been an important step in better understanding the typical asymmetry of rift shoulders and their intrinsic linkage to the syn-rift phase of margin formation. Thermo-mechanical models (Burov and Poliakov, 2001; Cloetingh et al., 2013) have shown a close feed-back between syn-rift and post-rift erosion of rift shoulders and lower crustal flow (Burov and Cloetingh, 1997), significantly affecting t h e accommodation shape of deeper parts of the offshore margin systems. The same is true for structural heterogeneity, inherited from the pre-rift phase (e.g. Cloetingh et al., 2013). Many of the world's rifted continental margin systems are characterized by large magnitude differential topography sustained over considerable timescales (Van Der Beek et al., 1995; Japsen et al., 2006). Spatial and temporal variations in the patterns of associated vertical motions often deviate from predictions from classical rifting models (e.g. Ziegler, 1992; Lobkovsky et al., 1996).
Rifted continental margins are frequently subject to a poly-phase evolution with major thermal perturbations during and after continental break-up, in particular in the context of mantle plume emplacement. A striking example is the Northern Atlantic volcanic rifted margin setting where tomography studies (Rickers et al., 2013) have revealed plume propagation over large horizontal distances away from the Iceland plume to segments of Norway’s rifted margin
ACCEPTED MANUSCRIPT
(Fig. 1). Plume emplacement has been dated as coeval with continental break-up following over 200 Myr of rifting (Abdelmalak et al., 2015, 2016; Franke, 2013). The southern Scandes of Norway, located on one of the sidelobes of the Iceland plume, are a prime example of elevated margin topography, created after continental break-up and of a wavelength incompatible with flexural processes within the lithosphere (Rohrman and Van Der Beek, 1996). The role of pre-rift structural inheritance on crustal and lithospheric scale appears to have long-lasting consequences for the topography and sediment source-sink dynamics at rifted margin systems. Thermo-mechanical models demonstrate that the rheology of the lithosphere probably exerts a key control in its response to the interplay of deep seated thermal perturbations and evolving stress systems at rifted margin systems (Frottier and Burov, 2003; Burov and Guillou-Frottier, 2005; Cloetingh et al., 2013). Lateral variations in mechanical structure of the lithosphere have a strong feedback with margin topography, surface processes and stress gradients across margins, explaining many observed characteristic features (Cloetingh et al., 2005).
Over the last decade, a general consensus has been growing that models for passive and active rifting should be considered as end-members in the mode of rifting, also in view of temporal variations in rifting style frequently encountered during the rifting process itself (Huismans et al., 2001). Thermo-mechanical models have demonstrated that the stratified brittle-ductile rheology of the extending continental lithosphere is key in such transitions. Classical models for the effects of thermal perturbations in the upper mantle on the overlying lithosphere and discussions on their impact on sedimentary successions in margin settings (e.g. Dam et al., 1998) have till recently adopted a non-stratified oceanic lithosphere, predicting a one to one relationship between plume impingement and uplift at the surface. As demonstrated by Burov and Guillou-Frottier (2005) and Burov et al. (2007), the incorporation of a more realistic continental rheology drastically changes the predicted record of vertical motions. Plume-interactions with a rheologically stratified lithosphere do not lead to uniform uplift, but in contrast are characterized by a temporal transition from long-wavelength (>1000 km) uplift to differential uplift and subsidence patterns with typical wavelengths of only several hundreds of km. A strong dependence of the record of induced vertical motions e x i s t on the age of the overlying lithosphere and the mode of erosion (Burov and Cloetingh, 2009; Cloetingh and Burov, 2011).
In the present paper, we examine the dynamics of plume-lithosphere interaction in rifted margin settings, characterized by pronounced lithospheric heterogeneity at the transition of oceanic to continental lithosphere. To this purpose, we first present the results of 2D
thermo-ACCEPTED MANUSCRIPT
mechanical modelling to quantify the role of inherited lithospheric structure, initial plume size, rheology and position. This is followed by comparison with inferences from 3D modelling. Subsequently, we discus implications of our findings for rifted margins with a particular focus on the Northern Atlantic.
2. 2D Thermo-mechanical models for plume-lithosphere interactions in rifted margins 2.1. Setup of the 2D thermo-mechanical models
The thermo-mechanically and thermodynamically coupled code used for the 2D numerical modelling is Flamar v12 (Burov and Yamato, 2008), based on the FLAC-Para(o)voz algorithm (Cundall, 1989; Poliakov et al., 1993). This algorithm is described in detail in the Appendix A and in a number of previous modelling studies of lithosphere dynamics (e.g. D’Acremont et al., 2003; Yamato et al., 2008; François et al., 2014), including plume-lithosphere interaction (e.g., Burov et al., 2007; Burov and Cloetingh, 2009; Beniest et al., 2017a). The code handles (1) free surface boundary condition, (2) large strain formulation, (3) thermo-mechanical coupling, and (4) visco(ductile)-elastic-plastic(brittle) rheologies. The implemented constitutive laws include elasticity, Mohr-Coulomb plasticity for brittle deformation and pressure-temperature-strain-rate-dependent ductile flow for nonlinear viscous deformation (e.g., Burov, 2011). Our models have free upper surface boundary, surface erosion, rheological stratification (upper crust, lower crust, lithospheric mantle and asthenosphere), and metamorphic phase changes (density and physical properties).
2.1.1. Model geometry and rheological structure
In order to investigate the interaction between plume and rifted margin we design an asthenospheric scale model of 600 km deep and 3000 km wide with 55 km grid size resolution. The model design (Fig. 2) is based on available data on the structure and physical properties of Scandinavia’s North Atlantic rifted margin (Ebbing et al., 2012; Maupin et al., 2013; Mosar et al., 2002). The model geometry is made up by three different segments of 1000 km wide lithosphere: a 65 Ma old oceanic lithosphere, a 500 Ma old lithosphere (Phanerozoic) and a 1 Ga old continental lithosphere (Proterozoic) (Fig. 2A). The oceanic lithosphere is composed of a 10 km thick oceanic crust (basalt rheology) and a 40 km thick lithosphere mantle (dry olivine rheology). The Phanerozoic rifted continental lithosphere (i.e. transitional lithosphere) is composed in the middle of the segment of a 30 km thick continental crust (15 km of dry quartz rheology + 15 km of diabase rheology) and of a 70 km thick mantle lithosphere (dry olivine
ACCEPTED MANUSCRIPT
rheology except for two model (exp_7 and exp_8) where a wet olivine flow law has been adopted; see Section 2.1.3 and Table 3). The Proterozoic continental lithosphere consists of a 50 km thick continental crust (25 km of dry quartz rheology + 25 km of diabase rheology) and a 150 km thick mantle lithosphere (dry olivine rheology). In general, for the mantle lithosphere we adopt olivine (dry or wet) dislocation and Peierels flow properties, whereas the sublithospheric mantle is assumed to deform by diffusion creep (Caristan, 1982; Karato and Wu, 1993; Durham et al., 2009).
The initial mantle plume anomaly has been seeded by a spherical 250C temperature anomaly at 600 km depth. We have tested three different mantle plume positions: under oceanic lithosphere, under transitional lithosphere and under continental lithosphere (see Fig. 2A). Size (radius of 150, 300 and 400 km) and rheology (wet olivine or dry olivine flow law) of the mantle plume represent the key variable parameters as well (see Section 2.1.3 and Table 3).
Rheological and material properties used in this study are given in Tables 1 and 2.
2.1.2. Thermal and mechanical boundary conditions
Thermal boundary conditions include fixed temperatures at the upper surface and the bottom of the model: T=0°C at the top and 1700±100C (e.g., Turcotte and Schubert, 2002) at the bottom which refers to a “cold geotherm” of whole mantle convection (see e.g. Burov and Cloetingh, 2009).
For the entire model, the initial thermal distribution is computed from the combination of the plate-cooling models (oceanic segment) for the upper lithospheric part with the adiabatic thermal gradient for the underlying mantle. The initial adiabatic temperature gradient in the underlying mantle is then computed by equalizing the temperature at its top with the temperature at the bottom of the lithosphere (1300C) and by adjusting the mantle heat flux in order that the temperature at the bottom of the upper mantle (600 km) fits 1700±100C (e.g., Turcotte and Schubert, 2002). In case of continental and transitional lithosphere, the initial lithosphere geotherm is piece-wise linear with 0 °C at the surface, 700 °C at the Moho, 1300 °C at the lithospheric base. We use the following mechanical boundary conditions: (1) the upper surface is free (free stress and free slip condition in all directions); (2-3) constant horizontal velocity, vx, at the lateral sides (vx =0-2 cm/y); (4) pliable hydrostatic Winkler basement(Burov et al., 1998; Burov and Poliakov, 2001; Burov et al., 2001).
ACCEPTED MANUSCRIPT
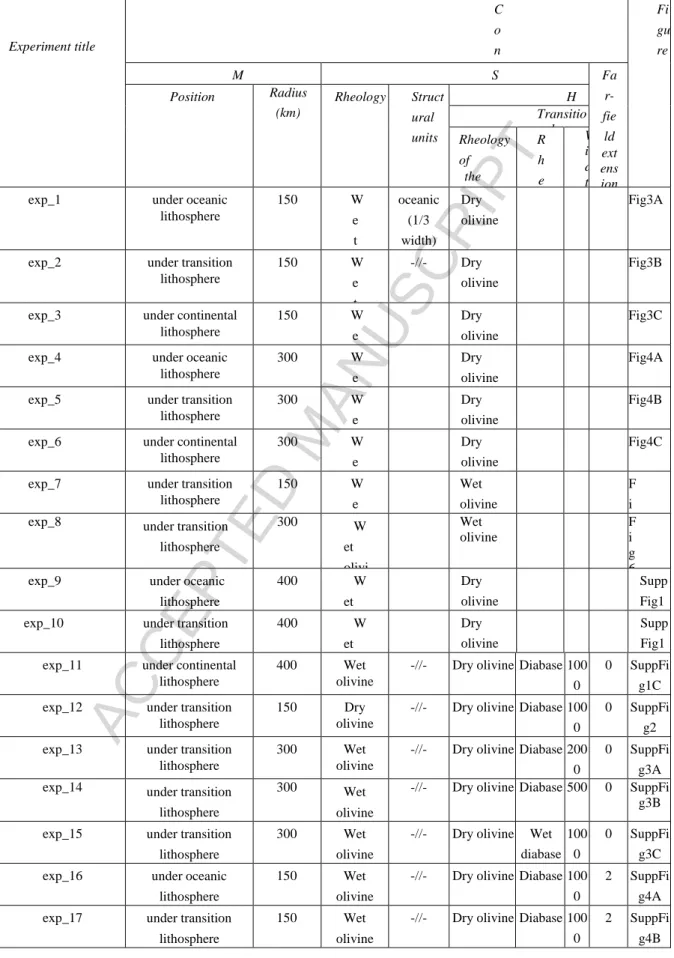
We have performed 25 models (Table 3) by varying eight controlling parameters characterizing the properties of the mantle plume (initial position, size and rheology), the structure of the lithosphere including rheological properties and width of the transitional zone and velocity boundary conditions.
We started our modelling with three experiments (exp_1, exp_2 and exp_3; Fig. 3) where the mantle plume is characterized by wet olivine rheology and initial radius of 150 km. Through these experiments, we have tested three different initial plume positions with respect to inherited lithospheric structures: under the oceanic lithosphere, under transitional lithosphere and under continental lithosphere, respectively (as shown on Fig. 2A). In addition, we have increased the size of the mantle plume up to 300-400 km in radius for the same plume locations (exp_4-6, exp_9-11; Fig. 4, Supplementary Fig.1).
Subsequently, we have studied the impact of weaker overlaying lithospheric mantle (exp_7-8; Figs. 5-6) and stronger plume rheology (dry olivine instead of wet olivine; exp_12; Supplementary Fig. 2) in the context of the mantle plume initially situated underneath transitional lithosphere (central plume position on Fig. 2A). Different widths (500 and 2000 km) for the transitional lithospheric segment as well as a weaker rheology for its lower crust (wet diabase flow law instead of dry diabase) have been tested by exp_13-15 (Supplementary Fig.3).
Finally, sets of numerical tests with far-field tectonic extension and homogenous initial lithospheric structure refer to exp_16-18 (Supplementary Fig.4) and exp_19-21 (Supplementary Fig.5), respectively. Exp_22-25 (Supplementary Figs. 6-7) permits to study plume emplacement underneath oceanic or continental lithosphere excluding possible boundary effects due to its decentered initial position.
The complete list of tested experimental settings and corresponding variable parameters can be found in Table 3.
2.2. Results
2.2.1. Effect of initial location, size and rheology of the mantle plume
Below we present the results of modelling of plume emplacement at three locations of a transect connecting oceanic lithosphere, rifted margin lithosphere and continental lithosphere unaffected by lithospheric thinning preceding plume emplacement (Fig. 3).
We begin with the results of plume emplacement under oceanic lithosphere, (exp_1; see Fig. 3A). In doing so, we also follow the evidence for plume emplacement in the Northern
ACCEPTED MANUSCRIPT
Atlantic initiated by the Iceland plume propagating under the rifted margin and adjacent continental lithosphere of Southern Norway (Rickers et al., 2013). In this model (exp_1), the mantle plume is modelled with wet olivine rheology and the transitional lithosphere by a dry olivine rheology (see Table 3). The ascent of the plume material is rapidly associated with break-up. The lateral propagation of plume material remains symmetric until 20 Myr, when it reaches the left boundary of the model box. In opposite direction, plume material spreading is restricted to the boundary between oceanic and transitional continental lithosphere. In terms of topography, the ascending plume head produces large scale uplift (up to 7 km elevation). This initial uplift starts to flatten out after about 5 Myr, quickly reaching a level of small amplitude vertical uplift (600-700 m). The impact of model boundary is minimal here since exp_22 (Supplementary Fig. 6A) results in a very similar distribution of the plume material.
When the plume is located in the middle of the transect (i.e. under the area affected by lithospheric thinning prior the plume emplacement, exp_2; see Fig. 3B), the plume head arrives at the bottom of the lithosphere and starts to flatten laterally in both directions underneath the thinned continental lithosphere. The plume is finally blocked to the right side by the boundary of the lithospheric mantle between thinned lithosphere and continental lithosphere unaffected by rifting. The extension of the plume material is driven by lateral decrease of the thickness of transitional lithosphere segment from the continent to oceanic lithosphere resulting in a clear asymmetric geometry of the plume head. After 20 Myr of evolution, the lateral propagation of the plume material is 100 km more extending toward the oceanic lithosphere.
When the plume is located under continental lithosphere unaffected by prior thinning (exp_3) the mode of plume emplacement and its topographic expression is significantly different (Fig. 3C). After the ascent and the symmetric lateral propagation of the plume head (until 5 Myr), the plume material flows preferentially towards thinned transitional lithosphere to the left from the area of initial plume emplacement. In contrast, on the opposite side the propagation is very limited. The surface topography is characterised by a large-scale uplift of 700 km wide, with amplitude of up to 3-4 km (Fig. 3C). It should be noted, however, that the resulting asymmetrical distribution of plume material is to all appearances due to the boundary effect of the right model limit (compare Fig. 3C with symmetrical pattern of exp_23 shown on Supplementary Fig. 6B). On the contrary, we can exclude the effects of lateral model boundaries in case of a more pronounced plume head asymmetry due to larger initial plume size (compare Fig.4C and Supplementary Fig.7B).
The initial location of the plume strongly impacts its ability to reach the surface (Fig. 3): in case of the plume initially seeded beneath oceanic lithosphere, it reaches the sea floor
ACCEPTED MANUSCRIPT
already after 5 Myr (with lateral spreading afterwards (Fig. 3A)); in contrast, when seeded beneath the continent, the plume is confined to deeper levels of the lithosphere (~150 km) with significant down-thrusting of the overlying mantle on the extremities of the plume (Fig.3C). Noteworthy is also the continuing horizontal expansion of the size of the area affected by the plume during its evolution over a time span of 20 Myr. At the end of propagation, mantle plume material is embedded into the lower part of the lithosphere, forming dense mantle and high-velocity bodies of frozen mantle. The model with initial plume location under rifted margin lithosphere (exp_2) is characterized by an intermediate mode with relatively shallow (50-60 km) plume emplacement associated with down-thrusting of the adjacent continental lithosphere on the right tip of the plume head (Fig. 3B). This results in geometrical asymmetry of the underplating area that develops with time.
In adopting these three initial configurations for plume emplacement, we also explored the impact of a larger plume size (exp_4-6, see Fig. 4 and exp_23-25, see Supplementary Fig. 7). Doubling the size of the initial plume to a half-circle with a radius of 300 km leads to amplified efficiency of horizontal propagation of the plume material. As mentioned above, a larger plume size is also enhancing the asymmetry of the horizontal spreading of the plume at lithospheric level. For example, for the experiments with the mantle plume seeded underneath transitional lithosphere (exp_2 and exp_5), the distance of the propagation towards the oceanic lithosphere (the ‘easiest’ direction of propagation) is 55% (668 km vs. 1036 km, Figs. 3B, 4B) larger in the case of a double size plume (exp_5) whereas in the opposite direction (i.e. toward the continental lithosphere) this amplification is limited to 16% (555 km vs. 645 km, Figs. 3B, 4B). Increasing the plume size up to 400 km (exp_9-11) leads to further increase of the asymmetry in the plume propagation (Supplementary Fig. 1).
We also examined the effect of different plume rheologies. To this aim, we have used a dry olivine rheology for the plume (exp_12, see Supplementary Fig. 2), for comparison with the models adopting a wet olivine plume rheology, presented above. The evolution of this model (including the style of lateral propagation of plume material) is very similar to the corresponding stages of the experiment with identical initial plume position but weaker (wet olivine) plume rheology (exp_2, Fig. 3B). After 20 Myr of model evolution the propagation in the direction of oceanic lithosphere represents 668 km (656 km in the exp_2, Fig. 3B) and 587 km towards the continental lithosphere (555 km in the exp_2, Fig. 3B). In terms of topography, the impact of plume emplacement and propagation is also almost identical.
Below we, therefore, concentrate on the effects of lithosphere rheology on plume emplacement in the area affected by lithospheric thinning prior to plume emplacement (i.e.
ACCEPTED MANUSCRIPT
transitional lithosphere) where these lateral variations by their nature are likely playing an intrinsic role.
2.2.2. Role of the rheology of transitional lithosphere
For comparison with the results of the models assuming a dry olivine rheology for the transitional mantle lithosphere in the rifted margin transect, we have tested here the impact of a wet olivine lithosphere rheology for thinned continental mantle lithosphere (exp_7-8, see Figs. 5-6). It should be noted that the crustal rheology in the transitional zone remains the same as adopted in previous models (e.g. exp_2; Fig. 3B). Both an additional numerical test (exp_15; Supplementary Fig. 3C) as well as our previous studies (François et al., 2012) reveal that the prime control on strength of the lithosphere comes from its mantle part, whereas the role of crustal rheology is minor. Due to weak mantle lithosphere within the transitional segment, emplacement of 150 km-radius (exp_7; Fig. 5) plume has a much more dramatic surface expression and can lead to uplift of mantle plume material up to the surface. Plume ascent accompanies a quick thinning of the continental lithosphere ultimately leading to the crustal break-up at 10 Myr. Uplifted plume material then contributes to formation of new oceanic lithosphere (Fig. 5). It is noteworthy that all the processes take place in the context of purely “active” continental rifting (i.e. without pre-imposed far-field tectonic extension). The lateral spreading of the plume material is less developed and the asymmetry observed after 5 Myr in the exp_2, (Fig. 3B) in this case starts only after 20 Myr. During the model evolution, the lateral spreading of the mantle plume is less in comparison with the exp_2 (i.e. with dry rheology for the transitional mantle lithosphere). Between 5 Myr and 20 Myr, the distance of the propagation of mantle plume material towards the oceanic lithosphere increases only by 23% (Fig. 5), whereas this increase reaches 56% in the case of a dry rheology assumed for the transitional mantle lithosphere (exp_2, Fig. 3B). Such limited lateral flow of plume material towards the oceanic segment is related to deeper penetration of plume material into weak transitional mantle that, in turn, results in its involvement in plume-induced subduction processes (Fig.5). In the other direction of propagation (i.e. towards the continental lithosphere), the spreading of plume material and associated subduction of the mantle material remain limited but well expressed in cases of both strong and weak transitional lithosphere (Figs. 3B, 5).
The experiment with a larger mantle plume (exp_8; Fig. 6) differs by a faster transition to break-up stage (5 Myr instead of 10 Myr in exp_7) and more long-distance plume head propagation toward oceanic lithosphere leading to more developed plume-induced subduction of transitional mantle lithosphere (at the left side of the model).
ACCEPTED MANUSCRIPT
It is noteworthy that in comparison to the rheology of mantle lithosphere within the transitional zone, the initial width of rifted lithosphere plays a much smaller role in the resulting system evolution (see the experiments with transitional lithosphere width of 2000 (exp_13), 1000 (exp_5) and 500 (exp_14) km; Supplementary Fig. 3A, Fig. 4B, Supplementary Fig.3B). It is striking that the modeling predictions (see topography profiles for exp_2, 5, 7 in Figs. 3B, 4B and 5 respectively) match with the overall shape of the differential topography across the rifted margin with an elevated plateau extending over several hundreds of km in the onshore areas with a wavelength far in excess of wavelengths associated with flexural loading of the lithosphere. The magnitudes of the predicted topography in the onshore areas are larger than actually observed (Fig. 1) as a result neglecting erosion in our modelling. Incorporation of erosion through a diffusive erosion law would reduce the magnitude of the plume-induced topography to levels compatible with those actually observed (see for a further discussion e.g. Burov and Poliakov, 2001).
3. Comparison with inferences from 3D models
3.1. Setup of the 3D thermo-mechanical model
The spatial dimensions of the 3D model are 3000 × 2600 × 635 km. The model domain consists of 297 × 257 × 67 nodes, thus offering a spatial resolution of ca. 10 × 10 × 10 km per grid cell.
We incorporate a thermo-rheologically realistic lithosphere fully coupled to mantle dynamics, encompassing a wide region, and including the entire upper mantle. A specific objective here is to put the results of 2D models presented above in a 3D perspective. In doing so, we build also on findings of previous 3D modeling of plume-lithosphere interactions (Burov and Gerya, 2014; Koptev et al., 2015, 2016, 2017). We adopted thermo-mechanical properties of the lithosphere and boundary conditions similar to the ones incorporated in 2D experiments to fine tune the 3D model.
Our 3D model setup targets to mimic the first-order elements controlling the geodynamical setting of continental break-up and plume emplacement in the North Atlantic volcanic rifted margin province. Thus, the model box contains three 1000 km-wide segments of a two-layered oceanic lithosphere embedded into surrounding three-layered continents (Fig. 7A). Continental crust equally divided in felsic (dry quartzite flow law) upper crust and mafic (diabase flow law) lower crust (Table 2) has thinned from 36 km to 18 km (synchronously with the variations in the total lithospheric thickness from 200 km to 75-100 km) within 500
km-ACCEPTED MANUSCRIPT
long zones adjacent to oceanic segments (Fig. 7B). The total thickness of the oceanic lithosphere decreases from 75-100 km near the continental margin to 10 km underneath the mid-ocean ridge whereas its monolayer mafic (diabase flow law) crust keeps a constant thickness of 8 km (Fig. 7B). As in most of the 2D experiments, the ductile rheology of both continental and oceanic lithospheric mantle is conditioned by dry olivine (Table 2) dislocation creep (dry olivine flow law), while sub-lithospheric mantle deforms predominantly by diffusion creep (dry olivine flow law as well). The initial thermal structure refers to a linear piece-wise geotherm with 0°C at the surface, 700°C at the Moho (in the case of the continental lithosphere), 1300°C at the lithospheric base and 1630°C at the model domain bottom. Similarly, to most of the 2D models, we apply zero conductive heat flux and free slip boundary conditions for all vertical boundaries.
The relative position of continental and oceanic lithosphere adopted in our 3D setup corresponds to that of the Northern Atlantic region at 30-35 Ma (Lundin and Doré, 2002): western and eastern oceanic segments have been shifted northward (to 500 km and 400 km, respectively) with respect to the central one (Fig. 7A). The mantle plume has been seeded by a spherical (radius of 250 km) thermal anomaly at the model box bottom underneath the transition zone between continental and oceanic lithosphere in the central segment (Fig. 7A-B). This initial plume location is also consistent with plate-tectonic reconstructions for the Northern Atlantic at 30-35 Ma (Lundin and Doré, 2002).
We have assumed three weak zones corresponding to local lithospheric thinning (up to 90 km): one ridge-parallel 200 km-wide zone incorporated directly above the mantle plume and two 100 km-wide zones stretched along transform faults to the south of it (Fig. 7A-B). The EW-extended weak zone follows evidence for a plume-related jump of spreading axis from the Aegir ridge to the Kolbeinsey ridge soon after the Iceland plume emplacement (Lundin and Doré, 2002). Incorporation of two NS-oriented weak zones is built on the notion that two main fracture zones located within the studied area (the East Jan Mayen Fracture Zone (EJMFZ) and the Denmark Strait Fracture Zone (DSFZ), as shown in Fig. 1) were active in Oligocene.
We refer readers to Gerya (2010), Burov and Gerya (2014) and Koptev et al. (2015, 2016), and to Appendix B and Table 2 for a detailed description of the methods, rheology, and material properties.
3.2. Result of the 3D thermo-mechanical models
Similarly to previous 3D models of plume-lithosphere interaction (Burov and Gerya, 2014; Koptev et al., 2015, 2016, 2017), the mantle plume tends to spread laterally after quick
ACCEPTED MANUSCRIPT
(~0.5 Myr) upwelling up to the lithospheric base (Fig.7c1). However, in the presented experiment, the pre-imposed zones of lithospheric thinning guide its further lateral flow: plume head material that is initially stretched along the EW-oriented weak zone (Fig.7c2), reaches adjacent oceanic segments, and after that it begins to follow two different trends: one part of the plume continues to spread in an EW direction along mid-oceanic ridges, but another one penetrates to the south along two transform-parallel weak zones (Fig. 7c3-4; Supplementary Fig. 9). In the central part of the model domain, plume-induced continental break-up leads to development of a new spreading axis and separation of a continental micro-block from the northern continental segment (Fig. 7c3-4; Supplementary Fig.9).
The resulting distribution of plume material reveals its long-distant (~1000 km) southward propagation along NS-oriented transform faults up to southern segments of the continental lithosphere (Fig. 7c4; Supplementary Fig.9). This overall finding is in general agreement with seismic tomography data showing a present-day Iceland plume stretched not only along the North Atlantic mid-ocean ridge but also along two ridge-perpendicular zones extending into southern Norway and the British Isles (Rickers et al., 2013) (Fig. 1).
The southern propagation of two lobes of partially molten mantle plume material underneath the adjacent volcanic rifted Norway margin and the southern Scandes provides a quantitative support for a causal link between upper mantle “asthenospheric” flow and domal uplift of the Northern Atlantic margin proposed byRohrman and Van Der Beek (1996). In this view, compressional domes seaward of the British Isles and South Norway can be explained by the effect of ridge push on continental lithosphere weakened by hot material from the lobes of the Iceland plume.
The resulting spatial distribution of plume material inferred from our 3D model is largely controlled by the LAB (lithosphere-asthenosphere boundary) topography. More than 1000 km of lateral propagation of the plume along transform weak zones predicted by 3D modelling (Fig. 7C, Supplementary Fig.9) is in agreement with 2D models (e.g., exp_1 and exp_4-5) showing similar long-distance flow underneath relatively thin transitional and/or oceanic lithosphere (Figs. 3A and 4A-B). In contrast, a weaker rheology of the transitional lithosphere could lead to a reduced role of lithospheric thickness variations in the final plume head configuration (exp_7, Fig. 5). This is due to the more profound penetration of plume material inside the transitional mantle lithosphere that favors its more longer distance propagation towards the thicker segment resulting in significant down-thrusting and plume-induced subduction of the continental lithosphere (exp_7, Figure 5). In case of the 3D experiment, the EW-oriented zone of lithospheric thinning situated directly above an upwelled
ACCEPTED MANUSCRIPT
mantle plume plays the role of this “weakening” leading to deep penetration of hot plume material inside the central part of continental lithosphere and its further northward propagation associated with plume-induced continental subduction (Supplementary Fig.9) resembling the results of corresponding 2D model (exp_7, Fig. 5).
4. Discussion and conclusions
In this paper, we present the results of 2D and 3D thermo-mechanical modelling of plume-lithosphere interactions in rifted margin settings. The commonly made assumption of a uniform lithosphere at the site of future break-up (e.g. Burov and Gerya, 2014; d’Acremont et al., 2003; Brune et al., 2013; Koptev et al., 2017) is not realistic, in view of the abundant evidence from the geological record that incipient rifts and rifted margins are usually localized at suture zones separating stronger lithosphere. Examples include the Caledonides suture, surrounded by cratonic lithosphere, localizing Devonian and Permo-Triassic rifting and subsequent continental break- up around 65 Ma in the Northern Atlantic (Smit et al., 2016; Beniest et al., 2017b) and the rift systems created at the edges of the African cratonic lithosphere (Corti et al., 2007; Janssen et al., 1995; Beniest et al., 2017a). For this reason, most of our 2D initial model setups consist of three different segments of oceanic, continental and transitional lithosphere.
Comparison with the results of the models with homogeneous lithosphere (exp_19-21, Supplementary Fig. 5) reveals that lateral variations of lithospheric structures across the margin exert a key control on the dynamic emplacement of plumes and its topographic expression at the surface (exp_1-3, Fig. 3 and exp_22-23, Supplementary Fig. 6 and Supplementary Fig. 8). Note, however, that despite that both the structure of the lithosphere and initial plume position play the most important role in the resulting mode of plume emplacement, the degree of plume head asymmetry is largely controlled by the initial size of the mantle plume anomaly seeded at the bottom of the model box. In contrast, parameters such as the width of the transitional zone or the rheology of its lower crust (exp_13-15) appear to have a less important impact (Supplementary Fig. 3) in comparison to that of the initial plume size and position with respect to inherited lithospheric structure (exp_4-6, Fig. 4 and exp_24-25, Supplementary Fig. 7).
Variations in rheology of the transitional mantle lithosphere (exp_2 and exp_7) have a very important influence on the style of lateral propagation of hot plume material (more distant and asymmetrical in case of stronger rheology and symmetrically restricted by plume-induced subduction in case of weaker mantle, see Fig.3B and 5 respectively). Far-field tectonic forces favour a faster
ACCEPTED MANUSCRIPT
transition to the break-up stage whereas their impact on the resulting distribution of the plume material is limited (exp_16-18; Supplementary Fig.4).
A common feature of most 2D models is that initially the plume weakens the overlying lithosphere (leading in certain cases to continental or intra-oceanic break-up), whereas at the later stage of development frozen mantle plume material is embedded into the lower part of the lithosphere, forming dense and high-velocity bodies commonly observed in volcanic rifted margin settings (Contrucci et al., 2004; Cornwell et al., 2006; Franke et al., 2006; Schnabel et al., 2008; Blaich et al., 2011; Dressel et al., 2015).
As demonstrated in this study, 2D models are useful for parametrical studies, benefiting from complementary 3D approaches for a more detailed comparison with observations from rifted margin systems such as the Northern Atlantic volcanic rifted margin province. We have used detailed 2D analysis when designing the 3D setup model that mimics roughly the relative position of continental and oceanic lithosphere in the Northern Atlantic region at the moment of Iceland plume emplacement (30-35 Ma). In the case of the Northern Atlantic, gravity data and anomalous ocean floor bathymetry demonstrate that the thermal anomaly associated with the Iceland plume has not decayed yet. The observed plume distribution with up to 400 km southward propagation into continental lithosphere can be reproduced by a 3D model containing pre-imposed zones of lithospheric thinning along transform faults (e.g. the East Jan Mayen Fracture Zone and Denmark Strait Fracture Zone, Fig. 1).
Acknowledgments
The authors acknowledge support from ERC Advanced Grant 290864 RHEOLITH (E. Burov, A. Koptev) and ERC Consolidator Grant 615703 EXTREME (A. Koptev), as well as the UPMC visiting professor grant to S. Cloetingh. 3D numerical simulations were performed on the ERC-funded SGI Ulysse cluster of ISTEP. We are very grateful to an anonymous reviewer, Thorsten Becker and the Managing Guest Editor Philippe Agard for their constructive comments that have improved the quality of the manuscript.
References
Abdelmalak, M.M., Andersen, T.B., Planke, S., Faleide, J.I., Corfu, F., Tegner, C., Shephard, G.E., Zastrozhnov, D., Myklebust, R., 2015. The ocean-continent transition in the
mid-ACCEPTED MANUSCRIPT
Norwegian margin: Insight from seismic data and an onshore Caledonian field analogue. Geology, 43, 1011-1014.
Abdelmalak, M.M., Planke, S., Faleide, J.I., Jerram, D.A., Zastrozhnov, D., Eide, S., Myklebust, R., 2016. The development of volcanic sequences at rifted margins: new insights from the structure and morphology of the Vøring Escarpment, mid‐Norwegian Margin. Journal of Geophysical Research: Solid Earth, 121, 5212-5236.
Beniest, A., Koptev, A., Burov. E., 2017a. Numerical models for continental break-up: Applications for South Atlantic. Earth and Planatery Science Letters, 461, 176-189.
Beniest A., Koptev A., Leroy S., Sassi W., Guichet X., 2017b. Two-branch break-up systems by a single mantle plume: Insights from numerical modeling. Geophysical Research Letters, 44, https://doi.org/10.1002/2017GL074866.
Blaich, O.A., Faleide, J.I., Tsikalas, F., 2011. Crustal breakup and continent-ocean transition at South Atlantic conjugate margins. Journal of Geophysical Research: Solid Earth, 116, 1-38.
Braun, J., Beaumont, C., 1989. A physical explanation of the relation between flank uplifts and the breakup unconformity at rifted continental margins. Geology, 17, 760-764.
Brune, S., Popov, A.A., Sobolev, S.V., 2013. Quantifying the thermo-mechanical impact of plume arrival on continental break-up. Tectonophysics, 604, 51-59.
Burov, E., 2011. Rheology and strength of the lithosphere. Marine and Petroleum Geology, 28, 1402-1443.
Burov, E., Cloetingh, S., 1997. Erosion and rift dynamics: new thermomechanical aspects of post-rift evolution of extensional basins. Earth and Planetary Science Letters, 150, 7-26.
Burov, E., Jaupart, C., Mareschal, J. C., 1998. Large-scale crustal heterogeneities and lithospheric strength in cratons. Earth and Planetary Science Letters, 164, 205-219.
Burov, E., Poliakov, A., 2001. Erosion and rheology controls on synrift and postrift evolution: Verifying old and new ideas using a fully coupled numerical model. Journal of Geophysical Research: Solid Earth, 106, 16461-16481.
ACCEPTED MANUSCRIPT
Burov, E., Jolivet, L., Le Pourhiet, L., Poliakov, A., 2001. A thermomechanical model of exhumation of high pressure (HP) and ultra-high pressure (UHP) metamorphic rocks in Alpine-type collision belts. Tectonophysics, 342, 113-136.
Burov, E., Guillou-Frottier, L., 2005. The plume head–continental lithosphere interaction using a tectonically realistic formulation for the lithosphere. Geophysical Journal International, 161, 469-490.
Burov, E., Guillou-Frottier, L., d'Acremont, E., Le Pourhiet, L., Cloetingh, S., 2007. Plume head–lithosphere interactions near intra-continental plate boundaries. Tectonophysics, 434, 15-38.
Burov, E., Yamato, P., 2008. Continental plate collision, P–T–t–z conditions and unstable vs. stable plate dynamics: insights from thermo-mechanical modelling. Lithos, 103, 178-204.
Burov, E., Cloetingh, S., 2009. Controls of mantle plumes and lithospheric folding on modes of intra-plate continental tectonics: differences and similarities. Geophysical Journal International, 178, 1691-1722.
Burov, E., Gerya, T., 2014. Asymmetric three-dimensional topography over mantle plumes. Nature, 513, 85-89.
Caristan, Y.D., 1980. High temperature mechanical behavior of Maryland diabase. Doctoral dissertation, Massachusetts Institute of Technology.
Caristan, Y., 1982. The transition from high temperature creep to fracture in Maryland diabase. Journal Geophysical Research, 87, 6781-6790.
Chery, J., Lucazeau, F., Daignieres, M., Vilotte, J.P., 1992. Large uplift of rift flanks: A genetic link with lithospheric rigidity? Earth and Planetary Science Letters, 112, 195-211.
Cloetingh, S., Burov, E., 2011. Lithospheric folding and sedimentary basin evolution: a review and analysis of formation mechanisms. Basin Research, 23, 257-290.
Cloetingh, S. A. P. L., Ziegler, P. A., Beekman, F., Andriessen, P. A. M., Matenco, L., Bada, G., Garcia-Castellanos, D., Hardebol, N., Dèzes, P., Sokoutis, D., 2005. Lithospheric
ACCEPTED MANUSCRIPT
memory, state of stress and rheology: neotectonic controls on Europe's intraplate continental topography. Quaternary Science Reviews, 24, 241-304.
Cloetingh, S., Burov, E., Matenco, L., Beekman, F., Roure, F., Ziegler, P.A., 2013. The Moho in extensional tectonic settings: Insights from thermo-mechanical models. Tectonophysics, 609, 558-604.
Cloetingh, S., Ziegler, P.A., Beekman, F., Burov. E.B., Garcia-Castellanos, D., Matenco. L., 2015. Tectonic Models for the Evolution of Sedimentary Basins. In Schubert G. (Eds.), Treatise of Geophysics (Second Edition) – Crustal and Lithosphere Dynamics, Oxford: Elsevier, 513-592.
Contrucci, I., Matias, L., Moulin, M., Géli, L., Klingelhofer, F., Nouzé, H., Aslanian, D., Olivet, J.L., Réhault, J.P., Sibuet, J.C., 2004. Deep structure of the West African continental margin (Congo, Zaïre, Angola), between 5S and 8S, from reflection/refraction seismics and gravity data. Geophysical Journal International, 158, 529-553.
Cornwell, D.G., Mackenzie, G.D., England, R.W., Maguire, P.K.H., Asfaw, L.M., Oluma, B., 2006. Northern Main Ethiopian Rift crustal structure from new high-precision gravity data. Geological Society, London, Special Publications, 259, 307-321.
Corti, G., van Wijk, J., Cloetingh, S., Morley, C.K., 2007. Tectonic inheritance and continental rift architecture: Numerical and analogue models of the East African Rift system. Tectonics, 26.
Cundall, P.A., 1989 Numerical experiments on localization in frictional materials. Archive of Applied Mechanics, 59, 148-159.
d’Acremont, E., Leroy, S., Burov, E., 2003. Numerical modelling of a mantle plume: the plume head-lithosphere interaction in the formation of an oceanic large igneous province. Earth and Planetary Science Letters, 206, 379-396.
Dam, G., Larsen, M., Sønderholm, M., 1998. Sedimentary response to mantle plumes: implications from Paleocene onshore successions, West and East Greenland. Geology, 26, 207-210.
ACCEPTED MANUSCRIPT
Daradich, A., Mitrovica, J.X., Pysklywec, R.N., Willett, S.D., Forte, A.M., 2003. Mantle flow, dynamic topography, and rift-flank uplift of Arabia. Geology, 31, 901-904.
Dressel, I., Scheck-Wenderoth, M., Cacace, M., Lewerenz, B., Götze, H.J., Reichert, C., 2015. Reconstruction of the southwestern African continental margin by backward modeling. Marine and Petroleum Geology, 67, 544-555.
Durham, W.B., Mei, S., Kohlstedt, D.L., Wang, L., Dixon, N.A., 2009. New measurements of activation volume in olivine under anhydrous conditions. Physics of the Earth and Planetary Interiors, 172, 67-73.
Ebbing, J., England, R.W., Korja, T., Lauritsen, T., Olesen, O., Stratford, W., Weidle, C., 2012. Structure of the Scandes lithosphere from surface to depth. Tectonophysics, 536, 1-24.
François, T., Burov E., Agard P., Meyer B., 2014, Buildup of a dynamically supported orogenic plateau: Numerical modeling of the Zagros/Central Iran case study. Geochemistry, Geophysics, Geosystems, 15.
François, T., Burov, E., Meyer, B., Agard, P., 2012. Surface topography as key constraint on thermo-rheological structure of stable cratons. Tectonophysics, 602, 106-123.
Franke, D., 2013. Rifting, lithosphere breakup and volcanism: Comparison of magma-poor and volcanic rifted margins. Marine and Petroleum Geology, 43, 63-87.
Franke, D., Neben, S., Schreckenberger, B., Schulze, A., Stiller, M., Krawczyk, C.M., 2006. Crustal structure across the Colorado Basin, offshore Argentina. Geophysical Journal International, 165, 850-864.
Gerya, T.V., 2010. Introduction to Numerical Geodynamic Modelling. Cambridge University Press, 358 pp.
Goetze, C., Evans, B., 1979. Stress and temperature in the bending lithosphere as constrained by experimental rock mechanics. Geophysical Journal International, 59, 463-478.
Guillou-Frottier, L., Burov, E., 2003. The development and fracturing of plutonic apexes: implications for porphyry ore deposits. Earth and Planetary Science Letters, 214, 341-356.
ACCEPTED MANUSCRIPT
Huismans, R.S., Podladchikov, Y.Y., Cloetingh, S., 2001. Transition from passive to active rifting: Relative importance of asthenospheric doming and passive extension of the lithosphere. Journal of Geophysical Research: Solid Earth, 106, 11271-11291.
Janssen, M.E., Stephenson, R.A., Cloetingh, S.A.P.L., 1995. Temporal and spatial correlations between changes in plates motions and the evolution of rifted basins in Africa. Geological Society of America Bulletin, 107, 1317-1332.
Japsen, P., Bonow, J.M., Green, P.F., Chalmers, J.A., Lidmar-Bergström, K., 2006. Elevated, passive continental margins: Long-term highs or Neogene uplifts? New evidence from West Greenland. Earth and Planetary Science Letters, 248, 330-339.
Japsen, P., Green, P.F., Bonow, J.M., Nielsen, T.F., Chalmers, J.A., 2014. From volcanic plains to glaciated peaks: Burial, uplift and exhumation history of southern East Greenland after opening of the NE Atlantic. Global and Planetary Change, 116, 91-114.
Karato, S.I., Jung, H., 2003. Effects of pressure on high-temperature dislocation creep in olivine. Philosophical Magazine, 83, 401-414.
Karato, S.I., Wu, P., 1993. Rheology of the Upper Mantle. Science, 260, 771-778.
Kooi, H., Cloetingh, S., Burrus, J., 1992. Lithospheric necking and regional isostasy at extensional basins 1. Subsidence and gravity modeling with an application to the Gulf of Lions margin (SE France). Journal of Geophysical Research: Solid Earth, 97, 17553-17571.
Koptev, A., Calais, E., Burov, E., Leroy, S., Gerya, T., 2015. Dual continental rift systems generated by plume-lithosphere interaction. Nature Geoscience, 8, 388-392.
Koptev, A., Burov, E., Calais, E., Leroy, S., Gerya, T., Guillou-Frottier, L., Cloetingh, S., 2016. Contrasted continental rifting via plume-craton interaction: Applications to Central East African Rift. Geoscience Frontiers, 7, 221-236.
Koptev, A., Burov, E., Gerya, T., Le Pourhiet, L., Leroy, S., Calais, E., JolivetL., 2017. Plume-induced continental rifting and break-up in ultra-slow extension context: Insights from 3D numerical modeling. Tectonophysics.
ACCEPTED MANUSCRIPT
Lobkovsky, L.I., Cloetingh, S.A.P.L., Nikishin, A.M., Volozh, Y.A., Lankreijer, A.C., Belyakov, S.L., Groshev, V.G., Fokin, P.A., Milanovsky, E.E., Pevzner, L.A. and Gorbachev, V.I., 1996. Extensional basins of the former Soviet Union—structure, basin formation mechanisms and subsidence history. Tectonophysics, 266, 251-285.
Lundin, E., Doré, A.G., 2002. Mid-Cenozoic post-breakup deformation in the ‘passive’ margins bordering the Norwegian–Greenland Sea. Marine and Petroleum Geology, 19, 79-93.
Maupin, V., Agostini, A., Artemieva, I., Balling, N., Beekman, F., Ebbing, J., England, R.W., Frassetto, A., Gradmann, S., Jacobsen, B.H., Köhler, A., Kvarven, T., Medhus, A.B., Mjelde, R., Ritter, R., Sokoutis, D., Stratford, W., Thybo, H., Wawerzinek, B., Weidle, C., 2013. The deep structure of the Scandes and its relation to tectonic history and present-day topography. Tectonophysics, 602, 15-37.
Mosar, J., Lewis, G., Torsvik, T., 2002. North Atlantic sea-floor spreading rates: implications for the Tertiary development of inversion structures of the Norwegian-Greenland Sea. Journal of the Geological Society, 159, 503-515.
Poliakov, A.N.B., Cundall, P., Podladchilov, Y., Laykhovsky, V., 1993. An explicit inertial method for the simulation of visco-elastic flow: an evaluation of elastic effects on diapiric flow in twoor three-layers models. In D.B. Stone and S.K. Runcorn (Eds), Flow and creep in the solar system: observations, modelling and theory. Dynamic Modelling and Flow in the Earth Planet Series, 175-195.
Praeg, D., Stoker, M.S., Shannon, P.M., Ceramicola, S., Hjelstuen, B., Laberg, J.S., Mathiesen, A., 2005. Episodic Cenozoic tectonism and the development of the NW European ‘passive’ continental margin. Marine and Petroleum Geology, 22, 1007-1030.
Ranalli, G., 1995. Rheology of the Earth. 2nd edn, Chapman and Hall, London, 413 pp.
Rickers, F., Fichtner, A., Trampert, J., 2013. The Iceland-Jan Mayen plume system and its impact on mantle dynamics in the North Atlantic region: evidence from full-waveform inversion. Earth and Planetary Science Letters, 367, 39-51.
ACCEPTED MANUSCRIPT
Rohrman, M., Beek, P., Andriessen, P., Cloetingh, S., 1995. Meso‐Cenozoic morphotectonic evolution of southern Norway: Neogene domal uplift inferred from apatite fission track thermochronology. Tectonics, 14, 704-718.
Rohrman, M., Van Der Beek, P., 1996. Cenozoic postrift domal uplift of North Atlantic margins: an asthenospheric diapirism model. Geology, 24, 901-904.
Smit, J., van Wees, J.D., Cloetingh, S., 2016. The Thor suture zone: From subduction to intraplate basin setting. Geology, 44, 707-710.
Schnabel, M., Franke, D., Engels, M., Hinz, K., Neben, S., Damm, V., Grassmann, S., Pelliza, H., Dos Santos, P.R., 2008. The structure of the lower crust at the Argentine continental margin, South Atlantic at 44S. Tectonophysics, 454, 14-22.
Turcotte, D.L., Schubert, G., 2002. Geodynamics, Applications of Continuum Physics to Geological Problems. 2nd edn, Cambridge Univ. Press, Cambridge.
Vâgnes, E., Gabrielsen, R., Haremo, P., 1998. Late Cretaceous-Cenozoic intraplate contractional deformation at the Norwegian continental shelf: Timing, magnitude and regional implications. Tectonophysics, 300, 29-46.
Van Der Beek, P., Cloetingh, S., Andriessen, P., 1994. Mechanisms of extensional basin formation and vertical motions at rift flanks: Constraints from tectonic modelling and fission-track thermochronology. Earth and Planetary Science Letters, 121, 417-433.
Van Der Beek, P., Andriessen, P., Cloetingh, S., 1995. Morphotectonic evolution of rifted continental margins: Inferences from a coupled tectonic-surface processes. Tectonics, 14, 406-421.
Van Wijk, J.W., Cloetingh, S.A.P.L., 2002. Basin migration caused by slow lithospheric extension. Earth and Planetary Science Letters, 198, 275-288.
Weissel, J.K., Karner, G.D., 1989. Flexural uplift of rift flanks due to mechanical unloading of the lithosphere during extension. Journal of Geophysical Research: Solid Earth, 94, 13919-13950.
ACCEPTED MANUSCRIPT
Yamato, P., Burov, E., Agard, P., Le Pourhiet, L., Jolivet, L., 2008. HP-UHP exhumation processes during continental subduction (W. Alps): when thermomechanical models reproduce P-T-t data. Earth and Planetary Science Letters, 271, 63-75.
Ziegler, P.A., 1992. Geodynamics of rifting and implications for hydrocarbon habitat. Tectonophysics, 215, 221-253.
Ziegler, P.A., Cloetingh, S., 2004. Dynamic processes controlling evolution of rifted basins. Earth-Science Reviews, 64, 1-50.
ACCEPTED MANUSCRIPT
Figure Caption
Figure 1: (A) Seismic tomography delineating a zone of mantle upwelling under the Northern
Atlantic and adjacent continental areas. Seismic velocity perturbations from full waveform inversion are shown for a depth slice at 120 km. Red areas depict location of Iceland plume and its side lobes extending into southern Norway, the British Isles, and central Europe. All of these areas are undergoing recent uplift in an intraplate tectonic setting, far from plate boundaries (modified from Rickers et al., 2013). Abbreviations: EJMFZ, the East Jan Mayen Fracture Zone; DSFZ, the Denmark Strait Fracture Zone. (B) Vertical slices through the βsh-componet (from Rickers et al., 2013) and associated surface topography.
Figure 2: (A) Design of 2D model setup. The experiments are based on the available data on
the structure and physical properties of Scandinavia’s North Atlantic rifted margin. The red dotted line represents the 1300°C isotherm corresponding to the bottom of the thermal lithosphere. Note three segments corresponding to oceanic (left), transitional (central) and continental (right) lithosphere. Three initial plume locations tested in different experiments of this study are shown as well. (B) Representative viscous-elastic-plastic yield strength profiles for oceanic, transitional and continental lithosphere calculated for a strain rate of 10-15 s-1. The brittle-elastic-ductile rheology is different for the upper crust, lower crust, mantle lithosphere and asthenosphere (see also Table 1).
Figure 3: Experiments showing the impact of initial positions of the mantle plume with respect
to inherited lithospheric structure. Colours indicate compositional phases (see Fig. 2), black lines correspond to the 1000°C, 1200°C and 1400°C isotherms. On the topography panel, arrows and values represent the horizontal propagation of the plume material. (A) (left panel) Evolution of the exp_1 (plume under the oceanic lithosphere). After the ascent of plume material associated with the break-up of the oceanic crust, the lateral propagation of plume material remains symmetric until 20 Myr. (B) (central panel) Evolution of the exp_2 (plume under transitional Phanerozoic lithosphere), 1 Myr - ascent of the plume mantle up to the bottom of the continental lithosphere, 5 Myr - mantle plume lateral propagation in the two directions, 10 Myr - beginning of asymmetric expansion of plume material. Spreading of the mantle plume head is mainly driven by thinning of the transitional lithosphere toward the oceanic segment. 20 Myr - large asymmetric lateral spreading of plume mantle material. The lateral propagation in the direction of the oceanic lithosphere continues whereas the plume material remains
ACCEPTED MANUSCRIPT
blocked at the boundary between transitional Phanerozoic and undeformed Proterozoic lithosphere. (C) (right panel) Evolution of the exp_3 (plume under continental Proterozoic lithosphere). After the ascent and the symmetric lateral plume propagation (until 5 Myr), plume material flows preferentially towards thinner segments of transitional lithosphere. On the opposite side the propagation is very limited.
Figure 4: Experiments showing the impact of a larger size of the mantle plume (300 km radius).
(A) (left panel) Evolution of the exp_4 (plume under the oceanic lithosphere). (B) (central panel) Evolution of the exp_5 (plume under transitional Phanerozoic lithosphere). (C) (right panel) Evolution of the exp_6 (plume under continental Proterozoic lithosphere). Typical for this set of experiments, amplified plume-lithosphere interactions lead to the asymmetric propagation of the plume material that starts quicker and with higher amplitude comparing to the models presented in Fig. 3. Note that a larger mantle plume is characterized by a most stretched head (at 1 Myr) that results in longer wavelength surface topography comparing to the relatively shorter (but higher) wavelength response in case of a smaller plume (see Fig.3A).
Figure 5: Evolution of the exp_7 characterized by a weak rheology of the mantle of transitional
lithosphere. (A) Thinning of the weak transitional continental lithosphere associated with the ascent of the plume. (B) Lateral propagation of the plume material is limited in comparison with the exp_2 (see Fig. 3B). (C) Break-up associated with the uplift of plume material up to the surface. Termination of the rifting process and onset of symmetric lateral propagation of plume material. (D) Limited asymmetric lateral propagation.
Figure 6: Evolution of the exp_8 characterized by a weak rheology of the mantle of transitional
lithosphere and larger size of the mantle plume.
Figure 7: (A) Plan-view of 3D setup: gradient colors from white to orange and blue illustrate
gradual transition from minimum to maximum values of lithospheric thickness for oceanic and continental segments, respectively; transparent white indicates the weak zones corresponding to areas of local lithospheric thinning. (B) Vertical cross section A1-A2 through the central part of initial 3D setup: thickness of oceanic and continental lithosphere varies from 10 km to 75-100 km and from 75-75-100 km to 200 km, respectively; EW-oriented weak zone is situated within transitional continental lithosphere directly above a 250 km-radius mantle plume. (C) Plan-view of the 3D model evolution: (c1) uplift of the mantle plume to the base of the lithosphere; (c2)
ACCEPTED MANUSCRIPT
symmetrical lateral spreading of the plume material following pre-defined EW weak zone; (c3) onset of mantle plume flow in two perpendicular directions: along spreading ridges and along transform faults; (c4) resulting remote (~1000 km) southward propagation of the plume head material (see also Supplementary Figure 9 for resulting 3D configuration). Note that the 3D model provides a set of snapshots of tipping points of first-order features of tectonic regimes in the North-Atlantic region, but is not aiming for its detailed time evolution.
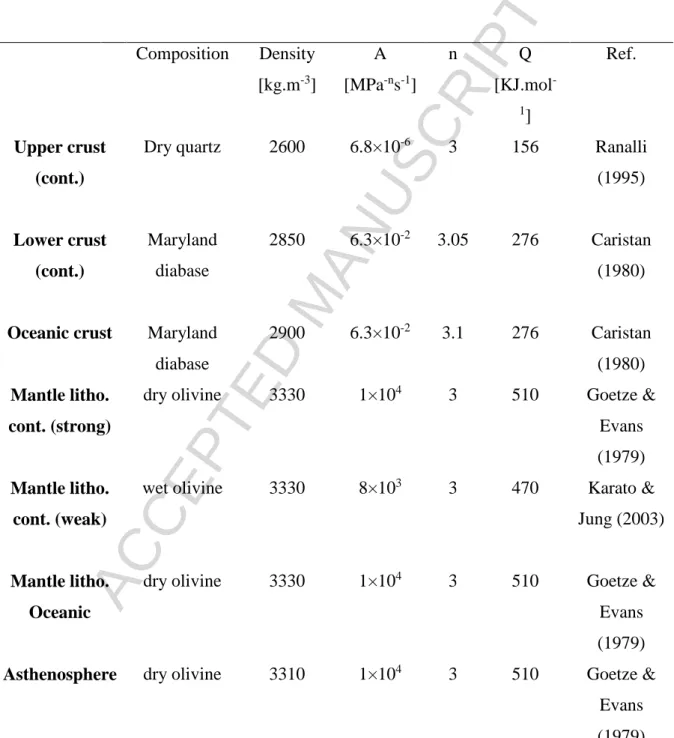
Table 1: Thermo-mechanical parameters and boundary conditions used in numerical
experiments (Turcotte and Schubert, 2002).
Table 2: Ductile parameters used in this study. The activation volume of mantle rocks is 4.510
-6 m3 mol-1. For the diffusion creep the activation energy E
a =300 kJ mol-1, Ad = 1.9210-10 MPa
-1 s-1, a = 1 and m=1 (Karato and Wu, 1993).
ACCEPTED MANUSCRIPT
Appendix: Numerical method description Appendix A. 2D Numerical model
We use our thermo-mechanical code Flamar v12 to assess the response of a multilayered visco-elasto-plastic lithosphere. The code is based on the FLAC(Cundall, 1989) and Parovoz algorithm (Poliakov et al., 1993) and is described in many previous studies (e.g., Burov and Poliakov, 2001; Burov et al., 2001; Burov et al., 2003; Burov and Guillou-Frottier, 2005; Burov and Cloetingh, 2009). Here we limit the description of the code to its most essential features: the ability to handle (1) large strains and multiple visco-elastic-plastic rheologies (EVP) including Mohr-Coulomb failure (faulting) and non-linear pressure-temperature and strain-rate dependent creep; (2) strain localization; (3) thermo-dynamic phase transitions; (4) internal heat sources.
A.1. Basic equations
As its prototypes FLAC (Cundall, 1989) and Parovoz(Poliakov et al., 1993), Flamar has a mixed finite-difference/finite element numerical scheme, with a Cartesian coordinate frame and 2D plane strain formulation. The Lagrangian mesh is composed of quadrilateral elements subdivided into 2 couples of triangular sub-elements with tri-linear shape functions. Flamar uses a large strain fully explicit time-marching scheme. It locally solves full Newtonian equations of motion in a continuum mechanics approximation:
〈𝜌𝑢̈〉 − ∇𝜎 − 𝜌𝑔 = 0 (A.1)
coupled with constitutive equations: 𝐷𝜎
𝐷𝑡 = 𝐹(𝜎, 𝑢, 𝑣, ∇𝑣, … 𝑇 … ) (A.2)
and with equations of heat transfer, with the heat advection term included in the Lagrangian derivative DT/Dt, are:
CpDT/Dt –(kT)− ∑ 𝐻𝑛𝑖 𝑖 = 0 (A.3)
= f(P,T) (A.4)
Here u, , g, k are the respective terms for displacement (𝑣 = 𝑢̇), stress, acceleration due to body forces and thermal conductivity. P is pressure (negative for compression). The thermo-mechanical parameters used in the numerical modelling are provided in Table 1. The inertial term (first parameter in the equation A.1) is negligible for geodynamic applications. It
ACCEPTED MANUSCRIPT
is retained since FLAC employs an artificial inertial dampening density allowing to slow-down the elastic waves and hence advance with considerably larger time steps (Cundall, 1989) than would be required in a fully inertial mode. The triangular brackets in Eq. (A.1) specify conditional use of the related term (in quasi-static mode inertial terms are damped using inertial mass scaling (Cundall, 1989)). The terms t, , Cp, T, Hi designate respectively time, density,
specific heat capacity, temperature, internal heat production per unit volume, respectively. The symbol means summation of various heat sources Hi. The expression = f(P,T) refers to the
formulation, in which phase changes are taken into account and density is computed by a thermodynamic module that evaluates the equilibrium density of constituent mineralogical phases for given P and T as well as latent heat contribution Hl to the term (∑𝑛𝑖 𝐻𝑖= Hr + Hf + Hl
+ Ha…), which also accounts for radiogenic heat Hr , frictional dissipation Hf and adiabatic
heating Ha. The terms D/Dt and F are the objective Jaumann stress time derivative and a
functional, respectively. In the Lagrangian method, incremental displacements are added to the grid coordinates allowing the mesh to move and deform with the material. This permits for the solution of large-strain problems while using locally a small-strain formulation: on each time step the solution is obtained in local coordinates, which are then updated in a large-strain mode, as in a standard finite element framework. The adiabatic heating term is specified as (Gerya, 2010): 𝐻𝑎 = 𝛼𝑇𝜌𝑣𝑦𝑔
1−𝛼(𝑇−𝑇0) where To=298 K and α is the coefficient of thermal expansion
Solution of Eq. (A.1) provides velocities at mesh points used for computation of element strains and of heat advection . These strains are used in Eq. (A.2) to calculate element stresses and equivalent forces used to compute velocities for the next time step. Due to the explicit approach, there are no convergence issues, which is rather common for implicit methods in case of non-linear rheologies. The algorithm automatically checks and adopts the internal time step using 0.1 – 0.5 of Courant’s criterion of stability, which warrants stable solution.
A.2. Phase changes
Direct solution for density (Eq. (A.4), = f(P,T)) is obtained from optimization of Gibbs free energy for a typical mineralogical composition (5 main mineralogical constituents) of the mantle and lithosphere. With that goal, Flamar was coupled with the thermodynamic codes PERPLE_X (Connolly, 2005) and Theriak (De Capitani, 1994). PERPLE_X was used for mantle and most crustal rocks and Theriak – for granites and sediments (Yamato et al., 2007,
ACCEPTED MANUSCRIPT
2008). These codes minimize free Gibbs energy G for a given chemical composition to calculate an equilibrium mineralogical assemblage for given P-T conditions:
𝐺 = ∑𝑛𝑖=1𝜇𝑁𝑖 (A.5)
where i is the chemical potential and Ni the moles number for each component i constitutive
of the assemblage. Given the mineralogical composition, the computation of density is straightforward (Yamato et al., 2007, 2008). The thermodynamic and solid state physics solutions included in PERPLE_X also yield estimations for elastic and thermal properties of the materials, which are integrated in the thermo-mechanical kernel Flamar via Eq. (A.1), (A.2), (A.3) and (A.4).
A.3. Explicit elastic-viscous-plastic rheology
We use a serial Maxwell-type solid valid for isotropic material, in which the total strain increment in each numeric element is defined by the sum of elastic, viscous and brittle strain increments. In contrast to fluid dynamic approaches, where non-viscous rheological terms are simulated using pseudo-plastic and pseudo-elastic viscous terms (e.g., Bercovici et al., 2001; Solomatov and Moresi, 2000), Flamar explicitly treats all rheological terms. The parameters of elastic-ductile-plastic rheology laws for crust and mantle derived from rock mechanics data are provided in Table 2 (Kirby and Kronenberg, 1987 and Kohlstedt et al., 1995).
A.4. Plastic (brittle) behaviour
The brittle behavior of rocks is described by Byerlee’s law (Byerlee, 1978; Ranalli, 1995) which corresponds to a Mohr-Coulomb material with friction angle = 30° and cohesion C0 < 20 MPa:
= C0 + n tan (A.6)
where n is normal stress n = ⅓I + II dev sin, ⅓I = P is the effective pressure (negative for compression), II dev is the second invariant of deviatoric stress, or effective shear stress. The condition of the transition to brittle deformation (function of rupture f) reads as:
f = II dev + P sin - C0 cos = 0 (A.7) and