HAL Id: hal-00328596
https://hal.archives-ouvertes.fr/hal-00328596
Submitted on 6 Jun 2006
HAL is a multi-disciplinary open access
archive for the deposit and dissemination of
sci-entific research documents, whether they are
pub-lished or not. The documents may come from
teaching and research institutions in France or
abroad, or from public or private research centers.
L’archive ouverte pluridisciplinaire HAL, est
destinée au dépôt et à la diffusion de documents
scientifiques de niveau recherche, publiés ou non,
émanant des établissements d’enseignement et de
recherche français ou étrangers, des laboratoires
publics ou privés.
Lively data: discover, browse and access ocean altimetry
data on internet
V. Rosmorduc, T. Jolibois, O. Lauret
To cite this version:
V. Rosmorduc, T. Jolibois, O. Lauret. Lively data: discover, browse and access ocean altimetry data
on internet. Advances in Geosciences, European Geosciences Union, 2006, 8, pp.82. �hal-00328596�
www.adv-geosci.net/8/79/2006/
© Author(s) 2006. This work is licensed under a Creative Commons License.
Advances in
Geosciences
Lively data: discover, browse and access ocean altimetry data on
internet
V. Rosmorduc1, T. Jolibois2, and O. Lauret3
1Collecte Localisation Satellites (CLS), 8-10 rue Hermes, 31520 Ramonville, StAgne, France 2Coframi, Toulouse, France
3Silogic, Toulouse, France
Received: 15 September 2005 – Revised: 10 February 2006 – Accepted: 5 March 2006 – Published: 6 June 2006
Abstract. The Products and Services (P&S) department in the Space Oceanography Division at CLS (Collecte, Lo-calisation, Satellites) is in charge of distributing and pro-moting altimetry and operational oceanography data. The department is thus involved in the Aviso satellite altimetry project (the French service which distributes altimetry prod-ucts since 1992), in the Mercator ocean operational fore-casting system, and in the European Godae/Mersea ocean portal. Aiming to a standardisation and a common vision and management of all these ocean data, all these projects, led to the implementation of several Opendap/LAS Inter-net servers (Baudel et al., 2004). Some of the possibilities of the tools, as well as how-to information will be high-lighted, as they are in the “Lively data” section of Aviso web-site (see http://www.aviso.oceanobs.com/html/donnees/las/). Moreover, with a two-year experience we now have some feedback and analysis of how people – users, would-be users and students alike – are using this tool, some ideas for possi-ble enhancements, etc.
1 Altimetry & Aviso
Space altimetry is a technique that measure sea surface height by satellite. Level 2 data, Geophysical Data Record, are along-track products with the complete set of measure-ments, auxiliary data and corrections, and thus quite hard to use. Higher-level data were therefore designed to help users handle altimetry data. However, even with gridded data some new users have problems – mostly programming difficulties. Moreover, even expert users often want a “quick-look” view on a dataset. Such easiness to create plots and visualise data is also a major asset for education (to help student in getting familiar with satellite data) and for outreach, too (to show
in-Correspondence to: V. Rosmorduc
terested people – including would-be users – what the data can “look” like). Thus interactive visualization is clearly a need.
Aviso stands for Archiving, Validation and Interpretation of Satellite Oceanographic data. It was set up in 1992 to process, archive and distribute data from the NASA (Na-tional Aeronautics and Space Administration)/CNES (Centre National d’ ´Etudes Spatiales) ocean radar altimetry satellite Topex/Poseidon (T/P). Now, thirteen years later, Aviso user service’s activities encompass (Rosmorduc, 2005):
– Operational distribution of Topex/Poseidon, Jason-1
and Envisat Geophysical Data Records (GDRs);
– Distribution of high-level altimetry products, including
operational distribution of Ssalto/Duacs near-real time products;
– A catalogue of altimetry, orbit determination and
pre-cise location products;
– Outreach of ocean altimetry, orbit determination and
precise location activities.
All information, whether on data, the missions or out-reach are updated on the Aviso website (http://www.aviso. oceanobs.com), in both French and English (a Spanish sec-tion is also available, for basic informasec-tion, but not updated). During those years, many changes occurred. The major change in data distribution has come from Internet. On-line distribution became possible around 1995, and feasible (at least for developed countries) about 1999–2000 for im-portant amounts of data with high bandwidth Internet. In the same time, data format standardisation was progressing. Moreover, interactive tools have now reached a maturity that enable a centre like Aviso to use them for its data. Thus inter-active access and visualization of altimetry data is possible.
80 V. Rosmorduc et al.: Discover, browse and access ocean altimetry data on internet
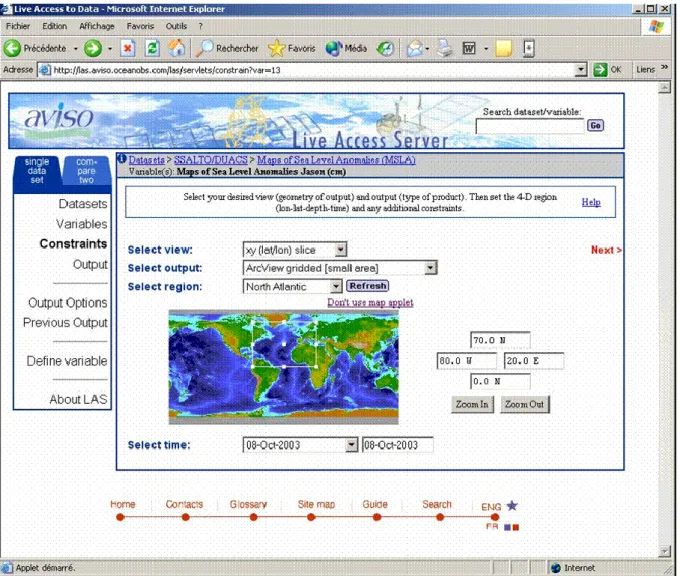
Fig. 1. Aviso Live Access Server.
2 Opendap & Live Access Server
Aviso opened an Opendap and a Live Access Server in 2003 (http://opendap.aviso.oceanobs.com; http://las.aviso. oceanobs.com). The Opendap enables access to remote data sets through familiar data analysis and visualization pack-ages, whereas the Live Access Server is an interactive on-line visualization tool for plotting gridded data. This choice was made in the Godae and Mersea international operational oceanography project frame.
2.1 What are Opendap and LAS?
Opendap (Open source Project for a Network Data Access Protocol, a.k.a. DODS, see http://opendap.org/) handles transport, translation and extracting subsets of data. It allows you to access remote data over the internet:
– using familiar data analysis and visualization
pack-ages like Matlab, Ferret, IDL,... as if the data were
on your computer (see http://opendap.org/developers/ third party software.html)
– without worrying about data storage formats, translating
them on-the-fly (including in ascii), if necessary The Live Access Server (or LAS) is an online graphical in-terface designed to provide flexible access to geo-referenced scientific data. It can present distributed data sets as a uni-fied virtual data base through the use of Opendap network-ing (http://ferret.pmel.noaa.gov/Ferret/LAS). Versatile and interactive, it can be used for plotting and retrieving gridded data. The use is rather intuitive for non-expert public, and does not need data-plotting dedicated software to be installed on the user’s computer. LAS enables the Web user to:
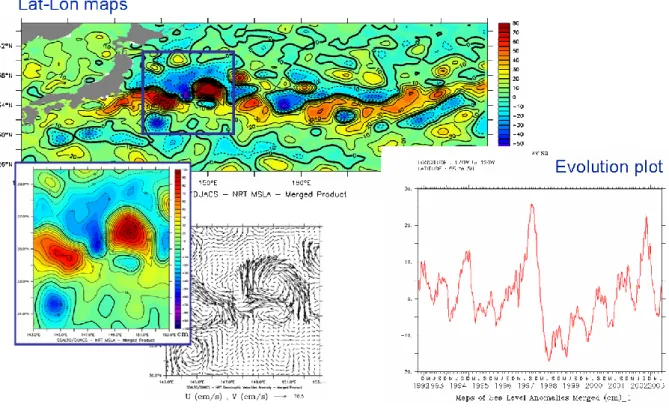
– visualize data with on-the-fly graphics (plotting maps,
but also longitude-time or along-time evolution at one point. . . ),
Fig. 2. Some plots made by Aviso Live Access Server. Statistical plots (average, variance), hovmoller (longitude-time) diagram are also
possible, as well as comparison plots.
– request custom subsets of variables in a choice of file
formats (gif, ascii, NetCDF),
– compare (difference) variables from distributed
loca-tions,
– retrieve statistical information about the data (min, max,
average, variance. . . ),
– access background reference material about the data
(metadata).
Ferret is the default visualization application used by LAS, though other applications (Matlab, IDL, GrADS,...) can also be used by the Opendap (see).
2.2 Aviso Live Access Server
Aviso Live Access Server distributes several Ssalto/Duacs altimetry products such as delayed and near-real time sea level anomalies, absolute dynamic topography, absolute geostrophic velocities, gridded significant wave height and gridded wind speed modulus. These data are issued from a set of four altimetry satellites: GFO (Geosat Follow-On), Jason-1, Envisat, Topex/Poseidon. Merged products pro-cessed from the combination of the different satellites’ data are also distributed. Long time-series are thus available, with more than twelve years of gridded sea level anomalies over the whole ocean.
2.3 Feedback: uses & users
The HTTP protocol allows logs analysis of whom (by IP number), and what, is downloaded or visualized by the Open-dap and Live Access Server. More than 230 different IP ad-dresses connected in April 2005, for 8036 requests on the Live Access Server. Most users are laboratories, or scien-tific organization, with some few individuals connected by an Internet access provider. Opendap use is slowly increasing, with some peaks mostly due to a lone user; Opendap users are only professionals, from organizations like Noaa (USA), or Ifremer (France).
Analysing what and how people use those tools, we can discriminate between several user profiles, mainly between “data fans”, mostly scientists who download a lot of data and “onlookers”, who prefer to visualize one or a few plots. How-ever, it is clear that, for now, users are mostly people who seem to know about altimetry and Aviso data, since the most accessed data are not the first ones of the list, but the best in term of quality (“merged” data, i.e. multi-missions datasets).
3 “Lively data”: an online tutorial for Aviso LAS
The Live Access Server allows quite a lot of visualisation and plots, it is easier-to-use than Opendap directly, but ad-vanced capabilities are somehow a bit hard to find and use,
82 V. Rosmorduc et al.: Discover, browse and access ocean altimetry data on internet
and the tool, like most, has its own quirks and some non-evident tricks. Thus we decided to propose users with a regular chronicle on Aviso web site, called “Lively data” (“Balades en LAS” in the French version) dedicated to LAS tips and tricks. For example, how to constrain minimum and maximum of the color scale, or how to do an average, how to show contours, or not, or how to compute variance, and over how large an area and how long a period it is feasible to do it, etc. Moreover, this is one more element for the web site life, always a good thing to have visitors coming back. It is also a more efficient way of promoting this tool and having people have a look at it than a one-shot announcement.
By 25 April, 2005, we published 32 pages (in both En-glish and French, see http://www.aviso.oceanobs.com/html/ donnees/las/), making a review of the tool possibilities with oceanographic examples (see Fig. 2): modifying output op-tions (including scale extrema, or colors), computing statisti-cal functions, comparing data, working with time series, etc., and showing along the way all the available data.
4 Conclusions
Opendap/LAS are quite well adapted to scientific & non-scientific users, but they are still a bit complicated for every-body. Features as we propose in the “Lively data” pages are useful for data users, even new to the field, but still need a bit of oceanographic background, and some knowledge of the data, and of mathematics (what are averages, variances, etc.). For a really general audience, simplification would have to be made in the list of available data, keeping only the most rele-vant. Some adapted preferences should be used for the plots (e.g. color scale minima and maxima, often irrelevant when automatic for altimetry data), and some options rendered un-available. For educational use, translation would also be in order.
In that optic, too, especially for end-users and education, we plan to investigate the possible use of Opendap with a GIS (e.g. Map Server), that would require less knowledge about the data and about data plotting in general, and propose mouse-drive interactive capabilities.
Edited by: E. Cutrim, M. Ramamurthy, S. Nativi, and L. Miller Reviewed by: anonymous referees
References
Aviso website: http://www.aviso.oceanobs.com, Aviso Live Access Server: http://las.aviso.oceanobs.com; Aviso Opendap: http: //opendap.aviso.oceanobs.com.
Baudel, S., Blanc, F., Jolibois, T., and Rosmorduc, V.: Discover, browse and access ocean data on internet, PV-2004 Ensuring the Long-Term Preservation and Adding Value to the Scientific and Technical Data, Frascati, 2004.
Live Access Server website: http://ferret.pmel.noaa.gov/Ferret/ LAS/, 10 February 2005.
Lively data website: http://www.aviso.oceanobs.com/html/ donnees/las/.
Opendap website: http://opendap.org, 10 February 2005.
Rosmorduc, V.: Aviso, at the crossroad between user service, out-reach and education, Adv. Geosci., 4, 1–4, 2005.