HAL Id: ird-00747306
https://hal.ird.fr/ird-00747306
Submitted on 31 Oct 2012
HAL is a multi-disciplinary open access
archive for the deposit and dissemination of
sci-entific research documents, whether they are
pub-lished or not. The documents may come from
teaching and research institutions in France or
abroad, or from public or private research centers.
L’archive ouverte pluridisciplinaire HAL, est
destinée au dépôt et à la diffusion de documents
scientifiques de niveau recherche, publiés ou non,
émanant des établissements d’enseignement et de
recherche français ou étrangers, des laboratoires
publics ou privés.
Population genetic structure of blue-spotted maskray
Neotrygon kuhlii and two other Indo-West Pacific
stingray species (Myliobatiformes: Dasyatidae), inferred
from size-polymorphic intron markers
Philippe Borsa, Irma Arlyza, Martin Laporte, Patrick Berrebi
To cite this version:
Philippe Borsa, Irma Arlyza, Martin Laporte, Patrick Berrebi. Population genetic structure of
blue-spotted maskray Neotrygon kuhlii and two other Indo-West Pacific stingray species (Myliobatiformes:
Dasyatidae), inferred from size-polymorphic intron markers. Journal of Experimental Marine Biology
and Ecology, Elsevier, 2012, 438, pp.32-40. �ird-00747306�
1
To be cited as:
Borsa P., Arlyza I.S., Laporte M., Berrebi P. (2012) Population genetic structure of blue-spotted maskray Neotrygon kuhlii and two other Indo-West Pacific stingray species (Myliobatiformes: Dasyatidae), inferred from size-polymorphic intron markers. J. Exp. Mar. Biol. Ecol. 438, 32-40. [doi:10.1016/j.jembe.2012.09.010]
Population genetic structure of blue-spotted maskray
Neotrygon kuhlii
and two other Indo-West
Pacific stingray species (Myliobatiformes: Dasyatidae), inferred from size-polymorphic intron
markers
Philippe Borsa
a,*, Irma S. Arlyza
b, Martin Laporte
c,d, Patrick Berrebi
ca
Institut de recherche pour le développement (IRD), UR 227 « Biocomplexité des écosystèmes récifaux »,
Montpellier, France
b
Lembaga Ilmu Pengetahuan Indonesia (LIPI), Pusat Penelitian Oseanografi (P2O), Ancol, Jakarta,
Indonesia
c
Institut des sciences de l'évolution à Montpellier (ISE-M), UMR 5554 UM2-CNRS-IRD, Université
Montpellier 2, CC065, Place E. Bataillon, 34095 Montpellier cedex 5, France
d
Centre de recherche sur les bassins versants - écosystèmes aquatiques, Université du Québec à
Trois-Rivières, Trois-Trois-Rivières, Canada
*
Corresponding author, present address: Indonesian Biodiversity Research Center, Universitas Udayana, Jl
Sesetan Gang Markisa 6, Denpasar, Indonesia
E-mail: philippe.borsa@ird.fr (P. Borsa)
2
ABSTRACT
Exon-primed, intron crossing DNA markers (EPICs) were screened for Mendelian-like allele size
polymorphisms in three stingray species (Himantura gerrardi, Neotrygon kuhlii and Taeniura lymna) from the
central Indo-West Pacific, where they are commercially exploited. Four to 7 size-polymorphic intron loci
were selected in a species, and were subsequently tested as genetic markers of stock structure. Sharp genetic
differentiation was observed between populations within each species across the Indo-Malay-Papua
archipelago (Weir and Cockerham’s ^θ-values reaching 0.153-0.557 over a few thousand km). A trend of
increasing genetic differentiation with increasing geographic distance was apparent in N. kuhlii, in which
populations distant by 3,000 km were differentiated by an estimated ^θ ~ 0.375. This value was an order of
magnitude higher than usually reported in coastal benthic teleost fishes and indicates strong sub-population
structure. This is likely, at least partly, a consequence of the sedentary benthic habits of N. kuhlii at all life
stages. Because replenishment of overexploited populations of N. kuhlii and two other stingray species from
the central Indo-West Pacific is unlikely at ecological timescales, management should be planned at the local
geographic scale.
Keywords: Himantura gerrardi; Taeniura lymna; population genetic structure; fishery; conservation;
Indo-Malay-Papua archipelago
1. Introduction
One of the problems hampering the proper management of commercially exploitable marine species is
the trade-off between the effort necessary for the acquisition of scientifically sound information and the
increasing pace at which these resources rarefy. This is particularly true for developing nations in the central
Indo-West Pacific region, where marine species richness is highest (Briggs, 2005; Bellwood and Meyer,
2009), human pressure is strong (Sadovy, 2005), management is poor (Pauly, 1994), and science is weaker
than in other regions in the Indo-Pacific (Haustein et al., 2011; Meijaard, 2011). The low fecundity and slow
maturation of sharks and rays (elasmobranchs), in particular, make them highly vulnerable to overfishing.
There is increasing concern over their exploitation in Indonesia, the most populated country of the central
Indo-West Pacific (Blaber et al., 2009; White and Kyne, 2010). However, little effort for management and
conservation has been made thus far (Blaber et al., 2009; White and Kyne, 2010). If unsustainable
exploitation is allowed to continue unmonitored and unregulated, it will cause the depletion of stocks, erode
genetic diversity, and eventually lead to the extinction of many shark and ray species in this region.
Among the pre-requisites for sound fishery management is the identification of stocks, a goal that can
be reached by assessing the geographic structure of populations using genetic markers (Shaklee and Bentzen,
1998; Begg et al., 1999; Ward, 2000). Assessing geographic structure in sharks has been hampered due to
low variability of allozyme markers and in mitochondrial DNA (Heist et al., 2003). Recent studies of
population genetic structure in elasmobranchs have relied on the hypervariable mitochondrial control region
sequences and on microsatellite polymorphisms (Chevolot et al., 2008; Schluessel et al., 2010; Le Port and
Lavery, 2012; Portnoy and Heist, 2012). The degree of genetic population subdivision in rays and skates still
remains under-investigated (Schluessel et al., 2010) although there is an urgent need for such information
for commercially targeted species in the central Indo-West Pacific.
3
The initial aim of the present study was to select size-polymorphic nuclear markers in several stingray
species (Elasmobranchia: Dasyatidae). Exon-primed, PCR-amplified introns (EPIC) were chosen because
they can provide such markers of population genetic structure with minimal investment. For instance, a
single pair of universal EPIC primers simultaneously allows the amplification of up to several introns in a
gene family (Chow and Takeyama, 1998; Hassan et al., 2002; Atarhouch et al., 2003). Compared to
microsatellites, another advantage of EPIC markers is that null alleles are less likely, since EPIC primers are
anchored in conserved regions. Last, an undesirable property of microsatellites is allele-size homoplasy
(Garza and Freimer, 1996; Ellegren, 2004), which is unlikely to occur with EPIC markers when mutations
that affect allele size are caused by indels (Creer, 2007). We screened for size polymorphism a number of
primer pairs that are known to amplify EPICs in teleost fishes. The rationale for expecting
cross-amplification with stingrays comes from the fact that exons of a number of EPIC genes are conserved
across orders in Metazoans (e.g. Palumbi et al. 1991; Chenuil et al., 2010). Three stingray species among the
most common at fish landing sites in the Indo-Malay-Papua archipelago in the central Indo-West Pacific
(White and Dharmadi, 2007) were chosen as test species: the sharpnose stingray, Himantura gerrardi (Gray,
1851), the blue-spotted maskray, Neotrygon kuhlii (Müller and Henle, 1841) and the ribbontail stingray,
Taeniura lymna (Forsskål, 1775). Whether the selected intron markers are suitable for assessing population
genetic structure was further investigated in N. kuhlii, on the basis of an adequate geographic sampling that
extended from the Indian Ocean Java coast to the Molucca Sea. Prior to the present survey,
cytochrome-oxidase I gene sequences from a barcoding survey of Indo-Australian chondrichthyans have shown strong
genetic differences within H. gerrardi and N. kuhlii (Ward et al., 2008), but no firm evidence that both
actually harbour cryptic species within the Indo-Malay archipelago. The present survey may help address this
issue because nuclear markers allow the detection of reproductive isolation when cryptic species co-occur
sympatrically.
2. Materials and methods
2.1. Sampling
Three stingray species, Himantura gerrardi, Neotrygon kuhlii and Taeniura lymna were sampled from 3-6
landing sites across the Indo-Malay-Papua archipelago (Fig. 1). Sample sizes per species per sampling site
ranged from 2 to 40. A piece of flesh and skin (0.05-0.5 cm²) was dissected at the extremity of the disk using
surgical scissors, and immediately preserved in ethanol. Total genomic DNA was extracted using the
DNeasy® Tissue Kit (Qiagen GmbH; Hilden, Germany), or using Chelex 100 resin beads (Bio-Rad,
Hercules CA) according to Walsh et al. (1991).
2.2. PCR conditions and selection of markers
A preliminary series of tests consisted of amplifying by polymerase chain reaction (PCR) the DNA of
2-6 individuals from each of 3 regional samples of each stingray species using 20 EPIC primer pairs
available in our laboratory (Supplementary material, Table S1). Those primer pairs that revealed
size-polymorphic loci were then selected. PCRs were carried out in a total volume of 10 μL, containing 1 μL 10X
Taq buffer (Promega Corporation, Madison WI), 2.5mM MgCl
2, 0.2mM of each dNTP (Invitrogen, San
Diego CA), 0.5 mM of each primer (MWG-Biotech, Ebersberg, Germany), the forward primer being
fluorescently labelled with either 6-carboxyfluorescein (6-FAM), indodicarbocyanine (Cy5), or
4
tetramethylrhodamine (TAMRA), 0.3 U Taq polymerase and 1 μL template DNA (at about 150 mg/ml).
PCRs were run in a Mastercycler thermal cycler (Eppendorf, Hamburg, Germany), where thermo-cycling
conditions consisted of initial heating at 94°C for 3 min, followed by 35 cycles of heating at 94°C for 1 min,
annealing at 54°C for 1 min, extension at 72°C for 1 min 20 s, before 10 min final extension at 72°C. The
PCR products were mixed with 1 vol. loading buffer, denatured for 5 min at 95 °C, loaded into vertical 8%
denaturing polyacrylamide gels, and subjected to electrophoresis for 1 hr at 60 W. Fluorescent DNA bands
were detected in an FMBIO® II gel scanner (Hitachi Instruments, San José CA).
For each primer pair, a gel exhibited 2 to >8 distinct horizontal series of fluorescent bands in a
species. Each series of bands was examined for eventual band-size variation and was interpreted as
co-dominant size-polymorphism at a Mendelian locus when the following conditions were met: (1) an
individual exhibited either one or two bands; (2) the most commonly encountered bands in two-banded
individuals were also observed in at least one single-banded individual; (3) the proportions of single-banded
and double-banded individuals in a given sample were reasonably close to those expected for homozygotes
and heterozygotes for co-dominant alleles at a Mendelian locus in a panmictic population. Photographs of
gels where Mendelian-like intron-length polymorphisms were scored have been presented previously (Borsa
et al., 2004; Berrebi et al., 2005; Rohfritsch and Borsa, 2005; Hoareau et al., 2007) and the scan image of a
gel illustrating Mendelian-like size polymorphism in T. lymna is presented in Fig. 2. The presumptive loci
selected after this first step were then scored for all individuals.
Scoring of individual genotypes was done by eye directly from the gel scan. Sizing of alleles was done
with the help of the FMBIO® II gel scan analysis software (Hitachi Instruments) using as a reference a
fluorescent DNA ladder (Internal Lane Standard 600; 60-600 bp; Promega Corporation) loaded at regular
intervals in the gel.
2.3. Genetic data analysis
Estimators of genetic differentiation between populations (Fst) were Weir and Cockerham’s (1984)
multilocus ^θ and Nei and Chesser’s (1983) ^Gst, the proportion of genetic diversity that resides among
sub-populations. Unlike Weir and Cockerham’s (1984) θ which was estimated from genotype frequencies, Gst
was estimated from allele frequencies, in order to compare the present results with cases from the literature
where only allele frequency data are available. Both θ and Gst were estimated using GENETIX v 4.02
(Belkhir et al., 2000). The estimated values of θ were compared to pseudo-distributions generated by
random permutations of individuals under GENETIX 4.02 as a test of the null hypothesis θ = 0. Wright’s
Fis was estimated using Weir and Cockerham's (1984) multiallelic ^f estimator. The null hypothesis f = 0
(panmixia) was tested using a similar permutation test under GENETIX 4.02. The probability of occurrence
of a parameter value larger than or equal to the observed value was estimated as P = (n+1)/(N+1), where n
is the number of pseudo-values larger (or lower for negative ^f) than or equal to the observed value, and N
is the number of random permutations (Sokal and Rohlf, 1995).
The correlation coefficient between genotypes at different loci, R (Garnier-Géré and Dillmann, 1992),
was used as a measure of linkage disequilibrium. Random permutations of genotypes at a locus (procedure
PERMUTATIONS of GENETIX 4.02) were used to generate a pseudo-distribution of R under the null
hypothesis of linkage equilibrium. The correlation coefficient, R, and its associated probability under the null
hypothesis, P, were estimated for each locus pair by GENETIX 4.02. Statistical significance of the estimated
values was assessed after correcting for multiple tests (Rice, 1989).
Geographic distance between sampling locations was calculated as the shortest ship distance, using the
PATH tool implemented in Google Earth (http://www.google.co.uk/intl/en_uk/earth/). The habitat is
bi-5
dimensional and the correlation of genetic distance with geographic distance was analyzed according to the
two-dimensional model of isolation by distance (IBD) (Rousset, 1997).
The number of populations present in the total sample of N. kuhlii was determined and individuals
were assigned to these populations using the model-based program STRUCTURE 2.3.1 (Falush et al., 2007).
The Markov chain Monte Carlo algorithm implemented in STRUCTURE was run under the admixture
model with correlated allele frequencies for 100,000 steps after 50,000 initial burn-in steps, without any a
priori information on an individual’s sampling location, to estimate individual admixture proportions and
assign individuals to populations. Five independent runs were performed for each number of populations
(K) ranging a priori from 2 to 6 to determine the number of populations a posteriori by visually comparing
the output diagrams.
IBD and Bayesian structure analyses were not carried out in the two other stingray species, H. gerrardi
and T. lymna, because of an insufficient geographic coverage and an insufficient number of samples.
3. Results
Six primer pairs (Act-2, AldoB5, Cam-3, CK, Gpd2, and RP) (Table 1) each allowed the scoring of at
least one presumptive polymorphic locus in at least one of three stingray species surveyed for intron-size
polymorphism (Tables 2-4; multilocus genotypes in Supplementary material, Tables S2-S4). The CK primer
pair allowed the scoring of a single polymorphic locus in each of the three species. Fig. 2 illustrates
Mendelian-like size-polymorphism at locus CK in Taeniura lymna, where all three phenotypes expected for a
co-dominant gene at a single locus with two size-alleles are present. All primer pairs of Table 1 have been
previously selected to amplify size-polymorphic introns in teleost fishes (Chow and Hazama, 1998; Chow
and Takeyama, 1998; Hassan et al., 2002; Atarhouch et al., 2003; Berrebi et al., 2005). Up to 5 polymorphic
loci were scored with a single primer pair (e.g. Cam-3; Table 2), which can be due to either amplification of
the paralogous intron in several genes of the family (e.g. Friedberg and Rhoads, 2002; Creer, 2007), or
perhaps non-specific amplification within a single gene (i.e. several introns of the same gene might have
been amplified). For all the other primer pairs tested (Supplementary material, Table S1), either the DNA
band patterns were not variable (thus exhibiting sample monomorphism), or they were variable but we
failed to interpret them in terms of size polymorphism at Mendelian loci. In a few cases, the amplification
was too weak for scoring, the intensity of DNA bands was highly variable across individuals, or a substantial
proportion of individuals could not be scored either because of bands that were too weak or because of
overlapping bands presumably from other loci.
The suitability of the selected markers to the analysis of population genetic structure was warranted by
the general conformity of the genotype frequencies to Hardy-Weinberg expectations, as Weir and
Cockerham’s (1984) ^f-estimates were generally not significantly different from 0 (Tables 2-4). There was no
evidence of linkage disequilibrium between loci except between Cam-3 slow and CK in N. kuhlii from the
Banda Sea (R=0.306; N=43; P<0.001). Detailed results of linkage-disequilibrium tests are presented in
Supplementary material, Table S5.
The estimate of genetic differentiation between sub-populations was strong in all three species (Table
5), particularly in Neotrygon kuhlii where a trend of increasing genetic differentiation with increasing
geographic distance was apparent (Fig. 3) and populations separated by a distance of 3,000 km were
genetically differentiated by an estimated Weir and Cockerham’s (1984) ^θ ~ 0.375 (Fig. 3).
The most likely outcome from Bayesian structure analysis, which was run for K=2-6, was with K=3.
The case where K=2 provided less information than K=3, and the structure diagrams obtained when K>3
6
were increasingly noisy as K increased, yet not more informative than with K=3 (see Supplementary material,
Table S6 for a comparison of the different structure diagrams). Thus, three genetically distinct populations
were identified in N. kuhlii by Bayesian structure analysis (Fig. 1A; Fig. 4) and confirmed the strong partition
inferred from the overall Fst estimate (^θ = 0.336): one that includes the two samples from the Indian
Ocean Java coast; a second that includes the samples from the Bali Strait and the Flores Sea; and a third that
was sampled in the Banda Sea only. According to Bayesian structure analysis, the sample from Tomini Bay
was close to both the Indian Ocean population and to the Bali Strait / Flores Sea population, although the
latter relationship was weaker. Because of the small size of the Tomini Bay sample, its assignment to the
Indian Ocean (or Bali Strait / Flores Sea) population should be considered as tentative only. Overall,
different oceanic basins seemed to harbour genetically differentiated N. kuhlii populations.
One of the H. gerrardi samples was of unknown origin. We observed that genetic differentiation
between the two geographically close samples from the Sunda Strait and the Java Sea was much lower than
genetic differentiation between the two most distant samples (Indian Ocean vs. West Papua) with an
intermediate value for intermediate distances (e.g. Java Sea vs. Indian Ocean) (Table 5B). Assuming a general
trend of increasing genetic differentiation with increasing geographic distance in this species, as in N. kuhlii,
it is possible to infer the approximate geographic origin of the ‘Unknown’ sample as geographically
intermediate between the Indian Ocean and West Papua, and likely closer to the Indian Ocean than to the
other sampled locations (Table 5B).
4. Discussion
Elasmobranchs suffer indiscriminate exploitation in the Indo-Malay-Papua archipelago (Blaber et al.,
2009; White and Kyne, 2010). Given the K-selected life-history characteristics of elasmobranchs, the
sustainability of the stocks and even the survival of some of the most vulnerable species are becoming more
and more a matter of concern (White and Kyne, 2010). Hence, there is an urgent need to analyze stock
structure and provide fisheries and environmental managers with information on population genetic
structure, which is relevant to designing management policies.
4.1. Suitability of intron markers to assess population genetic structure in stingrays
Screening size polymorphisms using PCR primers known to amplify potentially polymorphic introns
in teleost fishes proved an efficient strategy to select a reasonable number of Mendelian-like markers in
several stingray species. Here, we showed that these size–polymorphic introns can be employed to assess
population geographic structure, which in turn could have useful applications, including the delineation of
stocks and the recognition of distinct genetic units of conservation interest.
4.2. Investigating mechanisms of genetic differentiation
The levels of population genetic differentiation in Himantura gerrardi, Neotrygon kuhlii and Taeniura lymna
in the Indo-Malay-Papua archipelago (present study), were comparable to the only figure published thus far
for another stingray species, Dasyatis brevicaudata. In this species, a significant level of genetic differentiation
(^Fst = 0.160; mitochondrial DNA control region) has been reported between populations sampled in
southwestern Australia and New-Zealand (separated by ca. 5,100 km). However, in the same study, the
^Fst-value between populations from southwestern Australia and southeastern Australia, separated by >2,800 km
7
continuous shelf habitat, was only 0.010, whereas the ^Fst -value across the Tasman Sea (ca. 2,200 km deep
sea) was 0.030 (Le Port and Lavery, 2012). In other coastal benthic elasmobranchs, genetic differentiation
estimates at nuclear loci (using Wright’s Fst or equivalents) ranged from 0.002 to 0.065 over thousands of
km (Fig. 5). These average ^Fst-values may mask locally sharp heterogeneities, as in the Milk shark, where
populations from Bali and the northern Great Barrier Reef separated by 3,510 km differed by ^Fst=0.268
(Ovenden et al., 2011).
Comparing the levels of genetic differentiation available from the few nuclear-genetic surveys of
coastal benthic elasmobranchs, with those from the literature on teleost fishes, four outliers were visible and
they included two Dasyatidae from the Indo-Malay-Papua archipelago (H. gerrardi and N. kuhlii; present
study) (Fig. 5; more details in Supplementary material, Table S7). The two other outliers were two teleost
fishes sampled across the Indo-West Pacific, the narrow-barred Spanish mackerel Scomberomorus commerson
(Fauvelot and Borsa, 2011) and the fourfinger threadfin Eleutheronema tetradactylum (Horne et al., 2011). Since
all the other ^Fst values for coastal elasmobranchs were positioned within the cluster characterizing most
coastal teleosts, there is no evidence from these data, that coastal elasmobranchs have higher geographic
composition than teleosts sharing similar habitats. However, the four outliers were sampled in, roughly, the
same central Indo-West Pacific region, suggesting a possible common history of past geographic isolation in
this region, which would have thus translated into a similarly high level of genetic differentiation between
populations. The Coral Triangle is a well known area of major biogeographic breaks for marine fauna
(Rocha et al., 2007; Carpenter et al., 2011). The phylogeographic patterns uncovered within the Coral
Triangle for a proportion of marine animal species with wide Indo-West Pacific distribution point to
Plio-Pleistocene vicariance (Barber et al., 2006; Carpenter et al., 2011). The vicariance hypothesis may be invoked
to explain the high level of genetic differentiation among stingray populations in the Indo-Malay-Papua
archipelago. However, a more exhaustive and finer-grained geographic sampling is required to test this
hypothesis in the three stingray species investigated in the present paper.
Alternatively, the general pattern of increasing genetic differentiation with geographic distance in N.
kuhlii may be caused, at least in part, by IBD, as a result of genetic drift at neutral loci locally balanced by
low levels of gene flow. The estimates of genetic differentiation (Fst) in benthic teleosts for which IBD
patterns were observed were ~0.008 (Hypoplectrus puella; Puebla et al., 2009), ~0.020 (Solea solea; Borsa et al.,
1997b), ~ 0.030 (Platichthys flesus; Borsa et al., 1997a), ~0.034 (Psetta maxima; Blanquer et al., 1992), ~ 0.091
(Myripristis berndti; Muths et al., 2011), ~0.100 (Acanthurus triostegus; Planes and Fauvelot, 2002), and ~0.259
(Eleutheronema tetradactylum; Horne et al., 2011), for a 3,000 km geographic distance, to be compared with N.
kuhlii (~ 0.375). Marine teleosts, including species that are sedentary as adults, are often broadcast spawners
and have a pelagic larval stage, two traits which are assumed to enhance gene flow between local
populations. Stingrays are viviparous (Hamlett and Hysell, 1998) and only the active movement of juveniles
or adults potentially translates into gene flow, thus partly explaining a possible higher level of genetic
differentiation in N. kuhlii than generally observed in coastal benthic teleosts where an IBD pattern has been
observed. This is further supported by tagging experiments in N. kuhlii, which indicate this as a sedentary
species (Pierce et al., 2011).
Also, deep oceanic waters likely constitute a barrier for the movements of stingray species from
shallow benthic habitats, like D. brevicaudata (Le Port and Lavery, 2012) and possibly N. kuhlii and the two
other stingray species surveyed. The sharp delineation of three N. kuhlii populations in the central part of
the Indo-Malay-Papua archipelago, as apparent even from the limited sampling of the present study, may be
partly explained by the effect of deep-sea barriers restricting the migration of individuals in some regions
(e.g., between the Flores Sea and the Banda Sea). However, it is still possible that geographically tighter
sampling would reveal smoother transitions between populations. Thus, the present phylogeographic
8
structure of N. kuhlii in the Indo-Malay archipelago may be caused by the superimposition of genetic
differences resulting from past geographic isolation, IBD, and possibly the present effect of deep-sea
barriers. Strong population subdivision could also be enhanced by philopatry, as shown in other
elasmobranchs (Keeney et al., 2003, 2005; Feldheim et al., 2004; Duncan et al., 2006) and, incidentally, as
suspected in both the narrow-barred Spanish mackerel and the fourfinger threadfin (Fauvelot and Borsa,
2011; Horne et al., 2011).
4.3. ‘Cryptic species’ hypothesis
To be able to assess whether the genetic clusters obtained in this study for N. kuhlii represent distinct
evolutionary significant units and therefore constitute incipient species or even, perhaps, cryptic species as
envisaged by Ward et al. (2008), would require a geographically denser and broader analysis of population
genetic structure, and an extension of the current mitochondrial dataset. There is no evidence, from the
available data thus far, that reproductively isolated entities (in short, cryptic species) are present in the three
regions sampled in the Indo-Malay archipelago, i.e., the Indian Ocean coast of Java; the Bali Strait / Flores
Sea area, and the Banda Sea. Actually, from the present evidence, one cannot discard the hypothesis that N.
kuhlii populations are strongly differentiated because of low but geographically continuous gene flow.
Neither was there an indication from the limited sample set analysed in this study, that H. gerrardi harbours
cryptic species.
4.4. Implications for management
Whatever the evolutionary processes that have led to the strong geographic structure observed in N.
kuhlii and two other Dasyatidae surveyed from the Indo-Malay-Papua archipelago, our findings indicate that
under local overfishing the global genetic diversity of the species is likely to erode, putative locally adapted
genetic traits may be lost, and the replenishment of depleted populations is expected to be minimal at the
ecological timescale. Consequently, if the absence of management persists, localized extinctions or
near-extinctions are predicted to occur in stingray populations throughout the intensively-exploited
Indo-Malay-Papua archipelago. It is arguable that in highly mobile elasmobranch species such as pelagic sharks and
mobulid rays, conservation efforts have to be conducted at the regional scale (e.g., Ovenden et al., 2009).
Because of sharp geographic composition synonymous to limited genetic exchange between local
populations, N. kuhlii and other stingray species from the central Indo-West Pacific also need to be
managed locally.
Acknowledgements
We are grateful to five reviewers for their insightful comments on a former version of the manuscript.
We thank M. Zaini and K. Jamil for participating in the collection of samples, and A. Kusler for
copy-editing a previous version of this manuscript. I.S.A. benefitted from a 6-months fellowship under the BEST
program of Agence inter-organismes de recherche pour le développement (AIRD), France, for working with
P. Borsa and P. Berrebi at ISE-M. Conceived and designed the experiments: P. Borsa, ML, P. Berrebi.
Performed the experiments: P. Borsa, ISA, ML. Analyzed the data: P. Borsa, P. Berrebi. Contributed
reagents/materials/analysis tools: P. Borsa, ISA, P. Berrebi. Wrote the paper: P. Borsa. Funded by AIRD,
9
IRD, ISE-M and LIPI-P2O; the funders had no role in study design, data collection and analysis, decision to
publish, or preparation of the manuscript.
References
Atarhouch, T., Rami, M., Cattaneo-Berrebi, G., Ibanez, C., Augros, S., Boissin, E., Dakkak, A., Berrebi, P., 2003. Primers for EPIC amplification of intron sequences for fish and other vertebrate population genetic studies. Biotechniques 35, 676-682. Barber, P.H., Erdmann, M.V., Palumbi, S.R., 2006. Comparative phylogeography of three codistributed stomatopods: origins and
timing of regional lineage diversification in the Coral Triangle. Evolution 60, 1825-1839.
Begg, G.A., Friedland, K.D., Pearce, J.B., 1999. Stock identification and its role in stock assessment and fisheries management: an overview. Fisheries Res. 43, 1–8.
Belkhir, K., Borsa, P., Chikhi, L., Raufaste, N., Bonhomme, F., 2000. GENETIX version 4.02, logiciel sous WindowsTM pour la génétique des populations. CNRS UMR 5000, Université Montpellier 2, Montpellier
(http://www.genetix.univ-montp2.fr/genetix/).
Bellwood, D.R., Meyer, C.P., 2009. Searching for heat in a marine biodiversity hotspot. J. Biogeogr. 36, 569–576.
Berrebi, P., Boissin, E., Fang, F., Cattaneo-Berrebi, G., 2005. Intron polymorphism (EPIC-PCR) reveals phylogeographic structure of Zacco platypus in China: a possible target for aquaculture development. Heredity 94, 589-598.
Blaber, S.J.M., Dichmont, C.M., White, W., Buckworth, R., Sadiyah, L., Iskandar, B., Nurhakim, S., Pillans, R., Andamari, R., Dharmadi, Fahmi, 2009. Elasmobranchs in southern Indonesian fisheries: the fisheries, the status of the stocks and management options. Rev. Fish Biol. Fisheries 19, 367-391.
Blanquer, A., Alayse, J.-P., Berrada-Rkhami, O., Berrebi, P., 1992. Allozyme variation in turbot (Psetta maxima) and brill (Scophthalmus
rhombus) (Osteichthyes, Pleuronectoformes, Scophthalmidae) throughout their range in Europe. J. Fish Biol. 41, 725-736.
Borsa, P., 2003. Genetic structure of round scad mackerel Decapterus macrosoma (Carangidae) in the Indo-Malay archipelago. Mar. Biol. 142, 575-581.
Borsa, P., Blanquer, A., Berrebi, P., 1997a. Genetic structure of the flounders Platichthys flesus and P. stellatus at different geographic scales. Mar. Biol. 129, 233-246.
Borsa, P., Collet, A., Durand, J.-D., 2004. Nuclear-DNA markers confirm the presence of two anchovy species in the Mediterranean. C. R. Biol. 327, 1113–1123.
Borsa, P., Naciri, M., Bahri, L., Chikhi, L., García de León, F.J., Kotoulas, G., Bonhomme, F., 1997b. Zoogéographie infraspécifique de la mer Méditerranée. Analyse des données génétiques populationnelles sur seize espèces atlanto-méditerranéennes (poissons et invertébrés). Vie Milieu 47, 295-305.
Briggs, J.C., 2005. The marine East Indies: diversity and speciation. J. Biogeogr. 32, 1517-1522.
Carpenter, K.E., Barber, P.H., Crandall, E.D., Ablan-Lagman, M.C.A., Ambariyanto, Mahardika, G.N., Manjaji-Matsumoto, B.M., Juinio-Meñez, M.A., Santos, M.D., Starger, C.J., Toha, A.H.A., 2011. Comparative phylogeography of the Coral Triangle and implications for marine management. J. Mar. Biol. 2011, 396982, 14 p.
Chenuil, A., Hoareau, T.B., Egea, E., Penant, G., Rocher, C., Aurelle, D., Mokhtar-Jamai , K., Bishop, J.D.D., Boissin, E., Diaz, A., Krakau, M., Luttikhuizen, P.C., Patti, F.P., Blavet, N., Mousset, S., 2010. An efficient method to find potentially universal population genetic markers, applied to metazoans. BMC Evol. Biol. 10, 276.
Chevolot, M., Ellis, J.R., Rijnsdorp, A.D., Stam, W.T., Olsen, J.L., 2008. Temporal changes in allele frequencies but stable genetic diversity over the past 40 years in the Irish Sea population of thornback ray, Raja clavata. Heredity 101, 120–126.
Chevolot, M., Hoarau, G., Rijnsdorp, A.D., Stam, W.T., Olsen, J.L., 2006. Phylogeography and population structure of thornback rays (Raja clavata L., Rajidae). Mol. Ecol. 15, 3693–3705.
10
Chow, S., Takeyama, H., 1998. Intron length variation observed in the creatine kinase and ribosomal protein genes of the swordfish
Xiphias gladius. Fisheries Sci. 64, 397-402.
Creer, S., 2007. Choosing and using introns in molecular phylogenetics. Evol. Bioinform. 3, 99-108.
Dudgeon, C.L., Broderick, D., Ovenden, J.R., 2009. IUCN classification zones concord with, but underestimate, the population genetic structure of the zebra shark Stegostoma fasciatum in the Indo-West Pacific. Mol. Ecol. 18, 248–261.
Duncan, K.M., Martin, A.P., Bowen, B.W., De Couet, H.G., 2006. Global phylogeography of the scalloped hammerhead shark (Sphyrna lewini). Mol. Ecol. 15, 2239–2251.
Ellegren, H., 2004. Microsatellites: simple sequences with complex evolution. Nature Rev. Genet. 5, 435-445.
Falush, D., Stephens, M., Pritchard, J., 2007. Inference of population structure using multilocus genotype data: dominant markers and null alleles. Mol. Ecol. Resour. 7, 574–578.
Fauvelot, C., Borsa, P., 2011. Patterns of genetic isolation in narrow-barred Spanish mackerel (Scomberomorus commerson) across the Indo-West Pacific. Biol. J. Linn. Soc. 104, 886-902.
Feldheim, K.A., Gruber, S.H., Ashley, M.V., 2004. Reconstruction of parental microsatellite genotypes reveals female polyandry and philopatry in the lemon shark, Negaprion brevirostris. Evolution 58, 2332–2342.
Forsskål, P., 1775. Descriptiones animalium, avium, amphibiorum, piscium, insectorum, vermium; quae in itinere orientali observavit Petrus Forskål (post mortem auctoris edidit Carsten Niebuhr). Adjuncta est materia medica kahirina atque tabula maris Rubri geographica. Mölleri, Hauniae, xxxiv+164 pp.
Francisco, S.M., Faria, C., Lengkeek, W., Vieira, M.N., Velasco, E.M., Almada, V.C., 2011. Phylogeography of the shanny Lipophrys
pholis (Pisces: Blenniidae) in the NE Atlantic records signs of major expansion event older than the last glaciations. J. Exp.
Mar. Biol. Ecol. 403, 14-20.
Friedberg, F., Rhoads, A.R., 2002. Multiple calmodulin genes in fish. Mol. Biol. Rep. 29, 377-382.
Gaither, M.R., Bowen, B.W., Bordenave, T.-R., Rocha, L.A., Newman, S.J., Gomez J.A., van Herwerden L., Craig, M.T., 2011. Phylogeography of the reef fish Cephalopholis argus (Epinephelidae) indicates Pleistocene isolation across the indo-pacific barrier with contemporary overlap in the coral triangle. BMC Evol. Biol. 11, 189.
Garnier-Géré, P., Dillmann, C., 1992. A computer program for testing pairwise linkage disequilibria in subdivided populaChowtions. J. Hered. 83, 239.
Garza, J.C., Freimer, N.B., 1996. Homoplasy for size at microsatellite loci in humans and chimpanzees. Genome Res. 6, 211-217. González-Wangüemert, M., Cánovas, F., Pérez-Ruzafa, A., Marcos, C., Alexandrino, P., 2010. Connectivity patterns inferred from
the genetic structure of white seabream (Diplodus sargus L.). J. Exp. Mar. Biol. Ecol. 383, 23–31.
Gray, J.E., 1851. List of the specimens of fish in the collection of the British Museum. Part I. -Chondropterygii. E. Newman, London, x + 160 pp., 2 pls.
Hamlett, W.C., Hysell, M.K., 1998. Uterine specializations in elasmobranchs. J. Exp. Zool. 282, 438-459.
Hassan, M., Lemaire, C., Fauvelot, C., Bonhomme, F., 2002. Seventeen new exon-primed intron-crossing polymerase chain reaction amplifiable introns in fish. Mol. Ecol. Notes 2, 334-340.
Haustein, S., Tunger, D., Heinrichs G., Baelz, G., 2011. Reasons for and developments in international scientific collaboration: does an Asia–Pacific research area exist from a bibliometric point of view? Scientometrics 86, 727–746.
Heist, E.J., Jenkot, J.L., Keeney, D.B., Lane, R.L., Moyer, G.R., Reading, B.J., Smith, N.L., 2003. Isolation and characterization of polymorphic microsatellite loci in nurse shark (Ginglymostoma cirratum). Mol. Ecol. Notes 3, 59–61.
Hemmer-Hansen, J., Nielsen, E.E.G., Grønkjær, P., Loeschcke, V., 2007. Evolutionary mechanisms shaping the genetic population structure of marine fishes; lessons from the European flounder (Platichthys flesus L.). Mol. Ecol. 16, 3104–3118
Hoarau, G., Rijnsdorp, A.D., van der Veer, H.W., Stam, W.T., Olsen, J.L., 2002. Population structure of plaice (Pleuronectes platessa L.) in northern Europe: microsatellites revealed large-scale spatial and temporal homogeneity. Mol. Ecol. 11, 1165–1176. Hoareau, T.B., Bosc, P., Valade P., Berrebi, P., 2007. Gene flow and genetic structure of Sicyopterus lagocephalus in the south-western
11
Horne, J.B., Momigliano, P., Welch, D.J., Newman, S.J., van Herwerden, L. 2011. Limited ecological population connectivity suggests low demands on self-recruitment in a tropical inshore marine fish (Eleutheronema tetradactylum: Polynemidae). Mol. Ecol. 20, 2291–2306.
Jones D.B., Jerry D.R., McCormick, M.I., Bay, L.K., 2010. The population genetic structure of a common tropical damselfish on the Great Barrier Reef and eastern Papua New Guinea. Coral Reefs 29:455–467.
Keeney, D.B., Heupel, M., Hueter ,R.E., Heist, E.J., 2003. Genetic heterogeneity among blacktip shark, Carcharhinus limbatus, continental nurseries along the US Atlantic and Gulf of Mexico. Mar. Biol. 143, 1039–1046.
Keeney, D.B., Heupel, M.R., Hueter, R.E., Heist, E.J. 2005. Microsatellite and mitochondrial DNA analyses of the genetic structure of blacktip shark (Carcharhinus limbatus) nurseries in the northwestern Atlantic, Gulf of Mexico, and Caribbean Sea. Mol. Ecol. 14, 1911–1923.
Kotoulas, G., Bonhomme, F., Borsa, P., 1995. Genetic structure of the common sole, Solea vulgaris, at different geographic scales. Mar. Biol. 122, 361-375.
Le Port, A., Lavery, S., 2012. Population structure and phylogeography of the short-tailed stingray, Dasyatis brevicaudata (Hutton 1875), in the Southern Hemisphere. J. Hered. 103, 174-185.
Magsino, R.M., Juinio-Meñez, M.A., 2008. The influence of contrasting life history traits and oceanic processes on genetic structuring of rabbitfish populations Siganus argenteus and Siganus fuscescens along the eastern Philippine coasts. Mar. Biol. 154, 519-532.
Matschiner, M., Hanel, R., Salzburger, W., 2009. Gene flow by larval dispersal in the Antarctic notothenioid fish Gobionotothen
gibberifrons. Mol. Ecol. 18, 2574–2587.
Meijaard, E., 2011. Indonesia has its share of scientists, so where’s the science? Jakarta Globe, Jakarta
(http://www.thejakartaglobe.com/opinion/indonesia-has-its-share-of-scientists-so-wheres-the-science/430931; 23 March 2011).
McCusker, M., Bentzen, P., 2010. Historical influences dominate the population genetic structure of a sedentary marine fish, Atlantic wolfish (Anarhichas lupus), across the North Atlantic Ocean. Mol. Ecol. 19, 4228–4241.
Mobley, K.B., Small, C.M., Jue, N.K., Jones, A.G., 2010. Population structure of the dusky pipefish (Syngnathus floridae) from the Atlantic and Gulf of Mexico, as revealed by mitochondrial DNA and microsatellite analyses. J. Biogeogr. 37, 1363–1377. Müller, J., Henle, J., 1841. Systematische Beschreibung der Plagiostomen. Veit und Comp., Berlin, xxii+200 pp., 60 pls.
Muths, D., Tessier, E., Gouws, G., Craig, M., Mwale, M., Mwaluma, J., Mwandya, A., Bourjea, J., 2011. Restricted dispersal of the reef fish Myripristis berndti at the scale of the SW Indian Ocean. Mar. Ecol. Prog. Ser. 443, 167–180.
Nei, M., Chesser, R.K., 1983. Estimation of fixation indices and gene diversities. Ann. Hum. Genet. 47, 253–259.
Ovenden, J.R., Kashiwagi, T., Broderick, D., Giles, J., Salini, J., 2009. The extent of population genetic subdivision differs among four co-distributed shark species in the Indo-Australian archipelago. BMC Evol. Biol. 9, 40.
Ovenden, J.R., Morgan, J.A.T., Street, R., Tobin, A., Simpfendorfer, C., Macbeth, W., Welch, D., 2011. Negligible evidence for regional genetic population structure for two shark species Rhizoprionodon acutus (Rüppell, 1837) and Sphyrna lewini (Griffith & Smith, 1834) with contrasting biology. Mar. Biol. 158, 1497-1509.
Palumbi, S., Martin, A., Romano, S., McMillan, W.O., Stice, L., Grabowski, G., 1991. The simple fool’s guide to PCR, v. 2.0. University of Hawai’i, Honolulu, 47 pp.
Pauly, D., 1994. On the sex of fish and the gender of scientists: a collection of essays in fisheries science. Chapman and Hall, London, 250 pp.
Pierce, S.J., Scott-Holland, T.B., Bennett, M.B., 2011. Community composition of elasmobranch fishes utilizing intertidal sand flats in Moreton Bay, Queensland, Australia. Pac. Sci. 65, 235-247.
Planes, S., Fauvelot, C., 2002. Isolation by distance and vicariance drive genetic structure of a coral reef fish in the Pacific Ocean. Evolution 56, 378–399.
Plank, S.M., Lowe, C.G., Feldheim, K.A., Wilson, R.R., Brusslan, J.A., 2010. Population genetic structure of the round stingray
12
Portnoy, D.S., Heist, E.J., 2012. Molecular markers: progress and prospects for understanding reproductive ecology in elasmobranchs. J. Fish Biol. (doi:10.1111/j.1095-8649.2011.03206.x)
Puebla, O., Bermingham, E., Guichard, F., 2009. Estimating dispersal from genetic isolation by distance in a coral reef fish (Hypoplectrus puella). Ecology 90, 3087-3098.
Purcell, J.F.H., Cowen, R.K., Hughes, C.R., Williams, D.A., 2009. Population structure in a common Caribbean coral-reef fish: implications for larval dispersal and early life-history traits. J. Fish Biol. 74, 403–417.
Rice, W.R., 1989. Analyzing tables of statistical tests. Evolution 43, 223–225.
Rocha, L.A., Craig, M.T., Bowen, B.W., 2007. Phylogeography and the conservation of coral reef fishes. Coral Reefs 26, 501–512. Rohfritsch, A., Borsa, P., 2005. Genetic structure of Indian scad mackerel Decapterus russelli: Pleistocene vicariance and secondary
contact in the central Indo-West Pacific seas. Heredity 95, 315-322.
Roldán, M.I., García-Marín, J.L., Utter, F.M., Pla, C., 1998. Population genetic structure of European hake, Merluccius merluccius. Heredity 81, 327-334.
Rolland, J.L., Bonhomme, F., Lagardère, F., Hassan, M., Guinand, B., 2007. Population structure of the common sole (Solea solea) in the Northeastern Atlantic and the Mediterranean Sea: revisiting the divide with EPIC markers. Mar. Biol. 151, 327–341. Rousset, F., 1997. Genetic differentiation and estimation of gene flow from F-statistics under isolation by distance. Genetics 145,
1219-1228.
Ryan, W.B.F., Carbotte, S.M., Coplan, J.O., O’Hara, S., Melkonian, A., Arko, R., Weissel, R.A., Ferrini, V., Goodwillie, A., Nitsche, F., Bonczkowski, J., Zemsky, R., 2009. Global multi-resolution topography synthesis. Geochem. Geophys. Geosyst. 10, Q03014.
Sadovy, Y., 2005. Trouble on the reef: the imperative for managing vulnerable and valuable fisheries. Fish Fisheries 6, 167-185. Schluessel, V., Broderick, D., Collin, S.P., Ovenden, J.R., 2010. Evidence for extensive population structure in the white-spotted
eagle ray within the Indo-Pacific inferred from mitochondrial gene sequences. J. Zool. 281, 46–55.
Shaklee, J., Bentzen, P., 1998. Genetic identification of stocks of marine fish and shellfish. Bull. Mar. Sci. 62, 589–621. Sokal, R.R., Rohlf, F.J., 1995. Biometry. The principles and practice of statistics in biological research, 3rd edn. Freeman and Co,
New York, 776 p.
Timm, J., Planes, S., Kochzius, M., 2012. High similarity of genetic population structure in the false clown anemonefish (Amphiprion
ocellaris) found in microsatellite and mitochondrial control region analysis. Conserv. Genet. 13, 693-706.
Walsh, P.S., Metzger, D.A., Higuchi, R., 1991. Chelex 100 as a medium for simple extraction of DNA for PCR-based typing from forensic material. Biotechniques 10, 506–513.
Ward, R.D., 2000. Genetics in fisheries management. Hydrobiologia 420, 191–201.
Ward, R.D., Holmes, B.H., White, W.T., Last, P.R., 2008. DNA barcoding Australian chondrichthyans: results and potential uses in conservation. Mar. Freshw. Res. 59, 57–71.
Weir, B.S., Cockerham, C.C., 1984. Estimating F-statistics for the analysis of population structure. Evolution 38, 822–831.
White, W.T., Dharmadi, 2007. Species and size compositions and reproductive biology of rays (Chondrichthyes, Batoidea) caught in target and non-target fisheries in eastern Indonesia. J. Fish Biol. 70, 1809–1837.
White, W.T., Kyne, P.M. 2010. The status of chondrichthyan conservation in the Indo-Australasian region. J. Fish Biol. 76, 2090– 2117.
13
Table 1
PCR primers used to amplify size-polymorphic introns in three Indo-West Pacific stingray species. Intron no.: assumed intron number in teleost fishes.
Gene or gene
family Intron no. Locus (loci), primer name Primer sequence Reference
Actin 2 Act-2 Atarhouch et al. (2003)
Act-2-F 5’-GCTATAACCCTCGTAGATGGGCAC-3’
Act-2-R 5’-ATCTGGCACCACACCTTCTACAA-3’
Aldolase B 5 AldoB5 Hassan et al. (2002)
Aldo3F 5’- TCCTGCCTGATGGAACCC-3’
Aldo2R 5’- CAGGTACACATGGTGGTC-3’
Calmodulin 3 Cam-3 Atarhouch et al. (2003)
Cam-3-F 5’-TGACGGAGCTCTGCAGCACTGAC-3’
Cam-3-R 5’-GTGAGGAGGAGCTCCGTGAGGC-3’
Creatine kinase 6 CK Palumbi et al. (1991)
CK6-5’ 5’-GACCACCTCCGAGTCATCTCSATG-3’ a
CK7-3’ 5’- CAGGTGCTCGTTCCACATGAA-3’
Glyceraldehyde-3-phosphate 2 Gpd2 Hassan et al. (2002)
dehydrogenase Gpd2F 5’-GCCATCAATGACCCCTTCATCG-3’
Gpd3R 5’-TTGACCTCACCCTTGAAGCGGCCG-3’
Ribosomal protein 1 RP Chow and Takeyama (1998)
RPEX1F 5’-TGGCCTCTTCCTTGGCCGTC-3’
RPEX2R 5’-AACTCGTCTGGCTTTTCGCC-3’ a S = C or G, with approximately equal probabilities
14
Table 2
Himantura gerrardi. Allelic frequencies at 7 presumptive intron loci sampled from the Indo-Malay-Papua
archipelago. Alleles were designated from the approximate size of the PCR-amplified fragment (in base pairs). Five different, presumptive intron loci, here designed as Cam-3 a-e, were scored using the Cam-3 primer pair (Table 1). Estimates of genetic differentiation over all samples and loci: ^θ = 0.123 (permutation test, 1000 random permutations: P<0.01) and ^Gst = 0.159. Hyphen: no data.
Locus, Sample
allele Sunda Strait Java Sea Indian Ocean West Papua Unknown
Act-2 238 0.57 0.58 0.70 - 0.56 225 0.43 0.43 0.20 - 0.44 210 0 0 0.10 - 0 (N) (7) (21) (5) - (8) ^f -0.091 -0.063 0.238 - -0.750 Cam-3 a 206 0 0 0.17 - 0.39 203 0.07 0.37 0 - 0 200 0.93 0.63 0.83 - 0.61 (N) (7) (19) (3) - (9) ^f 0 -0.333 0 - -0.600 Cam-3 b 178 0 0 0 0 0.17 175 0.71 0.58 0.90 0 0.61 173 0.29 0.39 0.10 0 0.06 171 0 0.03 0 1 0.17 (N) (7) (18) (5) (1) (9) ^f -0.333 -0.624* 0 - -0.116 Cam-3 c 161 0 0.13 0 0 0.06 158 0.43 0.32 0 0 0.44 155 0.57 0.55 0.90 1 0.44 152 0 0 0.10 0 0.06 (N) (7) (19) (5) (2) (8) ^f -0.714 -0.251 0 - -0.380 Cam-3 d 140 0.71 0.80 0.17 - 0.17 138 0.29 0.20 0.83 - 0.67 136 0 0 0 - 0.17 (N) (7) (10) (3) - (9) ^f 0.368 -0.200 0 - -0.053 Cam-3 e 127 0 0 0 0 0.17 126 0 0.03 0 0 0 125 1 0.97 1 1 0.83 (N) (7) (19) (5) (2) (7) ^f - 0 - - 0.636 CK 175 0.64 0.63 0.67 1 0.56 173 0.36 0.37 0.33 0 0.44 (N) (7) (19) (3) (2) (9) ^f -0.500 0.565* 1 - -0.297 * P < 0.05
15
Table 3
Neotrygon kuhlii. Allelic frequencies at 4 presumptive intron loci in 6 samples from the Indo-Malay-Papua archipelago.
Alleles were designated from the approximate size of the PCR amplified fragment (in base pairs). Two different, presumptive intron loci, here designed as Cam-3 slow and fast according to the motility of the expressed DNA bands, were scored using the Cam-3 primer pair (Table 1). Estimates of genetic differentiation over all samples and loci: ^θ = 0.336 (permutation test, 1000 random permutations: P<0.001) and ^Gst = 0. 316.
Locus, Sample
allele Indian Ocean a Indian Ocean b Bali Strait Flores Sea Tomini Bay Banda Sea
Cam-3 slow 430 0 0 0 0 0 0.05 400 0.96 0.94 0.93 0.82 1 0.91 385 0 0 0 0.11 0 0 370 0.04 0.06 0.08 0.08 0 0.04 (N) (38) (9) (20) (19) (3) (38) ^f -0.028 0 -0.056 -0.135 - 0.245 Cam-3 fast 300 0.18 0.33 0.68 0.94 0 0.88 282 0.74 0.39 0.33 0.06 1 0.12 264 0.08 0.28 0 0 0 0 (N) (38) (9) (20) (18) (3) (39) ^f -0.240* 0.297 0 -0.030 - -0.118 CK 368 0.46 0 0 0.03 0 0 366 0.01 0 0.43 0 0 0.04 363 0.28 0.67 0.25 0.22 0 0.16 361 0.24 0.33 0.33 0.72 1 0.74 359 0 0 0 0.03 0 0.06 (N) (37) (9) (20) (16) (4) (34) ^f 0.144 0.543 -0.126 -0.268 - 0.121 Gpd2 173 0 0 0 0.15 0 0 169 0 0 0 0.03 0 0 167 0.82 0.83 0.89 0.82 1 0.23 164 0.18 0.17 0.11 0 0 0.77 (N) (38) (9) (19) (17) (4) (33) ^f -0.037 -0.143 -0.091 -0.150 - -0.106
a Binuangen sample (Fig. 1A); b Malang sample (Fig. 1A) * P < 0.05
16
Table 4
Taeniura lymna. Allelic frequencies at 5 presumptive intron loci in 3 samples from
the Indo-Malay archipelago. Alleles were designated from the approximate size of the PCR amplified fragment (in base pairs). Three different, presumptive intron loci differing by the mobility of the expressed DNA bands, were scored using the
AldoB-5 primer pair (Table 1). Estimates of genetic differentiation over all samples
and loci: ^θ = 0.095 (permutation test, 1000 random permutations: P<0.01) and
^Gst = 0.074.
Locus, Sample
allele Java Sea Flores Sea Molucca Sea
AldoB5 slow 284 0.21 0.46 0.39 280 0.79 0.54 0.61 (N) (7) (12) (14) ^f 0.625 0.203 0.285 AldoB5 fast 123 0.57 0.08 0.17 119 0.43 0.92 0.83 (N) (7) (12) (12) ^f -0.091 -0.048 -0.158 AldoB5 faster 087 0.29 0.13 0.14 085 0.71 0.88 0.86 (N) (7) (12) (14) ^f -0.333 0.645 -0.130 CK 138 0.29 0 0 133 0.71 1 1 (N) (7) (12) (12) ^f 0.368 - - RP 313 0 0.08 0 296 0.21 0.17 0 290 0.79 0.75 1 (N) (7) (12) (12) ^f 0.625 0.214 -
17
Table 5
Population-pairwise multilocus ^θ (Weir and Cockerham, 1984) (above diagonal) in three stingray species from the Indo-Malay-Papua archipelago, and ship distance between locations (in km, below diagonal, italics). *, P<0.05; **, P<0.01; ***,
P<0.001 (permutation test; GENETIX 4.02; 1000 permutations); na, not applicable. A. Neotrygon kuhlii. B. Himantura gerrardi
and Taeniura lymna. A
a Binuangen, Apr. 2010; b Malang, Oct. 2010 B
a two samples were pooled (Fig. 1)
Species, Sample
Sample Indian Ocean a Indian Ocean b Bali Strait Flores Sea Tomini Bay Banda Sea
Neotrygon kuhlii Indian Ocean a 0 0.105 ** 0.210 *** 0.360 *** 0.249 ** 0.440 *** Indian Ocean b 823 0 0.176 *** 0.326 *** 0.296 0.430 *** Bali Strait 1 094 254 0 0.153 *** 0.366 * 0.332 *** Flores Sea 1 604 789 638 0 0.486 * 0.290 *** Tomini Bay 3 019 2 101 1 920 1 375 0 0.557 ** Banda Sea 2 330 1 433 1 224 695 729 0 Species, Sample
Sample Sunda Strait Java Sea Indian O. a Flores Sea Molucca Sea West Papua Unknown
Himantura gerrardi Sunda Strait 0 0.009 0.118 - - 0.455 0.095 * Java Sea 520 0 0.176 ** - - 0.365 * 0.136 *** Indian Ocean a 595 1 075 0 - - 0.493 0.057 West Papua 4 126 3 592 3 729 - - 0 0.286 Unknown na na na - - na 0 Taeniura lymna Java Sea 0 - - 0.153 * 0.148 * - - Flores Sea 1 507 - - 0 0.003 - - Molucca Sea 2 405 - - 1 277 0 - -
18
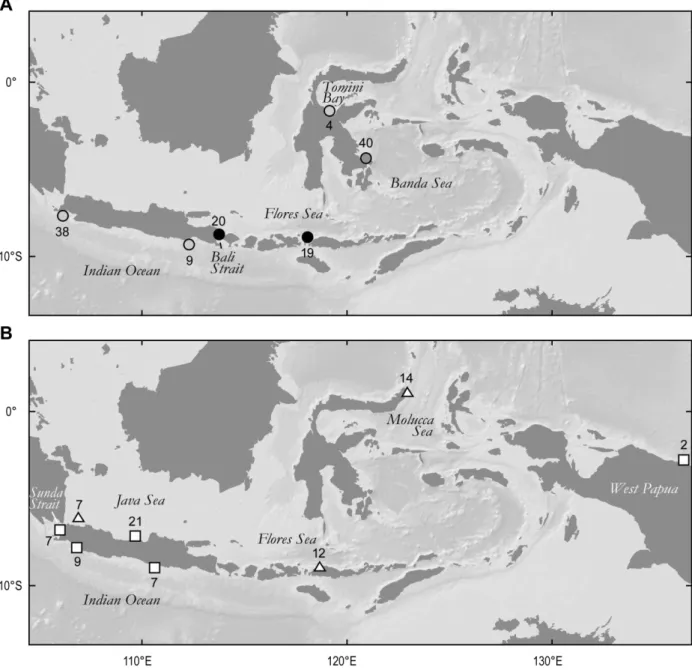
Fig. 1. Map of the Indo-Malay-Papua archipelago with sampling sites for three stingray species. Sample sizes indicated near symbols. Background topographic map from GeoMapApp (Ryan et al., 2009) (http://www.geomapapp.org). A. Neotrygon kuhlii (circles): grey tones (light grey, dark grey, black) illustrate the populations to which individuals were predominantly assigned according to Bayesian structure analysis (STRUCTURE: Falush et al., 2007; K=3). Indian Ocean, from West to East: Binuangen (Apr. 2010), Malang (Oct. 2010); Bali Strait: Banyuwangi (Oct. 2010); Flores Sea: Labuan Bajo (Oct. 2010); Tomini Bay: Poso (Jan. 2011); Banda Sea: Kendari (Oct. 2010). B. Himantura gerrardi (squares) and Taeniura lymna (triangles). Sunda Strait: Labuan (Oct. 2010); Indian Ocean, from West to East: Pelabuhan Ratu (Apr. 2010), Sadeng (Oct. 2010); Java Sea, from West to East: Pulau Pari (Nov. 2008) and Batang (Nov. 2007-Jan. 2008); Flores Sea: Labuan Bajo (Oct. 2010); Molucca Sea: Lembeh Strait (Nov. 2010); West Papua: Port Numbay (Nov. 2010). Not represented: an H. gerrardi sample of unknown origin landed in Batang (Jan. 2008).
19
Fig. 2. Mendelian-like allele-size polymorphism detected from an electrophoresis gel of CY5-labelled, PCR-amplified introns at the CK locus in ribbontail stingray (Taeniura lymna). The gel was scanned under laser light (FMBIO
®
II Fluorescence Imaging System, Hitachi Instruments, San José CA, U.S.A.) to detect fluorescent DNA bands. Two size-alleles were scored, with size indicated on the left margin of the image. Lanes 1, 4: heterozygotes 138/133; lanes 2, 3, 5, 6: homozygotes 133; lane 7: homozygote 138; lane 8: PCR control with no DNA template.20
Fig. 3. Population genetic structure in Neotrygon kuhlii in the Indo-Malay-Papua archipelago. Pairwise multiple-locus estimates of genetic differentiation (ordinates) plotted against the logarithm of ship distance (SD; abscissa). The regression equation was ^θ/(1-^θ) = 0.118 ln(SD) – 0.309 [R² = 0.058; Mantel’s test (Belkhir et al., 2000): P=0.13]. Pairwise multiple-locus θ were estimated from genotypic data (Supplementary material, Table S3) according to Weir and Cockerham (1984).
21
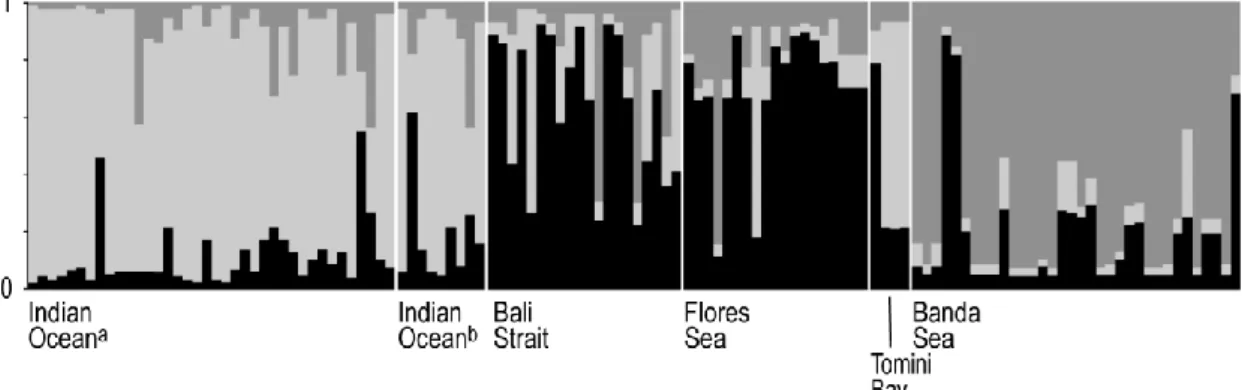
Fig. 4. Neotrygon kuhlii. Output of Bayesian structure analysis (STRUCTURE: Falush et al., 2007) with K=3 populations, on individual genotypes at 4 presumptive intron loci for 6 samples from the Indo-Malay-Papua archipelago (Supplementary material, Table S3). Individuals are represented by vertical bars; the different grey tones correspond to different genetic clusters and their proportion in an individual (ordinate) indicates its degree of assignment to the corresponding cluster. a Binuangen sample (Fig. 1); b Malang sample (Fig. 1).
22
Fig. 5. Plot of genetic-differentiation estimates (overall ^Fst value) against geographic distance in coastal elasmobranchs and teleosts. Data from nuclear-marker based phylogeographic surveys of 8 coastal
elasmobranch species (open circles) (Chevolot et al., 2006; Dudgeon et al., 2009; Plank et al., 2010; Ovenden et al., 2011; present study) and 27 coastal teleost fish species (black diamonds) (Blanquer et al., 1992; Kotoulas et al., 1995; Borsa et al., 1997a; Roldán et al., 1998; Hoarau et al., 2002; Planes and Fauvelot, 2002; Borsa, 2003; Rohfritsch and Borsa, 2005; Hemmer-Hansen et al., 2007; Rolland et al., 2007; Magsino and Juinio-Meñez, 2008; Matschiner et al., 2009; Puebla et al., 2009; Purcell et al., 2009; González-Wangüemert et al., 2010; Jones et al., 2010; McCusker and Bentzen, 2010; Mobley et al., 2010; Fauvelot and Borsa, 2011; Francisco et al., 2011; Gaither et al., 2011; Horne et al., 2011; Muths et al., 2011; Timm et al., 2012). Other details in Supplementary material, Table S7.
23
Supplementary material to “Population genetic structure of the blue-spotted maskray Neotrygon kuhlii and two other Indo-West Pacific
stingray species (Myliobatiformes: Dasyatidae), inferred from size-polymorphic intron markers” by Philippe Borsa , Irma S. Arlyza,
Martin Laporte, and Patrick Berrebi
Table S1
Introns tested for size polymorphism in Himantura gerrardi, Neotrygon kuhlii, and Taeniura lymna. Intron no.: assumed intron number in teleost fishes. Mendelian-like allele-size polymorphisms were detected using primer pairs (Act-2-F, Act-2-R), (Cam-3-F, Cam-3-R) and (CK6-5’, CK7-3’) in H.
gerrardi, (Cam-3-F, Cam-3-R), (CK6-5’, CK7-3’) and (Gpd2F, Gpd3R ) in N. kuhlii, and (Aldo3F, Aldo2R ), (CK6-5’, CK7-3’) and (RPEX1F, RPEX2R ) in Taeniura lymna. For the other primer pairs tested, either the DNA band patterns were not variable (thus exhibiting sample
monomorphism), or they were variable but we failed to interpret them in terms of size polymorphism at Mendelian loci. In a few cases, the amplification was too weak for scoring, or the intensity of DNA bands was highly variable across individuals, or a substantial proportion of individuals could not be scored either because of bands that were too weak or because of overlapping bands presumably from other loci. Since a number of factors, e.g. unsuitable annealing temperature, quality of the primers, quality of the DNA extracts, etc. may lead to unsatisfactory results of this kind, we consider that more tests are needed before definitely discarding the primer pairs that failed to produce Mendelian-like polymorphisms in our study.
Gene or gene
family Intron no. Abbrev- iation Primer pair Reference
Actin 2 Act-2 Act-2-F, Act-2-R Atarhouch et al. (2003)
Aldolase B 2 AldoB2 Aldob2F, Aldexon3R Hassan et al. (2002)
Aldolase B 4 AldoB4 Aldo5F, Aldo3.1R Hassan et al. (2002)
Aldolase B 5 AldoB5 Aldo3F, Aldo2R Hassan et al. (2002)
Aldolase C 1 AldoC1 Aldoc1F, Aldoc2R Hassan et al. (2002)
α-Amylase 1 Am2B-1 Am2b1F, Am2b2R Hassan et al. (2002)
α-Amylase 3 Am2B-3 Am2b3F, Am2b4R Hassan et al. (2002)
Calmodulin 3 Cam-3 Cam-3-F, Cam-3-R Atarhouch et al. (2003)
Calmodulin 4 CaM CALMex4F, CALMex5R Chow (1998); Chow and Takeyama (2000)
Creatine kinase 6 CK CK6-5’, CK7-3’ Palumbi et al. (1991)
Creatine kinase 7 Ck7 Ck7F, Ck8R Hassan et al. (2002)
Glyceraldehyde-3-phosphate
dehydrogenase 2 Gpd2 Gpd2F, Gpd3R Hassan et al. (2002)
Gonadotropin-releasing
hormone 3 3 GnRH3-3 GnRH3F, GnRH3R Hassan et al. (2002)
Growth hormone 2 Gh2 Gh2F, Gh3R Hassan et al. (2002)
Growth hormone 5 Gh5 Gh5F, Gh6R Hassan et al. (2002)
Major histocomptability complex class II antigen
1 MhcII Mhc1F, Mhc2R Hassan et al. (2002)
Myosin, light chain 3 Mlc-3 Mlc-3-F, Mlc-3-R Atarhouch et al. (2003)
Opsin 1 Ops-1 Ops-1-F, Ops-1-R Atarhouch et al. (2003)
Ribosomal protein 1 RP RPEX1F, RPEX2R Chow and Takeyama (1998)
α-Tropomyosin 1 Tr1 Tr1F, Tr1R Hassan et al. (2002)
References
Atarhouch, T., Rami, M., Cattaneo-Berrebi, G., Ibanez, C., Augros, S., Boissin, E., Dakkak, A., Berrebi, P., 2003. Biotechniques 35, 676-682. Chow, S., 1998. Fisheries Sci. 64, 999-1000.
Chow, S., Hazama, K., 1998. Mol. Ecol. 7, 1255-1256. Chow, S., Takeyama, H., 1998. Fisheries Sci. 64, 397-402. Chow, S., Takeyama, H., 2000. J. Fish Biol. 56, 1087–1098.
Hassan, M., Lemaire, C., Fauvelot, C., Bonhomme, F., 2002. Mol. Ecol. Notes 2, 334-340.
Palumbi, S., Martin, A., Romano, S., McMillan, W.O., Stice, L., Grabowski, G., 1991. The simple fool’s guide to PCR, v. 2.0. University of Hawai’i, Honolulu, 47 pp.
24
Table S2
Individual genotypes in 5 Himantura gerrardi samples from the Indo-Malay-Papua archipelago, at 7 presumptive intron loci. Alleles at a locus are designated by their approximate size (in bp).
Sample, Locus
individual no. Act-2 Cam-3 a Cam-3 b Cam-3 c Cam-3 d Cam-3 e CK
Indian Ocean DY 1 225/210 - 175 155 - 125 173 SY 1 238 200 175 155/152 138 125 175 SY 2 238/225 - 175 155 - 125 - PLRQ 1 238 200 175 155 140/138 125 175 PLRC 2 238 206/200 175/173 155 138 125 - Java Sea BT07 1 238/225 203 175/173 158/155 140 125 175 BT07 2 238/225 200 175 155 140/138 125 175/173 BT07 3 238/225 203/200 175/173 158/155 140/138 125 175/173 BT07 4 238/225 203/200 175/173 161/158 - 125 175/173 BT07 5 225 203/200 175/173 158/155 140/138 125 175/173 BT07 6 238/225 203/200 175/173 161 140 125 175 BT08 1 225 203/200 175 155 - 125 175 BT08 2 225 200 175/173 161/155 - 125 175/173 BT08 3 238 200 175/173 158/155 - 125 175/173 BT08 4 238 203/200 175/173 155 140 125 175 BT08 5 238 200 175/173 155 140 125 - BT08 6 238/225 203/200 175/171 158/155 140 125 175/173 BT08 7 238/225 203/200 175 161/155 - 126/125 0 BT08 8 238 203/200 175/173 158/155 - 125 175/173 BT08 9 238/225 203/200 175/173 158/155 - 125 175/173 BT08 10 238 203/200 175/173 158/155 - 125 175/173 BT08 11 238 203/200 - 158/155 - 125 175/173 BT08 12 238/225 - - - 175/173 BT08 13 238 - - - 175/173 BT08 14 238/225 200 175/173 158/155 140/138 125 175/173 BT08 15 238/225 200 175/173 158/155 140 125 175 Unknown BLTR 18 238/225 206/200 178/175 158/155 140/138 125 175/173 BLTR 19 238/225 206/200 175 158/155 138 125 175/173 BLTR 20 238/225 206/200 175 158/155 138 125 175/173 BLTR 21 - 200 175/171 - 140/136 127 173 BLTR 22 238/225 206/200 175/171 158/155 138/136 125 175 BLTR 23 238/225 206/200 175 158 138 125 175/173 BLTR 24 238/225 200 173/171 155/152 138/136 127/125 175/173 BLTR 25 238/225 206/200 178/175 158/155 140/138 125 175/173 BLTR 26 238 206/200 178/175 161/155 138 125 175 Sunda Strait LBN 1 238/225 200 175/173 158/155 140 125 175/173 LBN 2 238/225 203/200 175/173 155 140 125 175/173 LBN 3 238/225 200 175/173 158/155 138 125 175/173 LBN 4 238 200 175 158/155 140/138 125 175 LBN 5 238/225 200 175/173 158/155 140/138 125 175/173 LBN 6 238 200 175 158/155 140 125 175/173 LBN 7 225 200 175 158/155 140 125 175 West Papua HNSM1 - - 171 155 - 125 175 HNSM2 - - - 155 - 125 175