HAL Id: hal-01938174
https://hal.archives-ouvertes.fr/hal-01938174
Submitted on 29 Nov 2018HAL is a multi-disciplinary open access
archive for the deposit and dissemination of sci-entific research documents, whether they are pub-lished or not. The documents may come from teaching and research institutions in France or abroad, or from public or private research centers.
L’archive ouverte pluridisciplinaire HAL, est destinée au dépôt et à la diffusion de documents scientifiques de niveau recherche, publiés ou non, émanant des établissements d’enseignement et de recherche français ou étrangers, des laboratoires publics ou privés.
Resistance Gene Replacement in the Mosquito Culex
pipiens: Fitness Estimation From Long-Term Cline
Series
Pierrick Labbé, Nicolas Sidos, Michel Raymond, Thomas Lenormand
To cite this version:
Pierrick Labbé, Nicolas Sidos, Michel Raymond, Thomas Lenormand. Resistance Gene Replacement in the Mosquito Culex pipiens: Fitness Estimation From Long-Term Cline Series. Genetics, Genetics Society of America, 2009, 182 (1), pp.303 - 312. �10.1534/genetics.109.101444�. �hal-01938174�
RESISTANCE GENE REPLACEMENT IN THE
MOSQUITO CULEX PIPIENS: FITNESS
ESTIMATION FROM LONG TERM CLINE
SERIES
Pierrick Labbé
*,†,1, Nicolas Sidos
‡, Michel Raymond
*and Thomas Lenormand
†*Laboratoire Génétique et Environnement, Institut des Sciences de l'Evolution (UMR CNRS 5554), Université de Montpellier II (C.C. 065), F-34095 Montpellier cedex 05, France
†
CEFE-UMR 5175 CNRS, F-34293 Montpellier cedex 05, France
‡
EID Méditerranée, 34184 Montpellier cedex4, France
1 Corresponding author: IEB, Ashworth Laboratory, Kings Buildings, Edinburgh EH9 3JU, UK. Mail:
RHH.— AMELIORATION AND GENE REPLACEMENT
Key words.— cost, overproduced esterases, selection, trade-off, adaptation.
Corresponding author: Pierrick Labbé
IEB
Ashworth Laboratory, Kings Buildings Edinburgh EH9 3JU
UK
Tel: +44 (0) 131 650 7287 Mail: Pierrick.Labbe@ed.ac.uk
ABSTRACT
How adaptation appears and is later refined by natural selection has been the object of intense theoretical work. However the testing of these theories is limited by our ability to estimate the strength of natural selection in nature. Using a long-term cline series, we estimate the selection coefficients acting on different alleles at the same locus in order to analyse the allele replacement observed in the insecticide resistance gene Ester in the mosquito Culex
pipiens in the Montpellier area, southern France. Our method allows us to accurately account
for the resistance allele replacement observed in this area since 1986. A first resistance allele appeared early, which was replaced by a second resistance allele providing the same advantage but at a lower cost, itself being replaced by a third resistance allele with both higher advantage and cost. It shows that amelioration of the adaptation (here resistance to insecticide) through allele replacement was successively achieved by selection of first a generalist allele (i.e. with a low fitness variance across environments) and later of a specialist allele (i.e. with a large fitness variance across environments). More generally, we discuss how precise estimates of the strength of selection obtained from field data help understand the process of amelioration of adaptation.
“Without extensive knowledge of natural selection in the wild, we have no idea how relevant experiment or theory are to the evolution of natural populations” (ENDLER 1986).
Twenty years after ENDLER’s famous monograph, many advances have been made in the
theory of adaptation. Some predictions made by this theory have been tested in the lab, but little insight has been gained into the process in nature. The main advance has been the shift from a strict micromutationnal view to one when mutations of larger effect also played a role. Several experimental studies support this view (see review in ORR 2005). When adaptation to
a new habitat is like a sequential approach towards a phenotypic optimum, mutations of large effect will tend to occur early and be followed by mutations of smaller effects ‘refining’ the adaptation (HARTL and TAUBES 1996; BARTON 1998; ORR 1998; ORR 2000; BARTON and
KEIGHTLEY 2002).
Adaptation to a new environment involves two types of traits; i) traits that change to match the new environmental challenge, and ii) traits that are not involved in this environmental change and have to remain unchanged. “Amelioration” of adaptation (sensu COHAN et al. 1994) occurs therefore in two directions: improving traits from set 1, and
correcting the correlated (or ‘pleiotropic’) changes that may have occurred on traits from set 2 because of changes that occurred on traits in set 1. We will designate below these two modes of amelioration as being ‘direct’ or ‘compensatory’, respectively. Most new adaptive mutations affect these two sets of traits together, by producing traits that better match the environment but also modifying some traits that should not change, generating conflicting selection pressures and impeding the rate of adaptation (CASPARI 1952; WRIGHT 1969;
CARRIÈRE et al. 1994). It is, however, difficult to disentangle these different selection
pressures in nature. Moreover, this process of amelioration can take several routes at the genetic level: it can either involve several loci (e.g. a modifier gene with a compensatory effect) or only a single locus repeatedly (allele replacement) (COHAN et al. 1994).
Additionally, although less commonly appreciated, more complex molecular processes such as gene duplication may also be involved on a short time-scale (LABBÉ et al. 2007). While
several examples of these processes have been described in laboratory studies (e.g. LENSKI
1988a; LENSKI 1988b; COHAN et al. 1994), it is difficult to study them in nature without
precise methods to estimate selection coefficients and without the knowledge of the genetic bases of the adaptation.
In this paper, we developed an approach allowing us to precisely measure selection coefficients in order to study this process of amelioration in nature. We used a well-known case study, the evolution of organophosphate insecticide (OP) resistance in the mosquito
Culex pipiens (vector of West Niles encephalitis, filariasis, etc.). In particular, we focused on
the allele replacement that occurred at the Ester locus in the Montpellier area (Southern France) during the 1990’s and 2000’s (GUILLEMAUD et al. 1998; LABBÉ et al. 2005). The
Ester superlocus codes for detoxifying carboxylester hydrolases (or esterases). The
overproduction of these esterases is one of the major resistance mechanisms to OP in C.
pipiens (see for review RAYMOND et al. 2001). Several resistance alleles, each corresponding
to a distinct overproduced esterase, have been described. They are selected for in insecticide treated areas (i.e. a selective advantage as they survive better in this environment), but they are costly (i.e. confer a fitness disadvantage such as lower mating success, lower survival, etc. in absence of treatment) and thus selected against in non-treated areas (LENORMAND et al.
1998). No estimates of the relative fitness of these three resistance alleles are available so far. We are still largely ignorant as to the precise mechanisms of amelioration operating in this example and would like to know if these allele replacements involved alleles increasing their advantage in treated area (s), decreasing their cost (c) or both. It is important to stress at this point that whether an allele replace another does not simply follow from s and c values, but also depends in a non-trivial way on gene flow and habitat spatial structure (NAGYLAKI
and LOU 2001). Although observing gene replacement allows qualitative inferences about the
relative fitness of the competing alleles, only quantifying differences in fitness and their components (s and c) will enable us to discriminate between distinct scenarios of amelioration (direct or compensatory) and measure the net fitness change occurring during the process of amelioration.
The problem is that identifying such a subtle process requires precise methods to disentangle the relative values of s and c among adaptive alleles: while it is relatively easy to measure large fitness differences among two alleles (e.g. between susceptible and resistance alleles), it is more difficult when the differences are slight (e.g. between two resistance alleles) and a greater number of alleles are involved. In laboratory and model organism (especially microbes) studies it is possible to measure selection coefficient with a precision of less than 1% (e.g. DE GELDER et al. 2004; DE VISSER and ROZEN 2006). However, despite a
long history of estimating the strength of natural selection in nature (see MANLY 1985;
ENDLER 1986; HOEKSTRA et al. 2001, for review), this precision has never been reached with
field data. The study of spatial and temporal frequency variation of adapted alleles has been one of the most accurate methods of estimating natural selection (e.g. HALDANE 1948;
KETTLEWELL and BERRY 1961; MAY et al. 1975; MALLET and BARTON 1989; MALLET et al.
1990; MANI 1990; MANI and MAJERUS 1993; LENORMAND et al. 1998; COOK 2003;
HOEKSTRA et al. 2004). However, at least two issues are crucial to obtaining accurate
estimates with this method. The first issue is disentangling the effects of migration and selection on frequency variation (e.g. BRAKEFIELD and LIEBERT 1990). This problem can be
overcome by estimating migration directly (e.g. using mark-recapture, BRAKEFIELD and
LIEBERT 1990, or neutral genetic markers, HOEKSTRA et al. 2004), or by estimating migration
from patterns of linkage disequilibria among locally adapted alleles (LENORMAND et al.
MALLET and BARTON 1989). The second difficulty is that inference of selection depends on
the validity of the underlying migration–selection model. In most cases it is necessary to assume that the observed spatial frequency pattern is at migration – selection equilibrium, precluding the study of transient allele replacement.
In this paper, we developed a powerful approach that does not assume migration – selection equilibrium, and which comes close to the precision obtained under laboratory conditions. We used this approach to estimate the selection coefficients of the Ester alleles in
C. pipiens from the pattern of resistant allele replacement at this locus in Montpellier area.
We used the 15-year Ester allele frequency series to estimate the magnitude of the two fitness components, cost (c) and selective advantage (s), conferred by each resistance Ester allele, by combining the information of both spatial and temporal frequency variation. We also investigated the effect of dominance among the different alleles on the quality of our estimates. In addition we looked for evidence that the selection regime had changed or that compensatory modifiers had spread in these populations. Finally, we discuss what this case study tells us about the processes of amelioration in natural populations.
MATERIAL AND METHODS
In the Montpellier area, the mosquito Culex pipiens is treated with OP insecticides on a coastal belt delimiting two areas (Figure 1): a treated area close to the Mediterranean Sea, where resistant alleles tend to be frequent due to their selective advantage (s), and a non-treated area more inland where resistant alleles are less frequent due to their cost (c). The frequency of resistant alleles thus display a clinal shape along a transect from the sea (treated) to the inland (untreated). At equilibrium between migration and selection, the rate of decline
in the frequency of resistance is proportional to the intensity of migration (σ), and depends on the magnitude of selection in the two areas.
In this study, we thus present a model using spatial information from clines to estimate selective advantages and costs, but also temporal information from long term survey (~15 years) to estimate the selection coefficients of each allele in each environment. With this approach, we focused on the long term trend of allele replacement. For a proper comparison among years, we used data from only one season (summer), ignoring within years variations that are not directly relevant to the long term trend. Importantly, this approach does not make any equilibrium assumption: the initial situation is fitted by a description of the clines of the first year in the series (1986), and all the clines in the following years depend on these initial frequencies, migration rate and selection coefficients of the different alleles (See Supplementary materials for a review of previous models).
Data collection: The dataset is a compilation of published Ester starch-gel electrophoresis phenotype frequencies from samples collected in the Montpellier area from 1986 to 2002 (GUILLEMAUD et al. 1998; LABBÉ et al. 2005). We used samples from years 1986 (9
populations, N = 354), 1987 (3 populations, N = 193), 1991 (9 populations, N = 217), 1993 (2 populations, N = 110), 1995 (8 populations, N = 1203), 1996 (9 populations, N = 512), 1999 (9 populations, N = 582), 2001 (9 populations, N = 736) and 2002 (9 populations, N = 521) to perform our analysis, considering only samples collected during the summer. A total of 4428 individuals were analyzed.
Insecticide treatment: The size of the treated area is pivotal to estimating the selection parameters from cline analysis (LENORMAND et al. 1998). In order to obtain good estimation
insecticide treatment agency (EID, Entente Interdépartementale de Démoustication) from 1990 to 2002. In previous years (1986 to 1989), treatment applications (i.e. treated area size and quantities used) did not change significantly (EID 1992; GUILLEMAUD et al. 1998). We
used GIS data to estimate the quantities of insecticide applied in the Montpellier area. The total area analyzed was 40 km wide (20 km each side of the sampling transect) and 35 km long, perpendicularly to the coast. We divided this area in 2 km wide stripes, parallel to the coast. The OP quantity used in each stripe, qj, expressed in liter.km-2 (L/km2), was computed
as
∑
∑
= i ij i i i ij j A q A A q (1),where Aij is the area of each district i within the stripe j, Ai and qi the total area and the
quantity of insecticide used in this district i, respectively. We determined the width of the treated area as the distance from the sea where the quantities of insecticides treatments used drops for most years to 0 L/km².
Migration-Selection Model: In order to estimate the relative costs and selective advantages of each the three alleles at the Ester locus we used a deterministic stepping stone-like model to follow frequency changes. The order of life cycle was assumed to be reproduction-selection-migration. We assumed 13 generations per year according to LENORMAND et al.
(1999) and a constant population density across treated and non-treated areas (we will discuss this last hypothesis below). Algorithms of migration and selection were checked using analytical results for one locus provided by equations 32-33 in NAGYLAKI (1975).
Reproduction. Each generation was computed from the previous one assuming
Hardy-Weinberg proportions in each deme independently (each deme being considered as an infinite population), as it has been shown that data are congruent with this assumption (LABBÉ et al.
Selection. The fitnesses of the Ester alleles were computed as follow: let si and ci be
the fitness advantage conferred by resistance alleles in treated area and the fitness cost of the allele i, respectively; let hsij be the dominance of the benefit for resistance and hcij the
dominance of the cost of the allele i over the allele j. The fitness wij of the diploid genotype
(ij) was computed as
wij = 1 + γ [si + hsij (sj - si)] – [ci + hcij (cj - ci)] (2),
with γ = 1 in the treated area and γ = 0 in the non-treated area and where the fitness of a susceptible homozygote w00 = 1 (i.e. s0 = c0 = 0). For γ = 1, [si + hsij (sj - si)] represents the
overall advantage of the resistance genotype in the treated area. [ci + hcij (cj - ci)] represents its
cost in both the treated and the untreated area. hsij ranges from 0 (total dominance of i over j)
to 1 (total dominance of j over i), with 0.5 representing codominance. hcij ranges from 0 to a
value >1 (overdominance), providing that cj >ci. As there are three resistance alleles at Ester
locus, 18 parameters were used to describe selection at this locus: the costs, c1, c2, c4, the
advantage of resistance s1, s2, s4 (for Ester1, Ester2 and Ester4, respectively) and the 6
dominance parameters for the cost and the advantage of resistance of the four alleles (Ester0,
Ester1, Ester2 and Ester4).
To consider indirect selection due to genetic association of Ester alleles with the other
C. pipiens main OP resistance locus, ace-1, we used fitness parameters estimated for ace-1 in
previous study (sR = 0.33 and cR = 0.11, LENORMAND et al. 1999, ignoring possible fitness
differences between ace-1resistance alleles) and assumed codominance at this locus. We also assumed multiplicative fitness between the ace-1 and Ester loci and used the recombination rate between the two loci (r = 14.5%) estimated from laboratory crosses (LENORMAND et al.
1998).
The frequency of genotype k in deme l after selection g’kl was computed from its
g’kl = gkl wkl / Wl (3),
where wkl is the fitness of genotype k in deme l and Wl the mean fitness in deme l. We first
computed selection coefficients by assuming that all alleles were codominant (i.e hsij = hcij =
0.5 for all alleles): this is the COD model. We then relaxed this hypothesis by allowing dominance parameters to differ from 0.5: this is the NOCOD model.
Migration. One-dimensional clines were simulated by a series of demes connected by
migration (one deme every 2 kms, 35 demes in total). The migration distribution was reflected at one edge of the stepping-stone, to simulate a semi-infinite environment and take into account the presence of the sea (LENORMAND et al. 1998). We used an approximately
gaussian dispersal kernel with a parent-offspring distance standard deviation σ = 6.6 km.generation-1/2; this value has been estimated by LENORMAND et al. (1998) using the spatial
pattern of linkage disequilibrium between resistance locus. This method does not require assuming migration–selection equilibrium at the selected loci as far as the linkage disequilibrium equilibrates faster than frequency changes. This latter situation will be easily met if the resistance alleles are not too far from an equilibrium or if their frequency change slowly, provided that the loci are not too tightly linked (this in the well-studied quasi linkage equilibrium situation, BARTON and GALE 1993; NAGYLAKI 1993). This situation is very likely
to be met in our case as the recombination rate between resistance loci is quite large (r ~ 15%) and the important frequency changes at these loci occurs at the scale of hundreds of generations.
Initial conditions. Only phenotype data are available due to the dominance of
overproduced esterases in the identification method (starch-gel electrophoresis, see
Parameters estimations). Thus, to obtain initial conditions,we estimated (simultaneously with the selection coefficients) the distribution of the frequency of each allele in 1986 (first year of sampling available) using a descriptive model as in previous studies (LABBÉ et al. 2005;
LENORMAND and RAYMOND 2000). In 1986, only Ester1 and Ester4 alleles were present, as
Ester2 was detected for the first time in 1990 in the Montpellier area (one heterozygote individual found among all populations sampled, RIVET et al. 1993). Frequency clines for the
two first resistance alleles i (i = 1 or 4 for Ester1 and Ester4, respectively) were simultaneously fitted to a scaled negative exponential
pi = ki exp[-(aix2 + bix)] (4),
where x is the distance from the coast, and ki, bi and ai are the estimated parameters. ki is the
frequency of resistance allele i for x = 0 (i.e. at the coast). As the Ester2 allele was not yet present in 1986, we introduced it t* generations after 1986, at a frequency of 0.001 in all demes. t* was estimated together with the other parameters. As all the parameters (initials conditions, selection coefficients and t*) are fitted simultaneously, the model is not particularly susceptible to the initial conditions and choosing another year to start the estimation would not change them significantly (of course, the longest the period considered, the better the estimation).
Parameters estimations: The method of estimation is a standard maximum likelihood approach. Deterministic recursions described above generate the predicted clines of each allele at any point in time for a given set of parameter values. It is then straightforward to compute the probability of observing a sample at any location in any year given this prediction. Assuming that the different samples are independent, the likelihood of a full 15 year scenario can then readily be obtained. The only difficulty, however, is the computer time needed to maximize this likelihood given that a single 15 years prediction requires simulating ~200 generations in a relatively large stepping stone. Recursions and likelihood maximisation algorithms were written and compiled using DelphiTM v. 7 (Borland Software Corporation).
The Ester phenotype of each mosquito was obtained using starch-gel electrophoresis. This technique does not allow complete identification of genotype (GUILLEMAUD et al. 1998;
LENORMAND et al. 1998; LABBÉ et al. 2005) because the presence of a susceptible allele
cannot reliably be detected in an individual with an overproduced resistance allele. The phenotype was thus considered to be a seven-state random variable ([0], [1], [2], [4], [12], [14], [24], where phenotype [i] corresponds to genotypes Esteri/Ester0 or Esteri/ Esteri, and phenotype [ij] correspond to genotype Esteri/ Esterj, see LENORMAND et al. 1998). The
log-likelihood of a sample was computed from the phenotypic multinomial distribution. Let nij
and fij be the observed number and expected frequency of individuals having phenotype i in
population j, respectively. The log-likelihood L of observing all the data is proportional to
( )
ij j ij i f n L=∑
∑
ln (5).It was maximized for parameters joint estimation, using a simulated annealing method (using a Metropolis algorithm, see LENORMAND AND RAYMOND 2000).
Model comparison and tests: For the complete COD model (model COD-A), a total of 13 parameters needed to be estimated: (i) s1, s2, s4, the selective advantages of Ester1, Ester2 and Ester4 respectively, (ii) c1, c2, c4, the selective costs of Ester1, Ester2 and Ester4 respectively,
(iii) k1, k4, a1, a4, b1 and b4, the parameters of the initial frequency clines in 1986 of Ester1 and Ester4 respectively, and (iv) t*, the date of apparition of Ester2. When the codominance hypothesis is relaxed (NOCOD model), 12 additional parameters are needed: (vi) hs10, hs20, hs40, hs21, hs41 and hs24, for the dominance of the resistance fitness benefitand (vii) hs10, hs20, hs40, hs21, hs41 and hs24, for the dominance of the cost (where 0, 1, 2 and 4 represent Ester0, Ester1, Ester2 and Ester4 respectively).
Model COD-A was then simplified using likelihood ratio tests corrected for over-dispersion (F-test, LEBRETON et al. 1992; ANDERSON et al. 1994) to find the best adequate
model. We first determined whether the selective advantages si andsj of alleles i and j were
significantly different by setting s1 =s2, s1 =s4, s2 =s4 in models COD-B1, COD-B2 and COD-B3, respectively, all other parameters being freely estimated. Similarly, we then determined whether costs ci andcj of alleles i and j were significantly different. We computed the models
COD-C1, COD-C2 and COD-C3 by setting c1 =c2, c1 =c4, c2 =c4, respectively, with all other
parameters being freely estimated. Models combining more complex hypotheses (i.e. constraining both s and c values to be identical among some alleles) were then computed as models COD-D, with all other parameters again being freely estimated.
Over-dispersion was computed from model COD-A as the ratio of residual deviance (the deviance equals -2 x ln[likelihood]) over residual degrees of freedom. We computed the percentage of total deviance explained by a model (%TD) as
%TD = (Dmax – Dmodel) / (Dmax – Dmin) (6),
where the maximal deviance (Dmax) is obtained by fitting a minimal model in which the
frequency of each allele in each population is set to its average along the transect and over years, and the minimal deviance (Dmin) obtained by fitting a maximal model in which the
frequency of each allele in each population is set to its observed frequency. Models were compared using F-tests in order to correct for overdispersion. All deviances were also corrected for overdispersion to estimate the support limits of each parameter p. These were computed by maximising or minimizing the value of p, for upper limit (pmax) and lower limit
(pmin), respectively. All other parameters were allowed to change, ensuring us to find the
actual pmax and pmin in the range of the multidimensional parameter landscape where
likelihood is not significantly different from the maximum likelihood of the model, using the same simulated annealing method.
We used the same process when relaxing the overdominance hypothesis (NOCOD models) and simply tested whether each dominance parameter was significantly different from 0.5 (codominance) or not, all other parameters being again freely estimated.
RESULTS
Insecticide treatment: The treatment practices for the period 1990-2002 are presented in Supplemental Figure 1 (Supplementary Materials). Over the 12 years analyzed, the treated area size is roughly constant and runs 16 km inland from the sea, although treatment extension and intensity was higher in the first years analysed (Supplemental Figure 1). The total amount of insecticides used is variable over the years, from 124.3 to 733.1 L.km-2 (Supplemental Figure 2, Supplementary Materials). The treated area is not evenly treated: immediately close to the sea, treatments are less intense, due to less suitable breeding sites for
C. pipiens. This mosquito needs freshwater to reproduce and brackish lagoons near the sea
largely reduce the area with potential breeding sites. However, for simplicity we considered the treated area as an approximately uniformly treated surface in the model, as we have no clue about how the dose of insecticide relates to fitness in the field.
Model comparison and tests: Model selection was performed using likelihood ratio tests corrected for overdispersion (F-test, LEBRETON et al. 1992; ANDERSON et al. 1994) to
determine whether the selection coefficients were different among alleles. Results of each comparison are detailed in Table 1. Under the codominance hypothesis, in the simplest adequate model (model COD-D) the selective advantages of Ester1 and Ester4 and the costs of
lower for Ester4 (i.e. c4 < c2 = c1). Relaxing the codominance hypothesis modifies the results,
such that neither the selective advantages nor the costs of Ester1 and Ester4 are significantly different (i.e. s1 = s4 and c1 = c4, model NOCOD-D).
Parameters estimations: The first six parameters of our models are those describing the initial clines (1986): the initial maximum frequencies (k1 and k4) and the rates of decline (a1, a4, b1 and b4) of each allele present (Ester1 and Ester4). This initial cline is best described by
an exp(-x2) shape, where x is the distance from the coast (k1 = 0.461, k4 = 0.233, a1 = 0.095, a4
= 0.071, b1 = b4 = 0).
Under the codominance hypothesis, the simplest model (COD-D) is built with four other parameters describing selective advantage and cost: s1 = s4, s2, c1 = c2 and c4. The best
value of each of these and corresponding support limits are indicated in Table 2A. This model explains 70.3% of the total deviance with low overdispersion (~1.52).
Relaxing the codominance hypothesis introduces 12 additional parameters of dominance associated to s and c, hsij and hcij. Among these only one, hs20, the advantage
dominance of Ester2 over Ester0, is significantly different from 0.5 (codominance) (hs20=
0.076, Table 2B). Under this hypothesis, the simplest model (NOCOD-D) is built with four parameters describing selective advantage and cost: s1 = s4, s2, c1 = c4 and c2, the differences
in cost and advantage dominances, hc and hs, alone explaining the allele replacement. The best value of each of these and corresponding supporting limits are indicated in Table 2B. This model explains 72.9% of the total deviance with low overdispersion (~1.43).
The last parameter, the time to Ester2 appearance t*, is estimated to 45 and 48 generations (with and without the codominance hypothesis respectively), which corresponds to ~1989 with support limits being 30-60 generations, i.e. 1988-1990.
The predicted cline of each allele (spatial frequencies variation) is presented in Figure 2, for each year for which samples are available, under the NOCOD-A model. The computed variation over the period 1986-2002 (temporal frequencies variation) of the maximal frequency of each allele is presented in Figure 3 (NOCOD-A model). It shows the replacement of Ester1 by Ester4 that occurred during the 1990s. It also predicts the replacement of Ester4 by Ester2 over the period 2002-2024 (Figure 3), providing that treatment practices will not change during this period.
To assess whether there was a consistent variation of selection coefficients over time, we used two estimators of the goodness of fit, overdispersion and percentage of deviance explained by the model, for each sampling year. The variability over the 1986-2002 period of these two measures is presented in Supplemental Figure 3. Each sampled year independently is well fitted with more than 50% and up to 82% of the total deviance explained and an overdispersion inferior to 2 for each of them.
DISCUSSION
Natural selection is notoriously difficult to measure in the wild, and this imposes an important limit on our ability to study evolution and to test in natura theories of adaptation. However, the study of cline series is a particularly informative situation since temporal and spatial frequency variation can be combined to estimate selection. We illustrate this approach with the evolution of insecticide resistance in the mosquito Culex pipiens: the resistance allele replacement observed at the Ester locus in the Montpellier area since 1986 allows us to analyse the process of amelioration with a degree of precision more typical of laboratory than field studies (down to a precision of ~2% for some selection coefficients). In addition, this is
the first time, to our knowledge, that estimation of the relative fitness of more than two alleles at a single locus has been performed using field data (our model is nevertheless in accordance with previous average measures of fitness on this system, see Comparison with previous estimations, Supplementary Materials). This approach enabled us to study in more detail the process of allele replacement in the field and to determine whether it was driven by direct or compensatory amelioration. It also enables us to quantify the amount of fitness variation occurring at the different stages of the process.
Selection coefficients: The selection coefficient estimations provided for the various resistance alleles (Table 1) accurately explain the allele replacements observed in Montpellier area (70% of the total deviance is explained). With the susceptible allele fitness being w0=1,
the overall resistance allele fitness orders are Ester2 (w2 = 1.250) > Ester4 (w4 = 1.154) > Ester1 (w1 = 1.112) in the treated area and Ester4 (w2 = 0.964) > Ester1 (w4 = 0.922) > Ester2
(w1 = 0.880) in the non-treated area (COD-A model, Table 2). The fitnesses differences
detected between resistant alleles can thus be relatively small compared to the differences between susceptible and resistant (e.g. in treated area Ester4 fitness is w4 = 1.038 relative to Ester1, i.e. if w1 = 1, although Ester2 differences with Ester4 and Ester1 are still quite large,
e.g. in treated area w2 = 1.124 relative to Ester1).
During the 1990s, Ester4 replaced Ester1 (Figure 3, GUILLEMAUD et al. 1998; LABBÉ et
al. 2005). We show here that Ester1’s selective advantage is not significantly different from that of Ester4 (relative to s1, s4 = 0, SL = -0.026 – 0.019), but that its cost is higher under the
codominance hypothesis (relative to c1, c4 = -0.045, SL = -0.055 – -0.035). Thus, the lower
cost of Ester4 could be pivotal in explaining the replacement of Ester1 by Ester4. However, if dominances are different from 0.5, the estimated costs of Ester1 and Ester4 are not distinguishable (relative to c1, c4 = -0.002, SL = -0.032 – 0.059). In this case, the allele
replacement is due to the cost being more dominant for Ester1 than Ester4 (the cost of (Ester1/Ester0) heterozygotes is closer to that of (Ester1/Ester1) than (Ester0/Ester0) homozygotes, whereas the cost of (Ester4/Ester0) heterozygotes is closer to that of (Ester0/Ester0) than (Ester4/ Ester4) homozygotes). However dominances remain difficult to precisely estimate using these data (Table 2B). Fitting dominances only marginally increases the overall goodness of fit, explaining no more than 3% more of the deviance than the codominance model. Finally, laboratory data provide support for Ester1 having a higher cost than Ester4 (see Comparison with laboratory experiments, Supplementary Materials), suggesting a compensatory amelioration in this first allele replacement.
Ester2 was first detected in Southern France near Marseille (~150 km from Montpellier) in 1986, but it was first detected at a very low frequency in the Montpellier area in 1990 (RIVET et al. 1993). Our study estimates its first occurrence near Montpellier during
the year 1989, which indicates a quite fast spread of this allele in the south of France (c.a. 50 km per year in approximately 3 years). This alone suggests a strong fitness advantage for this resistance allele. It remained at low frequency (coastal frequency < 0.1) until 1999 (GAZAVE
et al. 2001; GUILLEMAUD et al. 1998; LABBÉ et al. 2005) and then progressively increased in
frequency (coastal frequency ~ 0.2 in 2002), leading to a decrease in the frequency of Ester1 and the stabilization of the frequency of Ester4 (LABBÉ et al. 2005). As shown in this study,
this seems to be explained by a strong selective advantage leading to a higher fitness of Ester2 in the treated area compared to the previous alleles (relative to s1, s2 = 0.158, SL = 0.072 –
0.282; relative to s4, s2 = 0.158, SL = 0.077 – 0.288), despite a higher cost (relative to c1, c2 =
0.188, SL = 0.118 – 0.329; relative to c4, c2 = 0.155, SL = 0.082 – 0.302; see Table 2). Thus,
the increased advantage of Ester2 in the treated area compensates for its increased cost in the non-treated area, indicating that this second allele replacement is most probably due to a direct amelioration (see also Comparison with laboratory experiments, Supplementary
Materials). Finally, our estimations (Figure 3) indicate that without any modification in the insecticide treatment practices, Ester2 would eventually replace both alleles in about 20 years, the approximate time from the appearance of Ester4 until now.
Limit of the approach: In this study, we used two main assumptions by neglecting the intra annual variation and the density variation between treated and non-treated areas (other parameters, including the initial conditions, are fitted in the model or were obtained independently; see Migration-Selection Model, Material and Methods). For practical reasons of computational time, intra annual variations of selection coefficients were not taken into account in our model. Because we ignored them, we cannot determine if the different resistance alleles are selected differently in different season (e.g. if differences in the fitness cost are due to difference in mortality during female overwintering or to differences of larval development time during summer; GAZAVE et al. 2001; LENORMAND et al. 1999;
LENORMAND and RAYMOND 2000). Thus, the estimates we give have to be understood as
annual averages. However, the cline observed in summer is relatively independent of what happened during the rest of the year, so that the hypothesis of a temporary migration-selection equilibrium reached each year at the end of summer is reasonably accurate (see Comparison with previous estimations in Supplementary Material), although the allele replacement modifies this equilibrium from one year to another. Density differences between treated and non-treated areas may bias our estimates of selection by causing an asymmetrical gene flow between the two habitats (NAGYLAKI 1978). This is true in particular for the relative selection
coefficients between susceptible and resistance alleles. Like for selection, the density pattern may also vary seasonally or among years. Thus, the estimates we give have to be understood as if density was constant. For instance, if density is lower in the treated area (which is not necessarily the case, LENORMAND et al. 1998), larger s would be required to maintain the
same clines. However, it is important to underline that because the different resistance alleles experience the same density variation across treated and non treated area and because they have very similar spatial distribution (see Figure 2), this bias is minimal as far as resistance alleles are compared to one another, as it is the case in our study (i.e. the values of s and c relative to the susceptible allele might be biased, but the differences between s1, s2 and s4 on
one hand, or between c1, c2 and c4 on the other hand, cannot be strongly affected by density
effects). The same arguments hold for demographic, topological or treatment intensity variations that could occur perpendicular to our transect (although we are unaware of such variation over few tens of km East or West of our transect). Globally, our model explains more than 70% of the total deviance (TD) observed in the evolution of Ester resistance genes in Montpellier area (with a low global overdispersion, ~1.43). There is no indication of a trend towards increase or decrease of %TD or overdispersion during allele replacement (Supplemental Figure 3), as would be the case if selection changes with time. This would be the case, for example, if a modifier gene appeared at another locus during the course of the replacement, as was seen in Lucilia cuprina (for a review see MCKENZIE 1996). Such a
modifier could increase the fitness of resistant Ester alleles by reducing their deleterious side-effects. Although our power to detect a compensatory modifier was limited, especially if it had a weak effect, a modifier gene is not necessary to explain the trends observed in natural populations through this long-term study.
The process of amelioration: This work enables us to understand the causes of the resistance allele replacement observed at the Ester locus in the Montpellier area. Our model and previous laboratory experiments (see Supplementary Materials) suggest that Ester1 has most probably been replaced by Ester4 because Ester4 is less costly (compensatory amelioration). Currently, a second replacement is occurring: Ester2 is replacing Ester4 despite a higher
fitness cost, due to a higher selective advantage in the treated area (direct amelioration). Thus, contrary to the first replacement during which a more ‘generalist’ allele was selected, the second replacement involves an allele which is more ‘specialist’ to treated areas, leading to the reinforcement of local adaptation. There are two ways by which evolution may proceed ultimately if the insecticide treatments are maintained. The first option would involve further evolution towards specialist alleles that confer high resistance but with strong pleiotropic effects, such as Ester2. This type of situation occurs when there is a strong trade-off between conflicting selection pressures in the different habitats. In such a situation a stable polymorphism is likely to be maintained and may lead to the evolution of distinct niches. The second option would involve further evolution towards generalist alleles that confer resistance with little pleiotropic effects, such as Ester4. This type of situation occurs when there is a weaker trade-off between the conflicting selection pressures in the different habitats. In this scenario the polymorphism is likely to be lost rapidly, with the fixation of a ‘cost-free’ resistance allele, which corresponds to an extension of the niche. It is interesting to note that in our case both options have occurred successively in combination with a changing environment. The evolution at the Ester locus is certainly influenced by treatment practices, and it is possible that if insecticide treatment intensity decreases Ester4 may be favoured again due to its lower cost, with the stronger resistance of Ester2 then being less advantageous. This emphasizes the role of local treatment practices, which have been shown to be crucial in the competition of Ester alleles on a worldwide scale (LABBÉ et al. 2005).
The theory of adaptation: From a more general point of view, the evolution of insecticide resistance at the Ester gene represents a first step to study theories of adaptation (ORR 2005)
in nature. Although amelioration has been reported from field studies (e.g. MCKENZIE 1993),
knowledge of the history and genetic bases of the adaptive changes. Viewed at first as a slow process of accumulation of small mutations toward a fitness optimum (FISHER 1928; HARTL
and TAUBES 1996), the process of adaptation is now thought to imply larger fitness effect
mutations, occurring early in the process, and smaller mutations occurring subsequently to refine the adaptation (COHAN et al. 1994; BARTON 1998; ORR 1998; ORR 2000; BARTON and
KEIGHTLEY 2002; ORR 2005). This theory has been supported by laboratory studies (e.g.
COHAN et al. 1994; OXMAN et al. 2008), but ours gives new support from field data: the first
mutation, Ester1, was indeed a mutation of large fitness effect (relatively to ancestral susceptible alleles), the second, Ester4, had a smaller fitness effect and refined the adaptation by lowering the cost, and the third, Ester2, had again a large effect on fitness (Table 2). Albeit representing few steps, this field study is consistent with the theory formalized by ORR
(1998). Interestingly, this study also provides some insights about the fact that adaptation is local, and thus that several strategies are possible in the course of adaptation to a heterogeneous environment. It is difficult to predict whether local adaptation will reinforce itself and lead to the evolution of specialist strategies or whether a generalist strategy that can exploit all habitats will emerge. The course of events obviously depends on the selective properties of the new resistance alleles that occur (and the underlying trade-off). Our study illustrates this point precisely: Ester4 was more generalist than Ester1 (low c), but it is now being replaced by Ester2 a more specialist allele (high s, high c). The theory of adaptation tends to focus primarily on evolution in a single population. It will benefit from taking into account the spatial and temporal variability of the environment.
We are very grateful to T. Guillemaud, D. Allen, M. Weill and anonymous reviewers for very helpful comments on the manuscript, A. Berthomieu, C. Berticat, M. Marquine, S. Unal and C. Bernard for technical assistance and V. Durand for literature search. This work was funded in part by ANR MOREVOL. Contribution 2008.xxx of the Institut des Sciences de l’Evolution de Montpellier (UMR CNRS-UM2 5554).
LITERATURE CITED
ANDERSON, D. R., K. P. BURNHAM and G. C. WHITE, 1994 AIC model selection in
overdispersed capture-recapture data. Ecology 75: 1780-1793.
BARTON, N., 1998 Evolutionary biology: The geometry of adaptation. Nature 395:
751-752.
BARTON,N.H., and G. M.HEWITT, 1985 Analysis of Hybrid Zones. Annual Review of
Ecology and Systematics 16: 113-148.
BARTON, N. H., and P. D. KEIGHTLEY, 2002 Understanding quantitative genetic
variation. Nature Review Genetics 3: 11-21.
BRAKEFIELD, P.M., and T.G. LIEBERT, 1990 The Reliability of Estimates of Migration
in the Peppered Moth Biston betularia and Some Implications for Selection-Migration Models. Biological Journal of the Linnean Society 39: 335-341. CARRIÈRE, Y., J.-P. DELAND, D. A. ROFF and C. VINCENT, 1994 Life-history cost
associated with the evolution of insecticide resistance. Proceedings of the Royal Society of London B 258: 35-40.
CASPARI,E., 1952 Pleiotropic gene action. Evolution 6: 1-18.
COHAN, F. M., E. C. KING and P. ZAWADZKI, 1994 Amelioration of the deleterious
pleiotropic effects of an adaptive mutation in Bacillus subtilis. Evolution 48: 81-95.
COOK, L. M., 2003 The rise and fall of the Carbonaria form of the peppered moth.
DE GELDER, L., J. M. PONCIANO, Z. ABDO, P. JOYCE, L. J. FORNEY et al., 2004
Combining mathematical models and statistical methods to understand and predict the dynamics of antibiotic-sensitive mutants in a population of resistant bacteria during experimental evolution. Genetics 168: 1131-1144.
DE VISSER,J., and D.E.ROZEN, 2006 Clonal interference and the periodic selection of
new beneficial mutations in Escherichia coli. Genetics 172: 2093-2100.
EID, 1992 Rapport d'activité technique et scientifique. Entente Interdépartementale de Démoustication, Montpellier.
ENDLER, J. A., 1986 Natural selection in the wild. Princeton University Press,
Princeton, N.J.
FISHER, R. A., 1928 The possible modification of the response of the wild type to
recurrent mutations. The American Naturalist 62: 115-126.
GAZAVE, E., C. CHEVILLON, T. LENORMAND, M. MARQUINE and M. RAYMOND, 2001
Dissecting the cost of insecticide resistance genes during the overwintering period of the mosquito Culex pipiens. Heredity 87: 441-448.
GUILLEMAUD,T., T.LENORMAND, D.BOURGUET, C.CHEVILLON, N.PASTEUR et al., 1998
Evolution of resistance in Culex pipiens: allele replacement and changing environment. Evolution 52: 443-453.
HALDANE,J.B.S., 1948 The theory of a cline. Journal of Genetics 48: 277-283.
HARTL, D. L., and C. H. TAUBES, 1996 Compensatory Nearly Neutral Mutations:
Selection without Adaptation. Journal of Theoretical Biology 182: 303-309. HOEKSTRA, H. E., K. E. DRUMM and M. W. NACHMAN, 2004 Ecological genetics of
adaptive color polymorphism in pocket mice: geographic variation in selected and neutral genes. Evolution 58: 1329-1341.
HOEKSTRA,H.E., J.M.HOEKSTRA, D.BERRIGAN, S.N.VIGNIERI, A.HOANG et al., 2001
Strength and tempo of directional selection in the wild. Proceedings of the National Academy of Sciences 98: 9157-9160.
KETTLEWELL,H. B.D., and R.J.BERRY, 1961 The study of a cline. Heredity 16:
403-414.
LABBÉ, P., A. BERTHOMIEU, C. BERTICAT, H. ALOUT, M. RAYMOND et al., 2007
Independent duplications of the acetylcholinesterase gene conferring insecticide resistance in the mosquito Culex pipiens. Molecular Biology and Evolution 24: 1056–1067.
LABBÉ, P., T. LENORMAND and M. RAYMOND, 2005 On the worldwide spread of an
insecticide resistance gene: a role for local selection. Journal of Evolutionary Biology 18: 1471-1484.
LEBRETON, J.-D., K. P. BURNHAM, J. CLOBERT and D. R. ANDERSON, 1992 Modeling
survival and testing biological hypotheses using marked animals: a unified approach with case studies. Ecological Monographs 62: 67-118.
LENORMAND, T., D. BOURGUET, T. GUILLEMAUD and M. RAYMOND, 1999 Tracking the
evolution of insecticide resistance in the mosquito Culex pipiens. Nature 400: 861-864.
LENORMAND, T., T. GUILLEMAUD, D. BOURGUET and M. RAYMOND, 1998 Evaluating
gene flow using selected markers: a case study. Genetics 149: 1383-1392. LENORMAND,T., and M.RAYMOND, 2000 Analysis of clines with variable selection and
variable migration. The American Naturalist 155: 70-82.
LENSKI,R. E., 1988a Experimental studies of pleiotropy and epistasis in Escherichia
Coli. I. variation in competitive fitness among mutants resistant to virus T4.
LENSKI,R. E., 1988b Experimental studies of pleiotropy and epistasis in Escherichia
Coli. II. Compensation for maladaptive effects associated with resistance to
virus T4. Evolution 42: 433-440.
MALLET, J., and N. BARTON, 1989 Inference from Clines Stabilized by
Frequency-Dependent Selection. Genetics 122: 967-976.
MALLET,J., N.BARTON, G. LAMAS, J.SANTISTEBAN, M.MUEDAS et al., 1990 Estimates
of Selection and Gene Flow from Measures of Cline Width and Linkage Disequilibrium in Heliconius Hybrid Zones. Genetics 124: 921-936.
MANI, G. S., 1990 Theoretical-Models of Melanism in Biston betularia - a Review.
Biological Journal of the Linnean Society 39: 355-371.
MANI,G.S., and M.E.N.MAJERUS, 1993 Peppered moth revisited: analysis of recent
decreases in melanic frequency and predictions for the future. Biological Journal of the Linnean Society 48: 157-165.
MANLY, B. F. J., 1985 The statistics of natural selection on animal populations.
Chapman & Hall, London.
MAY, R. M., J.A. ENDLER and R. E.MCMURTRIE, 1975 Gene frequency clines in the
presence of selection opposed by gene flow. The American Naturalist 109: 659-676.
MCKENZIE, J.A., 1993 Measuring fitness and intergenic interactions: the evolution of
resistance to diazinon in Lucilia cuprina. Genetica 90: 227-237.
MCKENZIE,J.A., 1996 Ecological and evolutionnary aspects of insecticide resistance.
Academic Press, Austin, Texas, USA.
NAGYLAKI,T., 1975 Conditions for the existence of clines. Genetics 80: 595-615.
NAGYLAKI, T., 1978 CLINES WITH ASYMMETRIC MIGRATION. Genetics 88:
NAGYLAKI, T., and Y. LOU, 2001 Patterns of Multiallelic Polymorphism Maintained by
Migration and Selection. Theoretical Population Biology 59: 297-313.
ORR,H.A., 1998 The Population Genetics of Adaptation: The Distribution of Factors
Fixed during Adaptive Evolution. Evolution 52: 935-949.
ORR, H. A., 2000 The evolutionary genetics of adaptation: a simulation study.
Genetics Research 74: 207-214.
ORR, H. A., 2005 The genetic theory of adaptation: a brief history. Nature Reviews
Genetics 6: 119-127.
OXMAN, E., U. ALON and E. DEKEL, 2008 Defined order of evolutionary adaptations:
experimental evidence. Evolution 62: 1547-1554.
RAYMOND,M., C.BERTICAT, M.WEILL, N.PASTEUR and C.CHEVILLON, 2001 Insecticide
resistance in the mosquito Culex pipiens: what have we learned about adaptation? Genetica: 1-10.
RIVET,Y., M.MARQUINE and M.RAYMOND, 1993 French mosquito populations invaded
by A2-B2 esterases causing insecticide resistance. Biological Journal of the Linnean Society 49: 249-255.
WRIGHT, S., 1969 Evolution and the genetics of populations. University of Chicago
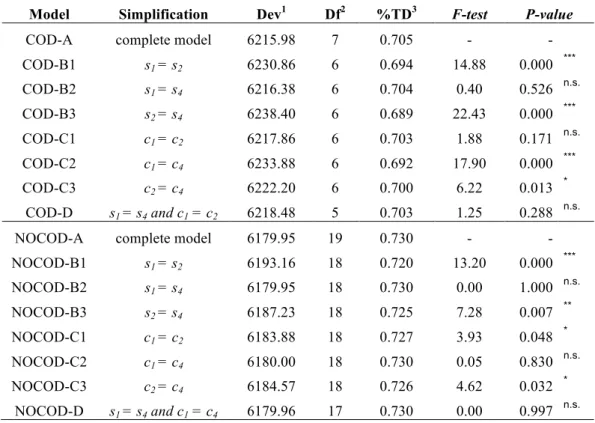
TABLE 1 Model selection.
Model Simplification Dev1 Df2 %TD3 F-test P-value
COD-A complete model 6215.98 7 0.705 - -
COD-B1 s1 = s2 6230.86 6 0.694 14.88 0.000 *** COD-B2 s1 = s4 6216.38 6 0.704 0.40 0.526 n.s. COD-B3 s2 = s4 6238.40 6 0.689 22.43 0.000 *** COD-C1 c1 = c2 6217.86 6 0.703 1.88 0.171 n.s. COD-C2 c1 = c4 6233.88 6 0.692 17.90 0.000 *** COD-C3 c2 = c4 6222.20 6 0.700 6.22 0.013 * COD-D s1 = s4 and c1 = c2 6218.48 5 0.703 1.25 0.288 n.s.
NOCOD-A complete model 6179.95 19 0.730 - -
NOCOD-B1 s1 = s2 6193.16 18 0.720 13.20 0.000 *** NOCOD-B2 s1 = s4 6179.95 18 0.730 0.00 1.000 n.s. NOCOD-B3 s2 = s4 6187.23 18 0.725 7.28 0.007 ** NOCOD-C1 c1 = c2 6183.88 18 0.727 3.93 0.048 * NOCOD-C2 c1 = c4 6180.00 18 0.730 0.05 0.830 n.s. NOCOD-C3 c2 = c4 6184.57 18 0.726 4.62 0.032 * NOCOD-D s1 = s4 and c1 = c4 6179.96 17 0.730 0.00 0.997 n.s.
The models are described in the text. They correspond to different simplifications of the complete model (COD-A and NOCOD-A, respectively with and without codominance hypothesis), indicated in the “Simplification” column. F-test statistic values and P-values indicate whether the deviance of the model considered is significantly different from that of the complete model A (n.s. P-value > 0.05, * P-value < 0.05, ** P-value < 0.01, *** P-value < 0.001). Each dominance parameter was set to 0.5 (COD) or freely estimated (NOCOD).
1The residual deviance of each model is scaled to the overdispersion of model A. 2df is the number of degrees of freedom.
TABLE 2 Best fitted parameters
A-
B-
For each parameter, the best value fitted is indicated, associated to the corresponding support limits (see text), A) for codominance hypothesis (COD-A model) and B) dominance
Parameter Best value Support limits
s1 0.19 0.15 - 0.24 s2 0.37 0.28 - 0.53 s4 0.19 0.16 - 0.21 c1 0.078 0.058 - 0.10 c2 0.12 0.050 - 0.28 c4 0.036 0.027 - 0.045 t* 45 30 - 60
Parameter Best value Support limits
s1 0.17 0.13 - 0.21 s2 0.51 0.35 - 0.72 s4 0.18 0.15 - 0.24 c1 0.057 0.040 - 0.079 c2 0.20 0.084 - 0.52 c4 0.059 0.027 - 0.11 t* 48 30 - 60 hs 10 0.19 0.00 - 0.57 hs 40 0.29 0.00 - 0.59 hs 20 0.076 0.00 - 0.29 hs 14 1.00 0.00 - 1.00 hs12 1.00 0.44 - 1.00 hs24 0.54 0.095 - 1.00 hc10 0.65 0.44 - 1.02 hc40 0.21 0.00 - 0.52 hc 20 0.36 0.00 - 0.86 hc 14 2.86 0.00 - 3.00 hc 12 0.00 0.00 - 0.88 hc 24 0.64 0.00 - 1.92
parameters being freely estimated (NOCOD-A model). In the last case, the estimated value of the dominance parameters, for selection, hsij, or for cost, hcij, are also indicated (values
FIGURE LEGENDS:
FIGURE 1. Sample site locations in the northwest southeast transect in the Montpellier area.
Samples are indicated with black circles. The dashed line represents approximately the border between treated and untreated areas (Labbé et al. 2005). C. pipiens is present in the whole area.
FIGURE 2. Cline fitting of the best model. The expected patterns of frequency variation along
the sampling transect are presented for each year of sampling. Samples frequencies of each allele are represented: Ester1 with diamonds, Ester4 with black triangles and Ester2 with crosses. Lines represent the expected clines under the NOCOD-A model (see Material and Methods): Ester1 with solid line, Ester4 with interrupted line and Ester2 with dotted line. The susceptible allele is not represented as its frequency is equal to 1- Σ(resistant allele frequencies).
FIGURE 3. Interannual variation of Ester alleles frequencies. The frequencies presented here
are the maximum frequencies, i.e. at the coast. The first allele to appear was Ester1 (with white diamonds), then replaced by Ester4 (black triangles) (GUILLEMAUD et al. 1998).
Recently, a third allele, Ester2, invaded the Montpellier area (crosses) (L
ABBÉ et al. 2005).
We used the estimation of coastal frequencies of the different alleles provided by LABBÉ et al
(2005). Lines represent the fitted values according to the NOCOD-A model (see Material and Methods). The susceptible allele is not represented as its frequency is equal to 1- Σ(resistant allele frequencies).
FIGURE 1. 10 km N Treated area Non-treated area Mediterranean Sea Montpellier Ganges SML NDL Viols St Gely Montferrier St Bauzille Maurin Pérols Orstom Lattes Brissac Cuculles Distill
FIGURE 2. 1996 0 0.1 0.2 0.3 0.4 0.5 0.6 0 10 20 30 40 50 60 1999 0 0.1 0.2 0.3 0.4 0.5 0.6 0 10 20 30 40 50 60 2001 0 0.1 0.2 0.3 0.4 0.5 0.6 0 10 20 30 40 50 60 2002 0 0.1 0.2 0.3 0.4 0.5 0.6 0 10 20 30 40 50 60 1995 0 0.1 0.2 0.3 0.4 0.5 0.6 0 10 20 30 40 50 60 1986 0 0.1 0.2 0.3 0.4 0.5 0.6 0 10 20 30 40 50 60 1991 0 0.1 0.2 0.3 0.4 0.5 0.6 0 10 20 30 40 50 60
Distance from the sea (Km)
Fr
eq
ue
nc
y
Distance from the sea (Km)
Fr
eq
ue
nc
y
Distance from the sea (Km)
Fr
eq
ue
nc
y
Distance from the sea (Km)
Fr
eq
ue
nc
y
Distance from the sea (Km)
Fr
eq
ue
nc
y
Distance from the sea (Km)
Fr
eq
ue
nc
y
Distance from the sea (Km)
Fr
eq
ue
nc
FIGURE 3. Years M axi m um f re que nc y 0 0.1 0.2 0.3 0.4 0.5 0.6 0.7 0.8 0.9 1985 1990 1995 2000 2005 2010 2015 2020 2025