HAL Id: hal-01627515
https://hal.inria.fr/hal-01627515
Submitted on 9 Nov 2017HAL is a multi-disciplinary open access archive for the deposit and dissemination of sci-entific research documents, whether they are pub-lished or not. The documents may come from teaching and research institutions in France or abroad, or from public or private research centers.
L’archive ouverte pluridisciplinaire HAL, est destinée au dépôt et à la diffusion de documents scientifiques de niveau recherche, publiés ou non, émanant des établissements d’enseignement et de recherche français ou étrangers, des laboratoires publics ou privés.
Non-linear MHD simulations of QH-mode DIII-D
plasmas and implications for ITER high Q scenarios
Liu Feng, Guido Huijsmans, Alberto Loarte, Andrea M. Garofalo, Wayne M.
Solomon, Matthias Hoelzl, Boniface Nkonga, Stanislas Pamela, Marina
Becoulet, Francois Orain, et al.
To cite this version:
Liu Feng, Guido Huijsmans, Alberto Loarte, Andrea M. Garofalo, Wayne M. Solomon, et al.. Non-linear MHD simulations of QH-mode DIII-D plasmas and implications for ITER high Q scenarios . Plasma Physics and Controlled Fusion, IOP Publishing, 2017, pp.1-20. �hal-01627515�
1
Non-linear MHD simulations of QH-mode DIII-D plasmas and implications for ITER high Q scenarios
F. Liu1, G.T.A. Huijsmans2,3, A. Loarte4, A. M. Garofalo5, W. M. Solomon5, M. Hoelzl6, B. Nkonga1,
S. Pamela7, M. Becoulet2, F. Orain6, D. Van Vugt3
1 Université Côte d’Azur, Laboratoire J.A. Dieudonné UMR n° 7351 CNRS UNS 06108 Nice Cedex
02, France
2CEA, IRFM, F-13108 Saint-Paul-Lez-Durance, France
3Eindhoven University of Technology, Eindhoven, The Netherlands
4ITER Organization, Route de Vinon sur Verdon, CS 90046, 13067 Saint Paul Lez Durance Cedex,
France
5General Atomics, P.O. Box 85608, San Diego, California 92186-5608, USA 6Max Planck Institute for Plasma Physics, 85748 Garching, Germany
7CCFE, Culham Science Centre, Abingdon, Oxon, OX14 3DB, UK
Feng.liu@iter.org Abstract
In nonlinear MHD simulations of DIII-D QH-mode plasmas it has been found that low n kink/peeling modes (KPMs) are unstable and grow to a saturated kink-peeling mode. The features of the dominant saturated KPMs, which are localized toroidally by non-linear coupling of harmonics, such as mode frequencies, density fluctuations and their effect on pedestal particle and energy transport, are in good agreement with the observations of the Edge Harmonic Oscillation (EHO) typically present in DIII-D QH-mode experiments. The non-linear evolution of MHD modes including both kink-peeling modes and ballooning modes, is investigated through MHD simulations by varying the pedestal current and pressure relative to the initial conditions of DIII-D QH-mode plasma. The edge current and pressure at the pedestal are key parameters for the plasma either saturating to a QH-mode regime or a ballooning mode dominant regime. The influence of E×B flow and its shear on the QH-mode plasma has been investigated. E×B flow shear has a strong stabilization effect on the medium to high-n modes but is destabilizing for the n=2 mode. The QH-mode extrapolation results of an ITER Q=10 plasma show that the pedestal currents are large enough to destabilize n=1-5 kink/peeling modes, leading to a stationary saturated kink-peeling mode.
1. Introduction
High performance and energy confinement in H-mode operation makes it the preferred regime in current tokamak machines and future devices such as ITER. However, the large pressure and current gradient in the H-mode edge transport barrier often drives edge localized modes (ELMs) which can produce high transient power and particle loads which may cause rapid erosion of the divertor plates in future machines [1,2]. Due to the detrimental effects of ELMs on the plasma facing components’ lifetime, there is a large ongoing effort on ELM control in both experimental and theoretical modelling areas [3-9]. The Quiescent H-mode (QH-mode) regime [10] has been found to provide high energy confinement without the large transient energy fluxes to PFCs associated with ELMs. In the QH-mode, the ELM bursts are replaced by a saturated MHD instability, the so-called edge harmonic oscillation (EHO), which provides stationary enhanced edge particle transport and limits the plasma to just below the peeling-ballooning stability limit. The MHD theory suggested that the EHO is a
2
kink/peeling mode (KPM), driven by high edge current and rotation, that enables the plasma to enter into a stationary state without ELMs [11,12]. The typical recipe for obtaining QH-mode regime explored on DIII-D is using neutral beam injection (NBI) either in the co direction or counter direction of the plasma current under conditions of low pedestal density/collisionality with strong plasma shaping [13,14].
One key question is what causes the plasma to develop into a QH-mode with a saturated KPM (EHO) or into a regime with ELMs. Early studies showed that the edge toroidal rotation provided by NBI torque could be an important ingredient in mode. Recently, experiments achieved access to QH-mode with zero-net NBI torque [15, 16], i.e. closer to ITER conditions. Later theoretical investigation on the effect of parallel rotation indicated that parallel rotation does not have a significant effect on the EHO saturation [17]. In experiments the QH-mode access with zero-net NBI torque are under the conditions in which E×B rotation remains in the pedestal region. In [11] it was shown that a minimum of E×B flow shear is required to obtain QH-mode with EHO. This indicates that the E×B rotation is an important factor in the evolution of the EHO, yet the mechanism of QH-mode onset and saturation still remains unclear. Hence, understanding the physics mechanisms leading to saturation of EHO in DIII-D QH-modes and the role of plasma rotation in EHO behaviour is an important issue for evaluating whether the QH-mode regime is an alternative option for high fusion performance operation at ITER. For this purpose, the non-linear evolution of MHD modes including toroidal modes typical for both KPMs and ballooning modes, have been investigated with the 3-D nonlinear MHD code JOREK [18-19] based on DIII-D QH-mode plasma #145117 from two different approaches. The initial conditions of the pedestal of plasma #145117, which is close to kink-peeling MHD stability boundary, have been varied to higher pedestal pressure but lower edge current where it is close to the ballooning mode to obtain conditions of either the EHO or Type I ELMs in the edge MHD stability space. Secondly, the E×B rotation speed in the pedestal region is varied to investigate its influence on QH-mode. JOREK simulations have been performed for the plasma conditions expected in ITER high fusion power plasmas (Q=10) to determine whether KPMs can be excited in ITER H-mode discharges.
2. The JOREK code and DIII-D data
The JOREK code [18] evolves the 3-D non-linear MHD equations in full toroidal X-point geometry including the separatrix, open and closed field lines. Both the full MHD model and reduced MHD models are available in JOREK. For the study presented here, the reduced MHD model is used; the details of the model can be found in [17]. In the JOREK code, both the poloidal plane (R, Z) and the physics variables are discretised by bi-cubic C1 Bezier finite elements [20]. For an accurate
representation of the small-scale radial variations and the large anisotropy of the perpendicular heat conduction, the finite elements are aligned to the flux surfaces of the initial equilibrium. The grid of finite elements extends up to a wall coinciding with a given flux surface outside the separatrix, here
3
typically at a normalised poloidal flux of N=1.08 (where N=0 on the magnetic axis and N=1 at the
separatrix). The variation in toroidal direction is represented with a Fourier series. The applied boundary conditions are different for boundaries parallel to the magnetic field (i.e. where the boundary of the domain coincides with a flux surface) and boundaries where the magnetic field crosses the boundary (i.e. open field lines in the divertor region). The boundary conditions on the wall surfaces coinciding with a flux surface are such that the values of all variables (density, temperature, electric potential, parallel velocity and poloidal flux) are constant in time. The conditions on the poloidal flux and electric potential correspond to ideal wall boundary conditions. Although the poloidal flux is constant at the wall, the gradient of the flux (i.e. the tangential magnetic field) is not fixed, consistent with ideal wall conditions. The condition on the electric potential leads to a tangential flow along the wall, i.e. no flow into the wall. On boundaries with open field lines, the boundary conditions are determined by sheath physics, as commonly applied in divertor physics simulations. The parallel component of the velocity is set to the local sound speed in the outgoing direction. The boundary condition on the parallel energy flux is described by a sheath transmission factor relating the convective and conductive energy fluxes [21]. Free boundary simulations including a resistive wall and a vacuum region can be conducted through the coupling of the JOREK and STARWALL codes [22]. In this paper, the effects of a resistive wall in DIII-D QH-mode will not be discussed, as the wall is far enough from the plasma in this discharge so that the wall effects on MHD instability are not strong [17]. In [17] it was found that the resistive wall is not an essential ingredient to obtain a saturated kink-peeling mode (EHO). Kink-peeling modes which are unstable in the presence of an ideally conducting wall do saturate at a level consistent with experimentally observed amplitudes of the EHO. This indicates that the explanation proposed in [30], that the EHO is a saturated resistive wall mode at marginal stability, is not the only option to explain the occurrence of the EHO. The resistive wall is applied in one of the ITER simulations (see section 5) where the initial equilibrium is close to marginal stability. The time stepping is performed using the fully implicit Crank-Nicolson or Gear’s scheme, so that the size of time steps depends only on the time scale of the instabilities that are simulated. The implicit scheme results in a sparse system of equations, which is iteratively solved with the GMRES method. The diagonal block matrices corresponding to the individual toroidal harmonics are applied as an effective preconditioner, which are solved independently using the direct parallel sparse matrix solver PaStiX [23].
Considering the possibility of operation in ITER with the available input torque and externally imposed 3-D fields, DIII-D QH-mode discharge #145117 is chosen as a starting point of the simulations in this paper. In this discharge the plasma current Ip =1.1MA, the toroidal magnetic field
Bt =1.9T, the neutral beam has been injected in counter current direction at first and then switched to
an increasing power in co-direction, for a relevant ITER-like co-torque level. A 3-D non-axisymmetric (NA) magnetic field perturbation is applied in this discharge in order to add neoclassical toroidal viscous (NTV) torque in addition to the beam torque. The equilibria used in the
4
analysis presented here have been obtained from reconstructions with the EFIT code [24] using the magnetic and profile data for this discharge.
3. Nonlinear simulations with initial experimental equilibrium and modified equilibrium for DIII-D QH-modes
Nonlinear MHD simulations of the DIII-D shot #145117 have been performed with the JOREK code
assuming ideal wall boundary conditions as detailed above. The influence of external 3-D
non-axisymmetric non-resonant magnetic fields and rotations, which are applied in the experiment for this discharge, is not included in the study presented here. From the initial 2-D static equilibrium of EFIT, JOREK reconstructs a new stationary equilibrium with flows by evolving the n=0 toroidal mode to a stationary state. The poloidal plane is discretised with 2D cubic Bezier finite elements, aligned to the initial equilibrium flux surfaces, typically with 96 elements in the radial direction and up to 250 poloidal elements. For an accurate representation of the kink-peeling instabilities at the plasma boundary, the grid is locally refined in the pedestal region and near scrape off layer with a local radial size of 2mm per cubic element. In order to keep the profiles of density and temperature approximately constant in time and similar to the experimental profiles from EFIT, density and temperature diffusion coefficients in JOREK are chosen. The perpendicular particle diffusion and perpendicular and parallel heat conductivity are set to 𝐷⊥= 2.1𝑚2𝑠−1, 𝜅⊥= 2.1𝑚2𝑠−1 and 𝜅//=1 × 109𝑚2𝑠−1. To represent the H-mode transport barrier, a local minimum in the profile of the
diffusion coefficients is applied to preserve the gradients. The diffusivities in the pedestal are set to 𝐷⊥𝑝𝑒𝑑= 0.08𝐷⊥, 𝜅⊥𝑝𝑒𝑑 = 0.25𝜅⊥. Particle and heating sources are applied to keep the total energy and particle constant in the stationary state without MHD activity. (The applied heating source and consequently the transport coefficients in the simulation are a factor of 2 higher compared to the experiment, the amplitude of the particle source is difficult to evaluate in the experiment). After reaching the stationary equilibrium for n=0 with consistent profiles and flows, the n>0 toroidal modes are included in the simulation.
In the simulation including low-n toroidal harmonics (n=0-5), KPMs have been found to be unstable and grow to a saturated level in the edge of the plasma [17]. The time evolution of the local density fluctuation at normalized poloidal flux ψ=0.95 at the outer mid-plane due to the n=1-5 KPM in the saturation phase, and the corresponding mode spectrum of the plasma density is shown in Figure 1. The evolution of the density shows non-sinusoidal oscillations containing n=1-5 coupled toroidal modes. The spectrum, colored by the amplitude of the density perturbation, shows that the n=1 mode has the largest amplitude. The frequency of the n=1 harmonic is ~1.4 kHz. The ratio of the frequency between different toroidal modes is constant, consistent with experimental measurements. This indicates a toroidal coupling of the harmonics to form a single toroidally localized structure with a dominant n=1 mode number. The features of the dominant saturated KPM including toroidal localization, displacement at mid-plane, detailed in Ref [17], are in good agreement with the
5
observations of the EHO typically present in DIII-D QH-mode experiments. Figure 1 shows the evolution of density fluctuations during the saturation phase from 6ms to 13ms. However the simulation has been continued much longer time, which shows that the saturation phase can be sustained in a stationary way. The EHO oscillations can be observed in all simulated variables, including magnetic field perturbations outside the separatrix.
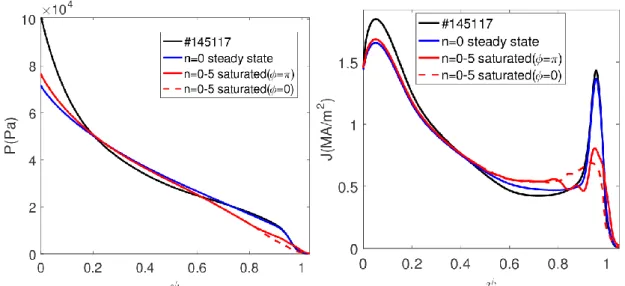
Once the plasma is in the QH-mode regime, ELMs will not occur due to the loss of both edge current density and pedestal pressure caused by the KPM. Figure 2 shows the pressure profiles (a) and current density profiles (b) in the saturation phase. Both the pressure and the current density at pedestal are reduced by ~50% loss due to the losses of density at pedestal caused by E×B flows of the saturated KPM. This makes the plasma move further away from the type-I ELM MHD stability boundary. Both the nonlinear study presented here and the linear analysis from different codes [25] indicate that the plasma, with a high edge current density, lies closer to the kink-peeling stability limit than the ballooning limit. This leads to the growth and saturation of the KPMs rather than an ELM type instability.
Figure 1. Density fluctuation due to the kink-peeling mode (EHO) at the outer mid-plane during the
saturation phase 6ms-13ms from the non-linear MHD simulation.
Figure 2. Profiles of pressure (a) and current density (b) before and during the KPM saturation
6
However, the question of what causes the plasma to develop into a QH-mode regime with a saturated EHO instead of an ELMy H-mode regime is not completely understood. To understand the physics mechanisms of the saturation of KPM and the appearance of the EHO in DIII-D QH-modes, the non-linear MHD simulations have been extended to include toroidal modes typical for both KPMs and ballooning modes. Two cases are considered, one case with toroidal mode numbers n from 0 to 10, and another case with mode numbers from n=0 to 20 but keeping only the even toroidal mode numbers (to reduce the computational time). This can be justified by the experimental observation that in case of a dominant n=2 mode only the even modes are coupled to form a toroidally localised structure. The first initial condition considered corresponds to the experimental data of discharge #145117, close to the kink-peeling stability limit. A second equilibrium [26] is constructed with an increased pedestal pressure and reduced edge current bringing the pedestal close to the ballooning mode stability limit (detailed below).
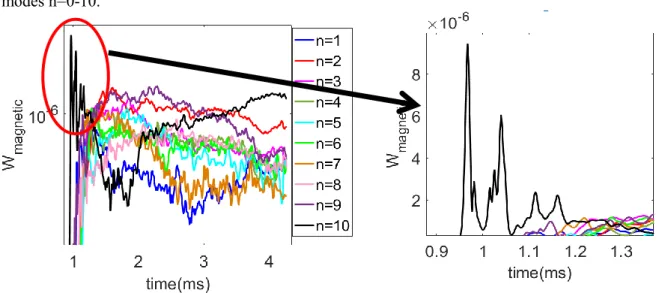
Figure 3. Time evolution of the perturbed magnetic energy in arbitrary units for toroidal modes
n=1-10 at the linear growth phase (a) and at the saturation phase (b) for the original (experimental) #145117 plasma equilibrium..
Figure 3 shows the time evolution of the perturbation of the magnetic energy for each of the toroidal modes n=1-10 from the JOREK simulation of the original DIII-D equilibrium from the linear growth phase (a) to the saturation phase (b). The magnetic energy for each toroidal harmonic is defined as the integral over the poloidal area in the computational domain of the square of the poloidal magnetic field perturbation 𝑊𝑚𝑎𝑔,𝑛 = ∫ |∇𝜓𝑛|2⁄𝑅𝑑𝐴. The linear growth phase, from time 0.8ms to 1.2ms, in
Figure 3(a) is dominated by the highest toroidal mode number n=10. Due to non-linear coupling with the modes n=5-10, the growth of the modes n=1-4 is non-linearly excited later from 1.0ms onwards [27]. In the saturation phase, the magnetic energy perturbation of n=1-3 has a much higher level than that of n=4-10 modes and that, particularly the n=2 mode dominates in this phase. The amplitude of the high-n harmonics quickly decays to a low level once the system reaches a stationary state.
7
The density profiles for two toroidal phases (𝜙 = 0, π) in the stationary state for n=0-10 modes together with that of the stationary JOREK equilibrium state (n=0, blue curve) are shown in Figure 4, compared with the initial experimental density profile (black curve). In the presence of dominant KPMs and residual ballooning modes the density decreases by more than 30% at the pedestal. The different density profiles at different toroidal phases also indicate that the density has an oscillation at the edge of the plasma with a radial displacement of the maximum gradient in the pedestal of about 1.5cm. Figure 5 shows the 3D helical, toroidally localised, structure of the density perturbation on the surface of the plasma boundary (corresponding to ψ=1.0).
Figure 4. Density profiles for n = [0-10] during the saturation phase at t=3.0ms.
Figure 5. 3-D helical structure of the density perturbation for the saturated n=1-10 modes at the separatrix from the JOREK simulation at t=3.0ms.
To verify the convergence with higher toroidal mode numbers, the simulation is repeated with the toroidal mode numbers n=0-20, keeping only the even numbers modes. The evolution of the magnetic energies is shown in Fig. 6. Also in this case, in the linear growth phase the highest toroidal mode (here n=20) has the largest growth rate. This leads to an initial short burst of 36 s of this n=20 mode during which no significant plasma energy is lost. However, as in the n=0-10 case, the non-linear
8
mode coupling leads to a fast growth of the lower n modes. This leads to a saturation phase with n=2-6 as the dominant toroidal harmonics. The modes n=14-20 then decay to a low amplitude in the saturation phase. Therefore, although in the linear phase the mode with the largest growth rate depends on the highest mode number included in the simulation, this does not change the physics of the non-linear saturation phase. The mode numbers in the saturation phase are determined by the nonlinear mode coupling, leading to the fast growth of the low-n toroidal harmonics. These low-n modes then saturate into a quasi-stationary state.
Figure 6. Time evolution of the perturbed magnetic energy of even number modes n=2-20 at the
saturation phase for the simulation of #145117.
Figure 7. Linear ideal MHD stability diagram of the pedestal plasma in DIII-D QH-modes. The blue
star represents the equilibrium of the DIII-D QH-mode plasma #145117, the red star is the modified equilibrium with lower edge current and higher pedestal pressure. The colour code indicates the
toroidal mode number of the most unstable mode.
According to MHD theory, high edge current drives KPMs unstable whereas a high gradient of pressure at pedestal drives unstable ballooning modes. The MHD linear ideal stability analysis of the pedestal plasma indicates that QH-mode plasmas in the presence of the EHO are usually in a stable region but close to the current driven kink/peeling stability boundary. For the discharge #145117, the analysis of KPM stability at the pedestal has been performed with the linear ideal MHD code MISHKA-1 [28], see Figure 7. For the calculation of the edge stability diagram, a set of equilibria has
9
been constructed where the pedestal current and pedestal pressure are independently varied while keeping the total current and total thermal plasma energy constant. For each equilibrium, the growth rate is calculated for toroidal mode from n=1 to n=40. At each point, the mode with largest growth rate is plotted in the diagram. The stability diagram for discharge #145117 in Figure 7 shows that the experimental plasma, represented by the blue star, is in the stable region but close to the kink/peeling stability boundary, consistent with previous analyses of other QH-mode plasmas.
For further understanding of what causes the plasma to develop either into a QH-mode regime with a saturated KPM (EHO) or into a regime with ELMs, a new equilibrium (red star in Figure 7) is constructed with lower edge current and high pedestal pressure lying closer to ballooning stability limit than the KPM stability limit. The pedestal pressure is increased by decreasing the diffusivities at pedestal to 𝐷⊥𝑝𝑒𝑑 = 0.01𝐷⊥ and 𝜅⊥𝑝𝑒𝑑 = 0.03𝜅⊥. In the new stationary equilibrium, see Figure 8(a), the edge current density profile has been reduced by 30% (red curve) compared with the experimental equilibrium current density of the DIII-D QH-mode plasma #145117 (black curve). The pressure at the top of the pedestal (red curve) is increased about 40% compared with the experimental equilibrium pressure profile of plasma #145117 (black curve), as shown in Figure 8(b).
Figure 8. (a) Current profiles and (b) pressure profiles; Initial equilibrium profile of the experimental
plasma (black curve) and of the modified equilibrium (red curve).
The time evolution of the magnetic energy for the toroidal modes n=1-10 for the modified equilibrium with lower edge current and higher pressure pedestal during the linear growth phase is similar to that of the simulation with the experimental equilibrium, with high-n modes having the largest growth rates and dominating the linear growth phase. Figure 9 shows the time evolution of the magnetic energy perturbations. Early in the nonlinear phase, a strong ELM-like behavior is observed due to the n=10 mode with a large amplitude, occurring in multiple bursts. The duration of this bursty phase is about 250 s, which is typical for an ELM event. From 1.2 ms onwards, the n=10 ballooning mode decays to a low level, similar to the simulation of the experimental equilibrium. The state after the
10
ELM is dominated by an n=9 mode while n=2 becomes the secondary mode. After a longer time evolution, the amplitude of the energy of the n=10 ballooning mode slowly rises and dominates the stationary system. As could be expected, the larger pedestal pressure and lower edge current are the factors which push the plasma towards to the ballooning stability limit and this is reflected in the harmonic composition of the saturated modes. The density oscillation at the edge of plasma and pedestal loss is shown in Figure 10 at different toroidal phases. Note that here the density loss at the pedestal is smaller than that in the simulation of the experimental plasma conditions due to the increase of the density source which is added to obtain a higher pedestal pressure equilibrium.
The results of the simulation of the modified equilibrium including even number toroidal modes between n=0-20 is shown in Figure 11. The initial burst around t=1ms occurs again for the highest toroidal mode number included. Up to 2.5ms there is no clear dominant toroidal harmonic but on a longer timescale the mode n=10 becomes dominant, consistent with the simulation including only the modes n=0-10.
Figure 9. Time evolution of the perturbed magnetic energy of toroidal modes n=1-10 during the
saturation phase for the simulation of the modified equilibrium plasma with lower edge current and higher pedestal pressure.
11
Figure 11. Time evolution of the perturbed magnetic energy of even number modes n=2-20 in the
saturation phase for the simulation of the modified equilibrium with lower edge current and higher pedestal pressure.
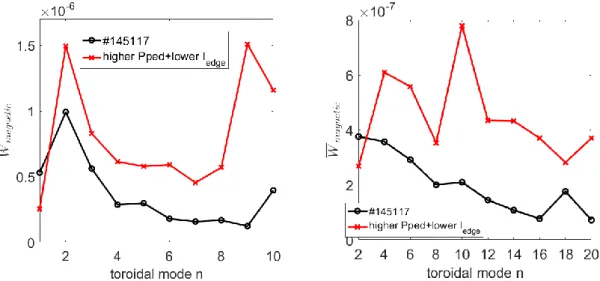
For a more direct comparison of the saturated state of these two equilibria, the DIII-D QH-mode plasma #145117 and the modified equilibrium with lower edge current and higher pedestal pressure, the time averaged magnetic energies during the saturation phase of the modes n=1-10 and the even number modes n=2-20 are shown in Figure 12(a) and (b). The black curve in Figure 12(a), showing the energies averaged between 1.5ms and 5.4ms, indicates that for the DIII-D QH-mode plasma the magnetic energies of the low-n modes clearly have a higher level compared to higher number modes n≥5; in particular the n=2 mode dominates in the saturation phase. This is characteristic for an EHO, i.e. a saturated low-n KPM, in a QH-mode plasma. For the plasma with lower edge current and higher pedestal pressure (red curve), for which the energies are averaged between 1.5ms and 4.2ms, both the low number mode n=2 and intermediate numbers mode n=(9, 10) have a high level of magnetic energy. In this case, both low-n (EHO) mode and intermediate number mode (ballooning modes) have similar intensities but the intermediate number ballooning mode dominates the MHD behaviour. Considering the even modes between n=0-20 a comparable behaviour to the equivalent n=0-10 cases is obtained. In the experimental equilibrium, the saturation phase is dominated by low-n KPMs whereas at higher pressure gradient and lower edge current, an additional medium-n mode (n=10) appears, dominating the saturation phase. For both cases, the contributions of the toroidal modes n>10 are not significant.
12
Figure 12. Time-averaged perturbed magnetic energy of toroidal modes n=1-10(a) and even number
modes n=2-10 (b) for the experimental equilibrium of #145117 and for the modified equilibrium with higher pedestal pressure and lower pedestal current.
4. Effect of E×B rotation on the MHD modes stability on DIII-D QH-modes
To study the influence of the E×B rotation in the pedestal, the rotation profile has been modified to have different speeds at the edge of the plasma relative to the experimental QH-mode plasma #145117. In the JOREK code, the rotation has been changed by adding an additional rotation source in the perpendicular momentum equation with the following radial profile: 𝑆𝑉𝐸×𝐵(𝜓𝑁) = −2𝑆
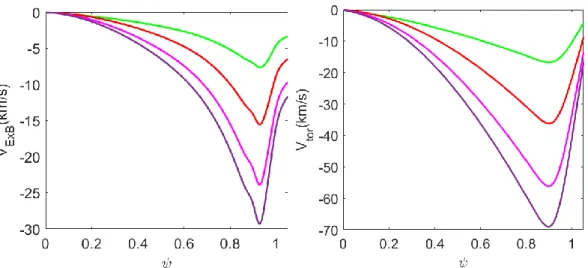
𝜎2(𝜓𝑁− 𝜓𝑝𝑒𝑑)𝑒−((𝜓𝑁−𝜓𝑝𝑒𝑑) 𝜎⁄ )2, where S and 𝜎 control the maximum value and width of the E×B rotation at pedestal, 𝜓𝑝𝑒𝑑 is the normalised poloidal flux at the top of the pedestal, 𝜓𝑝𝑒𝑑=0.93. Note that the work presented here is a first investigation of the influence of E×B rotation and not aimed to fully match the experimental rotation profiles, in particular in the core of the plasma. Diamagnetic rotation is not considered in these simulations either. Stationary equilibria with different E×B rotation are obtained by evolving the n=0 toroidal harmonic in time to steady state. The nonlinear MHD simulations include the toroidal modes n=1-10, which represent both low-n KPMs and intermediate n ballooning modes, for five different E×B rotation speeds, ranging from 0 km/s to 29 km/s, at the edge of plasma. The highest E×B velocity considered is about 60% of the maximum E×B rotation speed measured in the discharge #145117. The profiles of rotation with maximum edge rotation speed 8km/s, 16km/s, 24km/s and 29km/s are shown in Figure 13(a), consequently with four different profiles of rotation shear in the pedestal region. The corresponding toroidal rotation profiles in the stationary equilibrium are shown in Figure 13 (b).
13
Figure 13. Profiles of 𝑉𝐸×𝐵 rotation (a) and toroidal rotation (b) with different rotation speeds at the
edge of the plasma in the equilibria modelled with JOREK.
Figure 14. (a) Time evolution of the perturbed magnetic energy of toroidal modes n=1-10 with edge
E×B speed 𝑉𝐸×𝐵=24km/s; (b) Contour plot of flux for the perturbation of n=1-10 modes in the poloidal plane (separatrix in black) during the saturation phase of the simulation with edge E×B
speed 𝑉𝐸×𝐵= 24𝑘𝑚/𝑠.
14
Figure 15. KPM rotation frequency in the poloidal plane in the counter clockwise direction vs. edge
E×B speed.
Figure 14(a) shows the time evolution of the perturbed magnetic energy of the toroidal modes n=1-10 with an edge E×B speed 𝑉𝐸×𝐵= 24𝑘𝑚/𝑠 from the linear growing phase to stationary state. With this E×B equilibrium flow in the pedestal, the n=2 KPM starts to grow earliest at time 1.6ms and grows strongest, dominating the linear growth phase until it reaches a saturated state. The n=3 mode has a smaller growth rate. Due to the nonlinear coupling, the n=1 and n=4 harmonics grow nonlinearly with the remaining modes starting later and then grow non-linearly with a large growth rate. Note that this is different from the case with zero E×B rotation shown in Figure 4(a) where the high-n (n=10) mode dominates the linear growing phase with strongest linear growth rate and the low-n modes have nonlinear growth due to the nonlinear coupling with the high-n modes. After 3ms the plasma enters a stationary state, with a dominant n=2 KPM mode. The coupling with the sideband harmonics (n=4,6,8), i.e. multiples of the base harmonic n=2, forms a toroidally localised structure, typical of the EHO, similar to the n=1 case without E×B rotation in section 3. The odd harmonics are not coupled to the even modes and remain at a smaller amplitude.
A contour plot of the flux for the perturbation of toroidal modes n=1-10 with edge E×B speed 𝑉𝐸×𝐵 = 24𝑘𝑚/𝑠 in the poloidal plane during the stationary state in Figure 14(b) shows the structure
of the non-linearly saturated KPM localized near the separatrix. The saturated KPM rotates in the counter clockwise poloidal direction due to E×B flow with a frequency of 5.9kHz. The edge E×B speed increases about 30% to 31km/s due the presence of the KPM itself. Even in the simulation without E×B rotation source, the E×B rotation is increased, driven by the Maxwell stress due to the magnetic perturbation of the MHD instability. Figure 15 shows the saturated mode rotation frequency versus the edge E×B rotation speed in the stationary phase of the KPM: higher E×B rotation drives a higher MHD mode rotation frequency in the poloidal direction.
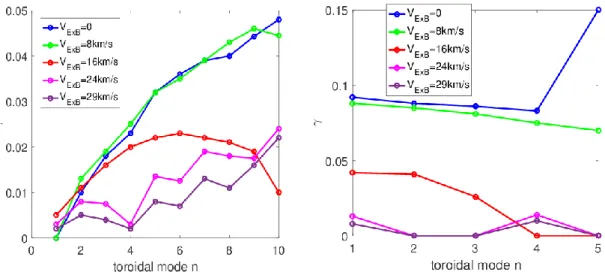
The linear growth rate of each toroidal harmonic from n=1 to 10 during the linear growth phase for five cases with different E×B rotation is shown in Figure 16(a). The growth rates are normalised with √𝜇0𝜌0, where 𝜌0 is the mass density at the magnetic axis. It is found that the equilibrium E×B
rotation strongly stabilizes the linear growth of toroidal modes for n>2. However, the linear growth of n=1 and n=2 increase with increasing E×B rotation but decrease again at the highest E×B rotation considered, in agreement with [25]. It is notable that the linear growth rate of high-n modes increases again when the E×B edge rotation speed is increased above 24km/s, which implies that the high n modes in the plasma may possibly become unstable again for higher edge E×B rotation speeds than we present in this paper. The non-linear growth rate of the magnetic energy for the n=1-5 modes with different E×B rotation speeds at the edge, shown in Figure 16(b), indicates that the E×B rotation strongly stabilizes the non-linear growth of low-n modes n=1-5. The non-linear growth rates are defined here as the exponential growth rate of the toroidal harmonics due to the toroidal coupling with other toroidal harmonics. For example, in figure 14a, the growth rate of the n=1 mode increases
15
significantly at t=2.5ms when the origin of the growth rate changes from the linear MHD instability to the non-linear coupling of the higher-n harmonics.
The time-averaged magnetic energies in the nonlinear saturation phase of the modes n=1-10 with different edge E×B rotation speeds are plotted in Figure 17(a). This figure shows that also in the saturation phase, the n>2 modes are strongly reduced by the E×B flow (or flow shear). At the highest rotation rates, also the saturation level of the n=2 mode is reduced by the flow. With increasing edge E×B rotation speed, the loss of density in the pedestal due to the MHD, see Figure 17(b), is reduced due to the reduced saturation amplitude of the KPM (EHO). Consequently, the pressure profile has less pedestal loss and a smaller oscillation at the edge of plasma as the temperature is not affected much by the KPMs.
These JOREK simulations show that E×B rotation has strong stabilization influence on high-n modes but destabilizes the n=2 mode in both the linear growth phase and the non-linear saturation phase and can sustain the plasma in QH-mode regime. In addition, the particle transport at the pedestal is reduced by the increase of edge E×B rotation speed. In these simulations the influence of toroidal rotation, diamagnetic rotation and the wall effects and RMPs are not included. Adding these effects remains to be done for future studies in order to fully understand the influence of rotation on edge MHD plasma stability in DIII-D QH-modes.
Figure 16. (a) Linear growth rate of toroidal modes n=1-10 with different 𝑉𝐸×𝐵 rotation speed at the
edge of the plasma. (b) non-linear growth rate of toroidal modes n=1-5 with different 𝑉𝐸×𝐵 rotation speed at the edge of the plasma. The growth rate 𝛾 is normalized by √𝜇0𝜌0 .
16
Figure 17. (a) Time-averaged magnetic energy of each mode n=1-10 through the stationary phase for
different edge 𝑉𝐸×𝐵 speeds; (b) density profiles in the saturation phase with different edge 𝑉𝐸×𝐵 speeds for simulations including modes n=0-10 at toroidal phase 𝜙 =0.
5. JOREK simulations of QH-modes in ITER high Q plasmas
The low-n stability of an ITER Q=10 baseline scenario with a plasma current I=15MA, magnetic field B=5.3T, major radius R=6.2m, minor radius a=2.0m has been analyzed with respect to the access to a possible QH-mode regime. The equilibrium of this ITER plasma has been generated by CORSICA [29]. Preliminary results of the simulations including toroidal harmonics n=0-1 and the ITER resistive wall (the vacuum vessel) by using the JOREK-STARWALL codes [20] have been obtained. The STARWALL code solves for the magnetic fields in the vacuum region and currents in the (thin) resistive wall. This solution provides the boundary conditions for the magnetic field in JOREK. The equilibrium with a pedestal pressure of 120kPa is unstable to a slow growing n=1 KPM with a growth rate ~1 ms-1 when a realistic wall resistivity of η=1.0×10⁻⁶ Ωm is used. The growth rate of the mode
increases with increasing wall resistivity, i.e. in this case the instability can also be identified as a resistive wall mode [30]. The resistive wall is more important in this particular case because the initial equilibrium is ideal MHD stable in the presence of a ideally conducting wall. In the non-linear phase, the KPM saturates into a quasi-stationary state with a relatively small amplitude density oscillation caused by a displacement of the flux surface at the plasma boundary of ~1cm. The plasma density at the separatrix and the resistive wall coloured by the current potential level during the saturation phase of the n=1 mode show the characteristic KPM structure localized at the edge of plasma as shown in Figure 18(a). After the EHO characteristics have been obtained in the JOREK simulation with n=0-1 toroidal harmonics, simulations have been carried out including more toroidal harmonics n=0-5 but with an ideally conducting wall. Figure 18(b) shows the time evolution of the magnetic energy perturbation for n=1-5 modes for the simulation of ITER Q=10 plasma. There is an initial exponential growth phase of MHD modes in the time evolution of the magnetic energy which lasts from 2ms to 7ms dominated by the medium-n mode (n=4). The modes n=1-3 start growing later at 10ms with an
17
exponential growth 10 times stronger than other modes due to non-linear coupling. After the plasma saturates into a 3-D stationary state, the dominant modes of the MHD instability are still the n=4 and 5 modes. The non-linear growth of the low-n modes (n = 1, 2), as found for the DIII-D QH-mode equilibrium without E×B flows, does not appear to be relevant in this case.
Thus, the saturated kink-peeling modes, characteristic of the EHO in QH-modes, have been found in the ITER simulations. However the saturation amplitude is relatively small compared to the DIII-D mode case. Further studies are required to determine whether the presence of an EHO and QH-mode operation is compatible with ITER Q=10 scenarios; notably extending the n=0-5 simulations to include a resistive wall, as the interaction with the wall appears to be more significant in the ITER scenario analysed here compared to DIII-D. The larger influence of the resistive wall in this ITER case is likely due to the assumed initial equilibrium being close to marginal stability in presence of an ideally conducting wall.
Figure 18. (a) 3-D density structure at the separatrix and resistive wall potential of an n=1 saturated KPM in an ITER Q=10 plasma. (b) Time evolution of the perturbed magnetic energy for the n=1-5
modes for an ITER Q=10 plasma. 6. Conclusions
To study the onset and saturation physics mechanism of the edge harmonic oscillation (EHO) in the QH-mode, with the long-term goal to determine if the QH-mode can be an option for operation in future devices such as ITER, non-linear MHD simulations of DIII-D QH-mode plasmas have been carried out with the code JOREK. The EHO, identified as a saturated kink-peeling mode, is an essential ingredient to obtain the QH-mode. The influence of different physics aspects (edge current density, pedestal pressure and E×B rotation) on the growth and saturation of the kink-peeling modes in QH-mode plasmas has been evaluated. Simulations with initial DIII-D experimental data, not including plasma rotation, show that the plasma develops a saturated n=1 kink-peeling mode which can be identified as the EHO in QH-mode plasmas. The reduction of edge current density and of the pedestal pressure caused by the KPMs sustain the plasma in the kink-peeling marginally stable regime
18
thus avoiding the occurrence of ELMs. In the simulation including n=0-10 toroidal modes, the high-n harmonics, associated with ballooning modes, have the largest linear growth rate and dominate in the linear phase. After an initial burst due to the high-n harmonics, the plasma non-linearly saturates into a new 3-D stationary phase dominated by low-n harmonics associated with KPMs. In this case, the low-n modes are non-linearly driven by toroidal mode coupling. The saturated KPMs lead to oscillations in the edge plasma density with the typical multi-harmonic content associated with the EHO in QH-mode plasmas observed experimentally in magnetics and fast reflectometer measurements. Variation of the pedestal profiles of the initial equilibria has shown that at increased pedestal pressure and lower pedestal current, the saturated state of the EHO with low-n KPMs does not develop. Instead, there is an initial ELM-like event followed by a stationary phase in which ballooning modes represented by medium-n modes n=9-10 dominate over the KPMs/EHO. This suggests that sufficient edge plasma current is required for driving unstable/saturate an EHO and to obtain a stationary QH-mode. Lower plasma edge current levels with higher pedestal pressures drive the plasma into ballooning instability, i.e. into the ELMy H-mode domain.
The non-linear MHD simulations with different E×B rotation speed at the edge of QH-mode plasma indicated that E×B rotation strongly stabilizes high-n modes but destabilizes low-n modes particularly the n=2 mode in the linear growth phase, which is consistent with some experimental observations and linear MHD modelling [25]. In this case, the linearly most unstable mode (n=2) also dominates the nonlinear saturation phase. All the other modes are strongly stabilized, which causes less density pedestal loss and a smaller plasma displacement at the outer mid-plane during the stationary phase. The simulation results suggest that E×B rotation plays an important role from the linear growth phase through to the KPM/EHO stationary state by destabilizing the toroidal mode n=2 but stabilizing high-n modes (high-n>5). Ihigh-n additiohigh-n, with ihigh-ncreasihigh-ng E×B rotatiohigh-n the particle loss at the pedestal due to the KPM mode is reduced due to a reduction of the amplitude of the saturated KPM with increasing E×B flow.
Initial JOREK simulation results of ITER Q=10 plasmas show that the pedestal currents due to the bootstrap current are large enough to destabilise low-n kink-peeling modes. These modes saturate non-linearly into a 3D stationary state with an edge harmonic oscillation. However, a smaller mode amplitude (in dimensionless units) and, consequently, less density loss at the edge of ITER plasma is found during the saturated state as compared to the modelling for DIII-D QH-mode plasmas. One of the remaining question is what the minimum amplitude the EHO must have to obtain a QH-mode regime. The EHO induced density losses must be large enough to saturate the pedestal pressure to avoid the occurrence of ELMs. Further studies including more physics effects such as diamagnetic and neoclassical flows and a resistive wall together with detailed validation of the simulation results with experiments are needed to improve the predictive capability towards ITER.
19 Acknowledgements
This work is supported by ITER and the US DOE under contract DE-FC02-04ER54698. The main author would like to thank R. Groebner, K.H. Burrell, T.H. Osborne and X. Chen for very helpful discussions. The DIII-D data shown in this paper can be obtained in digital format by following the links at ttps://fusion.gat.com/global/D3D_DMP.
ITER is the Nuclear Facility INB no. 174. The views and opinions expressed herein do not necessarily reflect those of the ITER Organization.
20 References
[1] Loarte A. et al., 2003 Plasma Phys. Control. Fusion 45 1549 [2] Bazylev B. et al., 2007 Phys. Scr. T128 229–33
[3] Becoulet M. et al., 2012 Nucl. Fusion 52 054003 [4] Futatani S. et al., 2014 Nucl. Fusion 54 073008 [5] Lang P. T. et al., 2008 Nucl. Fusion 48 095007 [6] Evans T.E. et al., 2013 Nucl. Fusion 53 093029 [7] Baylor L.R. et al., 2007 Nucl. Fusion 47 1598
[8] Suttrop W. et al., 2011 Phys. Rev. Lett. 106, 225004. [9] Liang L. et al 2007 Plasma Phys. Control. Fusion 49 B581 [10] Burrell K.H. et al 1999 Bull. Am. Phys. Soc. 44 127 [11] Snyder P.B. et al 2007 Nucl. Fusion 47 961
[12] Burrell K. H. et al 2001 Phys. Plasmas 8, 2153. [13] Burrell K.H. et al 2009 Nucl. Fusion 49 085024 [14] Burrell K.H. 2013 Nucl. Fusion 53 073038 [15] Garofalo A.M. et al 2011 Nucl. Fus. 51 083018 [16] Solomon W. et al 2014, Phys. Rev. Lett. 113 135001 [17] Liu F. et al 2015 Nucl. Fusion 55 113002
[18] Huysmans G.T.A. et al 2007 Nucl. Fusion. 47 659
[19] Huysmans G.T.A. et al 2009 Plasma Phys. Control. Fusion 51 124012 [20]Czarny O. and Huysmans G. 2008 J. Comput. Phys. 227 7423–45 [21] Stangeby P.C. et al 1995 Phys. Plasmas 2 (3) 707
[22] Hoelzl M. et al., 2012 JPCS 401 012010
[23] Henon P. et al., 2002 Parallel Computing 28 (2) 301–321 [24] Lao L.L. et al., 1990 Nucl. Fusion 30 1035
[25] Chen X. et al., 2016 Nucl. Fusion 56 076011
[26] Liu F. et al., 26th IAEA Fusion Energy Conference 2016, Kyoto, Japan, paper, TH/P1-9 [27] Krebs I. et al 2013 Phys. Plasma 20 082506
[28] Mikhailovskii A. B. et al., 1997. Plasma Physics reports 23(10):844–857. [29] Casper T. et al 2014 Nucl. Fusion 54 013005

![Figure 4. Density profiles for n = [0-10] during the saturation phase at t=3.0ms.](https://thumb-eu.123doks.com/thumbv2/123doknet/13601330.423963/8.892.301.590.348.612/figure-density-profiles-n-saturation-phase-t-ms.webp)