HAL Id: hal-02627409
https://hal.inrae.fr/hal-02627409
Submitted on 26 May 2020
HAL is a multi-disciplinary open access
archive for the deposit and dissemination of
sci-entific research documents, whether they are
pub-lished or not. The documents may come from
teaching and research institutions in France or
abroad, or from public or private research centers.
L’archive ouverte pluridisciplinaire HAL, est
destinée au dépôt et à la diffusion de documents
scientifiques de niveau recherche, publiés ou non,
émanant des établissements d’enseignement et de
recherche français ou étrangers, des laboratoires
publics ou privés.
Distributed under a Creative Commons Attribution - NonCommercial - NoDerivatives| 4.0
Model for Simulating Evapotranspiration of Rainforests
and Oil Palm Plantations in Indonesia
Yuanchao Fan, Ana Meijide, David M. Lawrence, Olivier Roupsard, Kimberly
M. Carlson, Hsin-yi Chen, Alexander Röll, Furong Niu, Alexander Knohl
To cite this version:
Yuanchao Fan, Ana Meijide, David M. Lawrence, Olivier Roupsard, Kimberly M. Carlson, et al..
Reconciling Canopy Interception Parameterization and Rainfall Forcing Frequency in the Community
Land Model for Simulating Evapotranspiration of Rainforests and Oil Palm Plantations in Indonesia.
Journal of Advances in Modeling Earth Systems, American Geophysical Union, 2019, 11 (3),
pp.732-751. �10.1029/2018MS001490�. �hal-02627409�
Model for Simulating Evapotranspiration of
Rainforests and Oil Palm Plantations
in Indonesia
Yuanchao Fan1,2 , Ana Meijide1,3 , David M. Lawrence4 , Olivier Roupsard5,6 , Kimberly M. Carlson7 , Hsin‐Yi Chen7, Alexander Röll8 , Furong Niu8,9, and Alexander Knohl1,10
1Bioclimatology, University of Göttingen, Göttingen, Germany,2NORCE Norwegian Research Centre, Bjerknes Centre
for Climate Research, Bergen, Norway,3Department of Crop Sciences, Division Agronomy, University of Göttingen,
Göttingen, Germany,4National Center for Atmospheric Research, Boulder, CO, USA,5CIRAD, UMR Eco&Sols: LMI IESOL, Dakar, Senegal,6Eco&Sols, Université de Montpellier, CIRAD, INRA, IRD, Montpellier SupAgro, Montpellier,
France,7Department of Natural Resources and Environmental Management, University of Hawaii at Mānoa, Honolulu, HI, USA,8Tropical Silviculture and Forest Ecology, University of Göttingen, Göttingen, Germany,9School of Natural
Resources and the Environment, University of Arizona, Tucson, AZ, USA,10Centre of Biodiversity and Sustainable Land Use (CBL), University of Göttingen, Göttingen, Germany
Abstract
By mediating evapotranspiration processes, plant canopies play an important role in the terrestrial water cycle and regional climate. Substantial uncertainties exist in modeling canopy water interception and related hydrological processes due to rainfall forcing frequency selection and varying canopy traits. Here we design a new time interpolation method“zero” to better represent convective‐type precipitation in tropical regions. We also implement and recalibrate plant functional type‐specific interception parameters for rainforests and oil palm plantations, where oil palms express higher water interception capacity than forests, using the Community Land Model (CLM) versions 4.5 and 5.0 with CLM‐Palm embedded. Reconciling the interception scheme with realistic precipitation forcing produces more accurate canopy evaporation and transpiration for both plant functional types, which in turn improves simulated evapotranspiration and energy partitioning when benchmarked against observations from our study sites in Indonesia and an extensive literature review. Regional simulations forSumatra and Kalimantan show that industrial oil palm plantations have 18–27% higher transpiration and 15–20% higher evapotranspiration than forests on an annual regional average basis across different ages or successional stages, even though the forests experience higher average precipitation
according to reanalysis data. Our land‐only modeling results indicate that current oil palm plantations in Sumatra and Kalimantan use 15–20% more water (mean 220 mm or 20 Gt) per year compared to lowland rainforests of the same extent. The extra water use by oil palm reduces soil moisture and runoff that could affect ecosystem services such as productivity of staple crops and availability of drinking water in rural areas.
Plain Language Summary
This manuscript addresses two issues in modeling canopy rainfall interception and associated water cycle processes in the Community Land Model and applies the model development to simulate a rainforest to oil palm transformation system. First, interpolating precipitation data from a coarser input frequency (e.g., three‐hourly or six‐hourly) to a finer model timescale (half‐hourly) with a nearest time method would introduce unrealistic rain events and bias the water cycle simulation for regions with convective‐type (short and intense) precipitation. Second, different canopy structures and leaf and stem morphologies, such as those of oil palm and rainforest, offer different water interception capacities, which questions the validity of a uniform interception parameterization across plant types used in land surface models. We design a new time interpolation method and implement plant type‐specific interception parameters in the Community Land Model, which produce more realistic precipitation events for tropical climate and predict more accurate canopy evaporation and transpiration for both oil palm and forest compared to observation. Results from our improved modeling approach indicate that current©2019. The Authors.
This is an open access article under the terms of the Creative Commons Attribution‐NonCommercial‐NoDerivs License, which permits use and distri-bution in any medium, provided the original work is properly cited, the use is non‐commercial and no modifica-tions or adaptamodifica-tions are made. Key Points:
• We design a new time interpolation method“zero” to better represent convective‐type precipitation in tropical regions
• Using PFT‐specific interception parameters improves simulated partitioning of evapotranspiration for both oil palm and forest • Current oil palm plantations in
Sumatra and Kalimantan use 15–20% more water (211–238 mm) per year compared to lowland rainforests Supporting Information: • Supporting Information S1 Correspondence to: Y. Fan, yufa@norceresearch.no; yfan1@uni-goettingen.de Citation:
Fan, Y., Meijide, A., Lawrence, D. M., Roupsard, O., Carlson, K. M., Chen, H.‐Y., et al. (2019). Reconciling canopy interception parameterization and rainfall forcing frequency in the Community Land Model for simulating evapotranspiration of rainforests and oil palm plantations in Indonesia. Journal of Advances in Modeling Earth Systems, 11, 732–751. https://doi.org/ 10.1029/2018MS001490
Received 31 AUG 2018 Accepted 14 FEB 2019
Accepted article online 18 FEB 2019 Published online 15 MAR 2019
industrial oil palm plantations in Sumatra and Kalimantan (Indonesia) increase water use and reduce soil moisture and surface and subsurface runoffs, which could affect ecosystem services that rely on soil water reserve and river discharge.
1. Introduction
Vegetation cover heterogeneity and dynamics and their interaction with soil, water, and the atmosphere are a key regulator of regional climate. By partitioning waterfluxes and redistributing energy, plant canopies play a central role in biophysical processes (Bonan, 2008). While transpiration through leaf stomata is a sig-nificant component of the terrestrial water cycle (Alton et al., 2009; Gerten et al., 2005; Lawrence et al., 2007; Schlesinger & Jasechko, 2014), the large cumulative surface area of vegetation leaves and stems is important for intercepting precipitation and partitioning it into evaporation and water available for runoff and infiltra-tion at a continental scale (Crockford & Richardson, 2000; Miralles et al., 2010; Miralles et al., 2011). Precipitation intercepted on wet foliage also influences stomata opening and thus affects transpiration (Lawrence et al., 2007). Therefore, correct parameterization of canopy interception and related hydrological processes in land‐surface modeling schemes is important for accurately estimating the components of eva-potranspiration (ET) and the leaf‐energy balance and thus surface temperature.
Interception efficiency (fpimx, supporting information Text S1, equation S1 or S7) and interception sto-rage capacity (dewmx, supporting information Text S1, equation S3) are two key parameters used to simulate canopy interception in land surface models. Thefirst parameter fpimx is the fraction of precipi-tation intercepted by the canopy per unit time as a function of plant area; this fraction is negatively cor-related with throughfall rate (Lawrence et al., 2007). The second parameter dewmx is the maximum thickness of the waterfilm on plant surfaces, which is often used to represent the storage capacity of intercepted precipitation. Yet these two parameters are subject to considerable uncertainty because mea-surements of interception rates and stores for different canopy types are extremely scarce for inferring fpimxand dewmx. They depend on the effect of forest type, canopy structure and climate on interception, stemflow, and throughfall (Crockford & Richardson, 2000), which are currently not well represented in most land surface models (de Kauwe et al., 2013). For example, Wang et al. (2007) found that the Community Land Model version 3 (CLM3) significantly overestimated the annual rainfall interception ratio for tropical areas (18–70% simulated vs. 16–42% observed). In contrast, de Kauwe et al. (2013) reported that a later version of CLM (CLM4) underestimated rainfall interception for temperate forest and tree plantation sites (3.5–5.1% simulated vs. 16–27% observed; Oishi et al., 2008; Schafer et al., 2003). Notably, CLM4 used a much lower fpimx than CLM3 (0.25 vs. 1.0; Lawrence et al., 2007). Like CLM3, the latest CLM version (CLM5) again adopts a higher fpimx. The lack of consistency among dif-ferent versions of CLM reflects the uncertainty in the way rainfall interception is modeled and calibrated. According to observations, rainfall interception is sensitive to varying vegetation type and climate (see literature review in Table 1). However, CLM assumes uniform interception parameters for all plant func-tional types (PFTs), even when different PFTs have distinct leaf morphology and inclination such as nee-dleleaf and broadleaf trees (Oleson et al., 2013). CLM also assumes equal dewmx between leaf and stem surfaces, despite the lack of uniformity in leaf shape, branch angle, and bark characteristics (Lawrence et al., 2007). As a result, leaf area index becomes a mere moderator of canopy hydrology when the PFT‐invariant interception parameters are fixed during a simulation. In this scheme, simply tuning model interception parameters may not resolve mis‐estimation issues in canopy hydrology across land‐ cover types and climate regions.
Even for a particular forest type, modeling canopy interception is challenging due to its dependence on precipitation type (intensity and duration) and other meteorological conditions (e.g., wind speed and direction; Crockford & Richardson, 2000). Precipitation characteristics such as intensity, duration, and diel and seasonal distributions influence the cumulative water interception and canopy evaporation across timescales. Plant canopies have greater potential to intercept rainfall that is continuous, has low intensity, and has small raindrops as compared to rainstorms that are short and intense and have larger drops (Calder, 1996). Land surface models of carbon, water, and energyfluxes often use a half‐hourly timescale (e.g., in CLM). However, the meteorological forcing data used to drive gridded offline land model simulations are usually available only at three‐hourly or six‐hourly timescales. The scale
mismatch between the model time step and the forcing data frequency requires interpolation of forcing data to the half‐hourly model time step. In regions where long‐duration stratiform rainfall events are typical, an appropriate interpolation algorithm for precipitation forcing is the nearest time, which means repeating rainfall rates at each model time step from three‐hourly or six‐hourly input rainfall. This is the default choice in CLM (Oleson et al., 2013). However, for tropical regions that are dominated by short‐duration convective rainfall events, this interpolation may not reproduce the observed rainfall frequency and intensity, which could introduce significant uncertainty to the modeling of canopy interception. A few studies have examined the unwanted sensitivity of interception
Table 1
Literature Review of Rainfall Interception and Evapotranspiration Observations for Rainforests and Oil Palm Plantations
PFT
Variables
Source
IC(% rainfall) ET (mm/day) T(mm/day) ES(mm/day)
BET rainforest 16 4.2 3.3 — Kumagai et al. (2005)
11 — — — Asdak et al. (1998) 16 — — — Vernimmen et al. (2007) 32 — — — Tarigan et al. (2018) 18 — — — Dykes (1997) 22 — — — Manokaran (1980) 17 — — — Sinun et al. (1992) 21 — 2.6 — Calder et al. (1986) 13 3.9 3.1 — Tomasella et al. (2008) 12 3.5 — — da Rocha et al. (2004) 9 — — — Lloyd et al. (1988)
15 — — — Veneklaas and van Ek (1990)
27 — — — Ghimire et al. (2017)
9 — — — Hutjes et al. (1990)
13 — — — Miralles et al. (2010)
17 — — — Jetten (1996)
5 5.2 4.7 0.1 Jordan and Heuveldop (1981)
16 3.7 2.2 — Munoz‐Villers et al. (2012;
montane rainforest 2400 m a.s.l.)
28 4.0 1.6 0.2 McJannet et al. (2007; lowland
rainforest in north Queensland, Australia)
7 2.7 1.0 McJannet et al. (2007; montane rainforest
1560 m a.s.l. in north Queensland, Australia)
— 3.0 — — Takanashi et al. (2005)
— 3.8 — — Shuttleworth (1988)
— 4.0 — — Hodnett et al. (1995)
— 3.1 — — Lesack (1993)
— 2.3 1.6 0.2 Song et al. (2017; subtropical
evergreen forest in China)
— 2.1 1.7 0.3 Kelliher et al. (1992; temperate broad‐leaved
forest in New Zealand)
Mean ± SD 16 ± 7 (n = 20) 3.5 ± 0.9 (n = 13) 2.4 ± 1.1 (n = 9) 0.2 ± 0.1 (n = 4) Average ET partitioning: T 69%, ES6%, EC25% Oil palm plantation
(mature) 26 — — — Tarigan et al. (2018) — 4.7 — — Meijide et al. (2017) — — 2.6 — Röll et al. (2015) 14 2.6 2.3 0.3 Dufrêne et al. (1992) — 3.1 — — Comte et al. (2015) — 3.2 — — Yusop et al. (2008)
— 4.2 — — Henson (2009) cited in Carr (2011)
— 3.8 — 0.5 Henson (1999; including soil and ground
flora below canopy)
Mean ± SD 20 ± 6 (n = 2) 3.6 ± 0.8 (n = 6) 2.5 ± 0.2 (n = 2) 0.4 ± 0.1 (n = 2) Average ET partitioning: T 59%, ES14%, EC27% Note. The mean value is listed when multiple measured values are reported in the reference. Abbreviations: IC = rainfall interception loss, ET = evapotranspiration, T = transpiration, EC= canopy evaporation, ES= soil evaporation, BET = broadleaf evergreen tropical tree, PFT = plant functional type. Tarigan et al. (2018), Meijide et al. (2017), and Röll et al. (2015) are from our study sites at Jambi‐Palm.
schemes to model temporal precipitation resolution and to subgrid spatial variability of precipitation (Dolman & Gregory, 1992; Wang & Wang, 2007). These studies showed that modeled interception can increase substantially when the model time step decreases while the input forcing data frequency isfixed. Similarly, if the model time step isfixed (i.e., half‐hourly in this study), changing the forcing frequency would introduce similar shifts to the simulation of canopy water interception and evaporation. The default interception parameters in CLM are set to values that provide reasonable global partitioning of ET for commonly used forcing data sets. When the input rainfall forcing frequency differs between for-cing data sets, canopy interception and evaporation are therefore likely to change. The parameter values used in global simulations with low temporal resolution of forcing may not be appropriate when the model is run at individual sites where the forcing is typically provided on half‐hourly timescales. Considering PFT‐specific canopy interception traits according to field observations is particularly important in the tropics where landscapes are composed of natural forests and commodity croplands that have distinct canopies and diverse leaf and stem morphologies. In Southeast Asia, large areas of natural forests have been converted to oil palm plantations (Gunarso et al., 2013; Koh et al., 2011). In particular, since the 1990s, the Indonesian regions of Sumatra and Kalimantan experienced the highest rate (average 450,000 ha/year) of oil palm expansion anywhere in the world (Austin et al., 2017; Carlson et al., 2013; Gaveau et al., 2016; Meijaard et al., 2018; Statistics Indonesia, 2018). In situ and remote sensing observations have found significant impacts of such land cover change on carbon emissions (Carlson et al., 2013; Guillaume et al., 2018), water and energyfluxes (Meijide et al., 2017; Merten et al., 2016), surface temperatures (Sabajo et al., 2017), and microclimates (Hardwick et al., 2015; Meijide et al., 2018). Oil palm plantations in Sumatra and Kalimantan span 8–11 × 106
ha (Mha), nearly 10% of total regional land area. While replacement of natural forests with these plantations is likely to drive widespread changes in water and energy cycles, such changes are yet to be quantified at the regional scale.
Fan et al. (2015) developed the CLM‐Palm model to simulate the canopy structure, growth, yield, and asso-ciated carbon, water, and energy cycles for oil palms within the framework of CLM4.5 (Oleson et al., 2013). CLM‐Palm inherits the canopy hydrological parameterization of CLM4.5, which was primarily designed for forest PFTs and optimized to global average patterns of ET under six‐hourly forcing (Lawrence et al., 2007). Oil palm plantations often have incomplete canopy cover due to a regular planting density of around 150 stems/ha2(every 8 m × 8 m). The palms have nearly uniform, large leaves with caved leaflets and leaf axils on the trunk (Carr, 2011). Observations indicate that these oil palm leaf and stem morphologies can easily capture rainfall and form water reservoirs within the canopy (Merten et al., 2016; Tarigan et al., 2018). Therefore, Fan (2016) and Meijide et al. (2017) calibrated the interception parameters for the palm PFT including separate treatment of leaf and stem surfaces for interception storage in CLM4.5 with observed waterfluxes at a mature oil palm plantation. But these adaptations did not consider the influence of forcing frequency on interception and PFT‐specific interception traits of natural rainforests under convective preci-pitation conditions, and they were not evaluated systematically for ET partitioning at the regional scale. In addition, the role of wet canopy fraction in evaporation and transpiration is modeled as a new parameter in CLM5 (http://www.cesm.ucar.edu/models/cesm2/land/), which has not been evaluated for these two PFTs in Indonesia.
Given the need to understand the biophysical changes caused by expanding oil palm plantations in the tropics, a lack of interception parameters specific to oil palm and rainforest, and the mismatch between typical forcing data interpolation methods and short‐duration tropical rainfall events, it is critical to reevaluate and improve the canopy interception parameterization of CLM for both site and regional modeling. We address issues of forcing timescale and precipitation distribution and PFT‐specific canopy interception traits in this study by conducting experiments with rainforest and oil palm plantation using CLM‐Palm embedded in CLM4.5 and CLM5. Observed water and energy fluxes at multiple sites in our study area and a literature review on interception and ET partitioning of tropical vegetation types are used for model benchmarking. Our objectives are to (1) assess the uncertainty of the modeling of ET par-titioning caused by different timescales of forcing data; (2) implement and evaluate PFT‐specific canopy interception parameterization for tropical rainforest and oil palm plantation for use with observed half‐ hourly forcing; and (3) estimate the regional ET budget of forest and oil palm areas in Sumatra and Kalimantan, Indonesia, based on a new forcing interpolation algorithm and improved interception parameterization.
2. Materials and Methods
2.1. Study Area, Observation Data, and Literature Review
Our study region is located in Indonesia, which is the leading producer of palm oil globally and which har-bors vast natural tropical forest area. Within Indonesia, we leverage data from several study locations. These include a 12‐year‐old mature oil palm plantation (mean LAI 3.95 m2
/m2) called PTPN‐VI in Jambi Province, Sumatra (01°41.6′S, 103°23.5′E, 76 m a.s.l.; “Jambi‐Palm”), a lowland rainforest (mean LAI 4.8 m2/m2) in Harapan, Jambi, Sumatra (02°9.5′S, 103°20′E, 75 m a.s.l; “Jambi‐Forest”), and an old growth montane rain-forest (mean LAI 4.16 m2/m2) in Bariri, Central Sulawesi (01°39′S, 120°10′E, 1,427 m a.s.l.; “Bariri‐Forest”). For regional simulations, we focus on Sumatra and Kalimantan, which contain most of the planted oil palm areas within Indonesia. From 2013 to 2014, half‐hourly meteorological data (including global radiation [Rg],
precipitation, temperature, humidity, air pressure, wind, and vapor pressure deficit) were collected for the Jambi‐Palm (and three nearby meteorological stations) and Bariri‐Forest sites. Latent and sensible heat fluxes (LE and H, respectively) and ET were measured in 2014 by an eddy covariance flux tower at Jambi‐ Palm (Meijide et al., 2017). Half‐hourly transpiration (T) from sap flux measurements (Röll et al., 2015) is available from June to December 2014 for Jambi‐Palm and from July 2013 to February 2014 for Jambi‐ Forest. Another eddy covarianceflux tower at Bariri‐Forest provides ET, LE, and H fluxes in 2014 (Olchev et al., 2015). Besides these data, we conduct a literature review of observation‐based values of rainfall inter-ception loss (IC) and ET partitioning to T, canopy evaporation (EC), and soil evaporation (ES) for rainforests
and oil palm plantations across tropical regions (Table 1). These literature values together with observation data from our study sites are used as a reference for model development.
2.2. Model Description, Development, and Experiments
The CLM is a state‐of‐the‐art process‐based land surface scheme of the Community Earth System Model (Gent et al., 2011; Hurrell et al., 2013; Oleson et al., 2013). CLM formulizes and quantifies land surface carbon, water, and energy states andfluxes of diverse land cover types. Its canopy hydrology module repre-sents the partitioning of precipitation by the canopy (interception, throughfall, and drip) that influences ET components. The CLM4.5 default canopy interception parameterization including fpimx and dewmx is summarized in supporting information Text S1. CLM5 includes a hyperbolic tangent (tanh) function (Text S1, equation S7) for interception instead of the exponential function (Text S1, equation S1) used in CLM4.5. The tanh function and revised interception parameters (fpimx = 1, dewmx = 0.1) result in higher water interception efficiency than CLM4.5. However, CLM5 imposes a much lower maximum wetted frac-tion of foliage (fwetmx; 0.05 in CLM5 vs. 1.0 in CLM4.5; Text S1, equafrac-tion S8) to restrict canopy evaporative area and its influence on transpiration. The CLM5 public release version (http://www.cesm.ucar.edu/mod-els/cesm2/land/) includes both CLM4.5 and CLM5's canopy interception schemes, which allow us to con-duct the following experiments in the same model.
The six‐hourly CRUNCEP (Viovy, 2018) and three‐hourly GSWP3 (Global Soil Wetness Project; Kim, 2018) reanalysis data are used in CLM4.5 and CLM5 as standard forcing for offline simulations. These data are grid averages at a spatial resolution of 0.5° × 0.5°. Spatially, the model interpolates these forcing data tofiner model grids (e.g., 3 × 3 min in this study) using a bilinear algorithm. Subgrid distributions of different rain-fall types (e.g., stratiform vs. convective) are not accounted for in CLM. All water and energyfluxes modeled in this study are grid averages. Hereafter, we focus on the temporal aspects of precipitation forcing and their interaction with canopy interception parameterization. The model interpolates six‐hourly or three‐hourly precipitation by repeating rainfall rates from existing forcing time steps to every half‐hourly model step with the nearest time algorithm. Based on our experiences, this interpolation may result in inconsistencies in rainfall frequency compared to site observations (Figure 1). It is also known that global reanalysis data sets have large variability in precipitation amount and rainfall distribution (Poccard et al., 2000; Sun et al., 2017). To explore how forcing frequency and precipitation distribution affect interception and ET partitioning, we conduct a set of model experiments by constructing and comparing several versions of precipitation forcing based on the observed half‐hourly meteorology data and the six‐hourly CRUNCEP data (extracted to a single point) for the Jambi‐Forest site. These experiments use CLM4.5 default interception parameters but with six methods of precipitation forcing: (1) original half‐hourly site observation (Site‐half‐hour); (2) site observa-tions degraded to six‐hourly by aggregation (Site‐6‐hour); (3) site observations degraded to six‐hourly by
aggregation with diel rain distribution shifted by 8.5 hr to match the CRUNCEP pattern (Site‐6‐hour‐ shifted); (4) original six‐hourly CRUNCEP (CRUNCEP‐6‐hour); (5) reconstructed half‐hourly CRUNCEP with a new interpolation algorithm (CRUNCEP‐half‐hour); (6) reconstructed half‐hourly CRUNCEP with a new interpolation algorithm and with diel rain distribution shifted by 15 hr to match the site‐observed pattern (CRUNCEP‐half‐hour‐shifted). The new interpolation algorithm for methods 5 and 6 fills missing half‐hourly time slots within each 6‐hr CRUNCEP time step with zero precipitation while multiplying existing six‐hourly precipitation values by 12 (times of half‐hourly model steps) to conserve the total precipitation amount as it would be if using the default nearest time interpolation. The same method can be applied to three‐hourly GSWP3 data but with a multiplying factor of six to conserve total precipitation. For these site experiments, we also apply a randomization process that allocates each existing precipitation value of CRUNCEP to a randomly selected half‐hour model time step within the relevant 6‐hr period of CRUNCEP while the other 11 model time steps remain zero. This randomization facilitates the comparison of annual mean diel patterns offluxes using the six types of forcing data for Jambi‐Forest (Figure 2). We call this new interpolation algorithm“zero.” Aggregation and interpolation of precipitation are all applied to the site‐level forcing data before they are used as input to CLM. Forcing variables other than precipitation (e.g., radiation, temperature, humidity, and wind) are all from half‐hourly meteorology data collected in Jambi for the site simulations. We also compare ET partitioning generated from six‐ hourly CRUNCEP and three‐hourly GSWP3 forcing at the regional scale for Sumatra and Kalimantan using CLM4.5 default interception parameters.
Next, we improve the canopy hydrological parameterization with PFT‐specific canopy morphological traits for two tropical vegetation types, that is, oil palm and broadleaf evergreen tropical tree (BET) representing lowland and montane rainforests, under convective precipitation forcing. We extend the work of Fan (2016) and Meijide et al. (2017) by further implementing and evaluating the above interception parameters (interception efficiency fpimx, maximum wet fraction fwetmx, and storage capacity dewmx for leaf [dewmxl] and stem [dewmxs]) as PFT‐dependent variables for both forest and palm in CLM5 and benchmark them against observations so that the interception and ET characteristics of the two land cover types can be simu-lated at the regional scale. The new canopy hydrological parameterization is summarized in supporting information Text S2. We conduct three sets of sensitivity experiments with the new interception parameter-ization and half‐hourly forcing at Jambi‐Palm, Jambi‐Forest, and Bariri‐Forest. We perform a comprehen-sive evaluation of ET, T, EC, ES, LE and H fluxes, and ICfor both forest and oil palm using literature
values as well as observation data from our study sites for model benchmarking.
Finally, several regional (Sumatra and Kalimantan) simulations are run on a 3 × 3‐min high‐resolution grid (supporting information Figure S1). Each land grid cell is labeled as BET PFT, oil palm PFT, or other land
Figure 1. Effects of different forcing types on modeled intensity (a) and frequency (b) of rainfall when simulating Jambi‐Forest for the year 2014 with the Community Land Model version 4.5 default interception parameters. Rainfall intensity (a) and frequency (b) are based on model output rainfall events at half‐ hourly time steps when forced by the four types of precipitation forcing data that are constructed before input to the model (section 2.2). Hereafter, a model time step with nonzero precipitation is called a rainfall event. The six forcing types are described in section 2.2. Site‐6‐hour‐shifted and Site‐6‐hour have the same daily rainfall statistics, so do CRUNCEP‐half‐hour‐shifted and CRUNCEP‐half‐hour. Thus, only four forcing types are shown.
use types, based on year 2010 satellite derived land cover (see supporting information Figure S1). For our analysis, we only focus on grid cells with BET and palm PFTs. Four simulations with the above land use data are designed to assess the effects of forcing frequency and interception parameterization on ET partitioning. A control simulation is run with CLM5 default interception parameterization and forced with the six‐hourly CRUNCEP data with the nearest time interpolation (hereafter CRUNCEP‐CNTL). In addition, the interpolation algorithm zero is applied to the CRUNCEP forcing (CRUNCEP‐ZERO) so that a typical convective precipitation pattern in our study area can be roughly reproduced, based onfindings from the site‐level forcing frequency experiments (Figure 1, section 3.1). For this regional experiment, no precipitation randomization process within six‐hourly forcing periods is implemented for the zero interpolation because we do not analyze diel patterns but focus on monthly or annual means. Unlike site simulations, the interpolation of regional CRUNCEP forcing data is done within the time interpolation module of CLM5 on the fly. We also apply the observed half‐hourly meteorology of Jambi to all of Sumatra and Kalimantan in two regional simulations with CLM5 default (SITE‐CNTL) and PFT‐specific interception (SITE‐NEW) parameterizations.
Both site and regional simulations are performed with CLM‐Palm, which is embedded in both CLM4.5 and CLM5 so that it can simulate forests as well as oil palm. Simulations are run in satellite phenology mode (dri-ven by monthly LAI from MODIS data) with focus on biophysical processes. Besides the new interception parameters, all other PFT parameters either follow the defaults of the BET PFT or use the calibrated and vali-dated values of the palm PFT in Fan et al. (2015), which shows robust simulation of the carbon cycle for oil palm plantations. The effects of default and new interception parameterizations on simulated ET partition-ing and energyfluxes at the sites are presented with diel and daily statistics summarizing the minimum, first and third quartiles, median, maximum, and outliers using R version 3.2.3 (R Core Team, 2015) and ggplot2
Figure 2. Effects of different precipitation forcing types on partitioning of evapotranspiration (ET) to transpiration (T), canopy evaporation (EC), and soil evapora-tion (ES) when simulating Jambi‐Forest for the year 2014 with the Community Land Model version 4.5 default interception parameters. Data shown are mean diel patterns of the entire year 2014 simulated with six types of precipitation forcing (see section 2.2). Measured incoming global radiation (Rg) and vapor pressure deficit (VPD) in rescaled range from 0 to 0.5 together with their maximum values are shown in (e).
(Wickham, 2016). Interception loss is summarized for the whole period of simulation. Impacts of rainforest conversion to oil palm on annual average ET partitioning, soil moisture, and runoff are analyzed at the regional scale.
3. Results and Discussion
3.1. Issue of Forcing Frequency in the CLM Offline Simulation
The CRUNCEP forcing does not fully represent the rain distribution of the Jambi‐Forest site for the year 2014, including diel and seasonal variation (Figure 1a). The standard deviation of daily rainfall in CRUNCEP is only 3.5 mm compared to the observed 12.8 mm. Some observed dry periods (e.g., September) are not apparent in the reanalysis data. Although annual precipitation estimated by CRUNCEP is only 12% higher than observed precipitation, daily and annual rain events (defined as any 30‐min model time steps with precipitation) from the model when forced with CRUNCEP are 8 times more frequent than observed events due to model interpolation effects (Figure 1b). These unrealistically frequent rainfall events occur at nearly every time step (average 38 rain events per 48 time steps per day; Figure 1b). The diel rain distribution also differs between two data sets. According to site measurements, most rain falls at night whereas CRUNCEP rainfall peaks during the day (Figures 2a and 2d). When observed half‐hourly meteorology data are instead used as forcing for the Jambi site, the model simulates low EC(daily mean
10% of ET; Figure 2a), whereas the six‐hourly CRUNCEP forcing yields much higher diel EC(40% of ET;
Figure 2d). When the observed half‐hourly precipitation is degraded to six‐hourly precipitation while hold-ing all other forchold-ing variables identical, the simulated ECis slightly enhanced to 14% of ET (Figure 2b), an
effect related to the greater number of rainfall events generated by model interpolation (Figure 1b). If the forcing frequency remains at six‐hourly and most precipitation is shifted to the daytime, EC is further
enhanced to 20% of ET because daytime incoming radiation and vapor pressure deficit provide favorable conditions for evaporation (Figure 2c). Conversely, when the six‐hourly CRUNCEP precipitation is recon-structed to half‐hourly by applying the zero interpolation method (see section 2), the modeled rainfall fre-quency declines and is comparable to our observations (three modeled vs. four observed rain events per day; Figure 1b), and ECis also reduced to 25% of ET (Figure 2e). If the precipitation distribution of CRUNCEP is
shifted to nighttime, ECis further reduced to 18% of ET (Figure 2f) and becomes comparable to that of the
original site forcing (Figure 2a) especially around noon. Accumulated rain interception at night leads to pro-longed canopy evaporation in the morning (Figures 2a, 2b, and 2f). These experiments suggest that using the six‐hourly CRUNCEP data potentially overestimates canopy water interception and ECbecause it fails to
represent the frequency and distribution of rainfall at our study site.
Regional simulations with CLM4.5 also produce greater canopy water interception and ECwhen forcing
fre-quency is degraded from three‐hourly (GSWP3) to six‐hourly (CRUNCEP; Figure 3), although regional monthly total precipitation of CRUNCEP is just 86% of GSWP3. The magnitude of EC forced by
CRUNCEP (1.55 ± 0.7 mm/day) is 63% higher than that forced by GSWP3 (0.95 ± 0.4 mm/day), because canopies are more often wet under CRUNCEP. The T forced by CRUNCEP (1.13 ± 0.5 mm/day) is 12% lower than the T forced by GSWP3 (1.29 ± 0.5 mm/day), because wetter canopies have lower stomatal conduc-tance. Overall, CLM4.5 offline simulations using default interception parameters (fpimx = 0.25, dewmx = 0.1, and fwetmx = 1) do a poor job of predicting regional average ET partitioning. The GSWP3 forcing predicts 38% EC, 51% T, and 11% ES, while CRUNCEP generates 51% EC, 38% T, and 11% ES. Both cases significantly
overestimate ECand underestimate T when compared to observed average values for tropical forest sites
(25% EC, 69% T, and 6% ES) in the literature (Table 1), although GSWP3 appears to be slightly more accurate.
The default canopy interception parameters in CLM4.5 are optimized for modeling global average patterns of ET partitioning when forced by six‐hourly reanalysis data such as QIAN (Qian et al., 2006) or CRUNCEP (Lawrence et al., 2007; Oleson et al., 2013). They were designed to represent the average interception ef fi-ciency and storage capacity of various canopy types under stratiform precipitation conditions (frequent and long‐lasting rainfall events), which are reconstructed from six‐hourly forcing data by applying a nearest time interpolation to every half‐hourly model step with downscaled rain intensity. However, our analysis suggests that these parameters are not suitable for simulating ET partitioning under convective precipitation conditions (short and intense downpours) typical for humid tropical regions such as western Indonesia. The nearest time interpolation will cause artificially frequent rain events that keep the canopy wet for
unrealistically long periods (thus overestimating EC and underestimating T). In contrast, our zero
interpolation method does reproduce short and intense rain events (thus lower EC) that better match the
precipitation condition in Indonesia. Notably, given various climatological types of rain distribution, not all precipitation events are best modeled at half‐hourly timescale (when input precipitation forcing data are provided at a longer timescale). Unrealistic rain distribution due to inappropriate interpolation intro-duces inaccuracy into land‐atmosphere water exchange and surface energy balance, especially considering thefine timescale (subhourly) of evaporation and transpiration processes (Lawrence et al., 2007).
To minimize the effect of nearest time interpolation and for obtaining CLM simulated ET components comparable to observations, forcing data withfiner timescales are preferable, because they better capture regional precipitation dynamics. If such data are available but the model has been designed to use coarser temporal inputs, our analysis suggests that recalibration of interception parameters is necessary (section 3.2). For regional or global simulations when half‐hourly forcing data are unavailable, alternatives to the nearest time interpolation such as the zero algorithm should be considered in regions with convective precipitation (section 3.3).
3.2. PFT‐Specific Canopy Water Interception Traits and ET Partitioning
Based on the above analysis, the CLM default interception parameterization optimized for CRUNCEP or GSWP3 reanalysis data must be reconciled with half‐hourly forcing to benchmark the model against observed water and energyfluxes at tropical sites of Indonesia. Simulations with the CLM4.5 and CLM5 default interception parameterizations using observed half‐hourly forcing data substantially underestimate ET (root mean square error [RMSE] = 0.13 mm) and overestimate T (RMSE = 0.1 mm) compared to observedfluxes at Jambi‐Palm (Figure 4), yielding low relative EC(6%) that is similar to EC at Jambi‐ Figure 3. Effects of forcing frequency (six‐hourly CRUNCEP versus three‐hourly GSWP3) on modeling canopy water interception and transpiration at the regional scale considering the broadleaf evergreen forest plant functional type (PFT) and oil palm PFT for Sumatra and Kalimantan, Indonesia. Data shown are for January 2010 with a spatial resolution of 3 min (~5.5 km) simulated with the Community Land Model version 4.5 default canopy interception parameterization (fpimx = 0.25, dewmx = 0.1, and fwetmx = 1).
Forest (Figure 2a). At Jambi‐Palm, observed rainfall in 2014 had a frequency of 1,709 events per year and 1.3 mm per event (Figure 1), where we define a “rain event” here as any model time step with rain provided by the forcing data (standard model time step 30 min). When considering the entire duration of an actual rain event (which can exceed 30 min), the intensity is >4 mm on average. The CLM4.5 default fpimxof 0.25 gives a maximum interception of 0.88 mm with a LAI of 4 (Text S1, equation S1), but the dewmxof 0.1 mm limits the interception storage to 0.4 mm per rain event (Text S1, equation S3). Excess water is lost to the ground through canopy runoff (Text S1, equation S4). Together, they result in an annual interception ratio ICas low as 4.5% in CLM4.5, where ICis defined as the interception, storage,
and subsequent evaporation of precipitation from the canopy, excluding canopy runoff.
Our sensitivity analyses with both the oil palm and BET PFTs at Jambi‐Palm, Jambi‐Forest, and Bariri‐ Forest simulated with CLM‐Palm embedded in CLM5 indicate that increasing rainfall interception effi-ciency (fpimx = 1) together with higher interception storage capacity by leaf (0.2≤ dewmxl ≤ 0.6 mm) and stem surfaces (2≤ dewmxs ≤ 6 mm) in CLM improve the accuracy of simulated IC, ET, EC, and T as well
as surface energy fluxes (LE and H) with reference to observation values (Figure 4 and supporting information Figure S2). Overall, in the model the mature oil palm plantation expresses higher interception storage capacity than the lowland and montane forests, whereas both forests express higher sensitivity of IC
to fwetmx. An fwetmx of 0.1 for oil palm and 0.05 for BET forest achieve best performance in modeling ICand
different ET components all together. A detailed analysis on the role of individual interception parameters and their interactions is in supporting information Text S3.
We further specified the dewmxl and dewmxs parameters for forest and oil palm PFTs in CLM based on field observations. According to observation at Jambi‐Palm, the leaf axils along mature oil palm's trunk provide spacious and rough surfaces that can accumulate a much thicker waterfilm than leaf surfaces (6 mm in Merten et al., 2016; 8.4 mm in Tarigan et al., 2018). Herwitz (1985) observes that stem (bark) surfaces of
Figure 4. Sensitivity experiments with the Community Land Model version 5 (CLM5) for a mature oil palm plantation (mean LAI = 3.95) Jambi‐Palm in Sumatra forced with half‐hourly measured meteorology. All experiments are run with CLM5 physics, where default1 and default2 are CLM4.5 and CLM5 default inter-ception parameterization using the exp (Text S1, equation S1) and tanh (equation S7) functions, respectively. Other models 1–9 all use fpimx = 1 and the tanh function. Observed evapotranspiration (ET), latent (LE), and sensible heat (H)fluxes from an eddy covariance flux tower and transpiration (T) from sap flux measurement in an oil palm plantation in Jambi during June–December 2014 are used as reference. Literature reported values (mean and standard deviation) of soil evaporation (ES) of forests and plantations and interception loss (IC) of oil palm plantations are used as reference for modeled ESand IC(Table 1 in the main text). All data are daily values during June–December 2014 except that ICis the annual interception loss as a ratio of total precipitation in 2014. Similar sensitivity analyses for Bariri‐Forest and Jambi‐Forest are in Figure S2 in the supporting information.
tropical rainforest trees account for 50% to 80% of total canopy interception storage. Moreover, stem area index (SAI; defined as the woody element surface area of the canopy) is calculated as 10% of LAI for the oil palm PFT (same as crop PFTs) in CLM‐Palm (Fan et al., 2015), while CLM's natural vegetation structure formula predicts a SAI that is 17% of LAI for BET forest (Oleson et al., 2013). Thus, to ensure that half of the total canopy interception storage is accounted for by stems for the oil palm PFT, we choose to use an intermediate dewmxs of 4 mm and increase dewmxl to 0.4 mm (default 0.1 mm in CLM). Similarly, setting dewmxs to 10 times of dewmxl for the BET forest PFT will partition approximately 63% of total interception storage to stem surfaces. Herwitz (1985) reports leaf interception storage in tropical rainforests ranging from 0.11 to 0.16 mm per unit LAI, while Munoz‐Villers et al. (2012) observed a range of canopy interception from 0.36 to 0.62 mm per unit LAI for secondary and old‐growth montane rainforests. Thus, for the BET PFT, we select dewmxl of 0.2 mm and dewmxs of 2 mm, which are equivalent to a canopy averaged dewmx of 0.46 mm.
After applying the PFT‐specific interception parameterization described above in CLM5 site simulations, modeledfluxes are less biased and have smaller residuals in comparison with measured diel half‐hourly flux data for both oil palm and rainforest sites (Figures 5 and 6). The default model underestimates daytime ET fluxes, especially for Bariri‐Forest (Figure 6b), and overestimates T of both oil palm (Figure 5e) and lowland rainforest (Figure 6e). ET values of both oil palm and montane rainforest are more realistically simulated by the modified model, as the fit lines become more aligned to the identity line (Figures 5a and 6a). For oil palm Tfluxes, the RMSE declines from 1 to 0.7 although R2also declines slightly (Figure 5d). For lowland forest T fluxes, the new parameters slightly reduce the RMSE from 0.09 to 0.08 (Figures 6e and 6f). While residuals of Tare larger than ET for both new and old parameterization, with the new interception parameters, the med-ians of these residuals become closer to zero for both oil palm and rainforests. Nevertheless, the modeled T
Figure 5. Simulated and measured evapotranspiration (ET) and transpiration (T) at a half‐hourly timescale using default (fpimx = 0.25, dewmx = 0.1, and fwetmx= 1) and modified canopy interception (fpimx = 1, dewmxl = 0.4, dewmxs = 4, and fwetmx = 0.1) for Jambi‐Palm. All other model physics including sto-matal conductance follow CLM5.0 defaults. Left panels are scatterplots of available half‐hourly values in 2014. Middle and right panels are minimal boxplots (Tufte, 1983) of the diel time course of residuals (dots indicate the median, solid boundaries of shaded area represent thefirst and third quartiles, and the end of vertical lines indicate minimum and maximum without outliers). RMSE = root mean square error.
remains significantly higher than sap flux T. Further increasing interception storage capacity for BET PFT would reduce model‐data discrepancy for T fluxes but overcorrect for ET of Jambi‐Forest (Figure S2b) and H of Bariri‐Forest (Figure S2a) and incur overestimation of IC (20–34%, Figure S2) for both forests
compared to literature values (IC= 16 ± 7%; Table 1). Notably, the observed T (1.7 ± 0.5 mm/day) at
Jambi‐Forest quantified through sap flux measurement is not only lower than our simulations but also lower than literature values (2.4 ± 1.1 mm/day; Table 1) and only comparable to a lowland forest (1.6 mm/day) reported in McJannet et al. (2007) and a subtropical forest (1.6 mm/day) measured by Song et al. (2017). The dynamics of Tflux is, however, well captured by the model as indicated by the high R2 (0.81). Reasons for our low measured T at Jambi‐Forest include low number of sampled trees, the exclusion of young trees with DBH < 10 cm and understory vegetation, and high stand heterogeneity, which result in up to 30% uncertainty in stand‐level T according to our estimates. Similarly, sap flux measurement at Jambi‐Palm had sample size related estimation errors of 14% for stand transpiration of oil palm (Niu et al., 2015).
The site level model‐data comparison and the sensitivity analysis together indicate that higher intercep-tion efficiency and storage capacity, especially via stem or bark surface storage, are needed to accurately simulate the partitioning of ET and surface energy for oil palm and tropical forest under realistic precipi-tation forcing characterized by intense but short‐duration rainfall events. However, these parameters should not be overcorrected forfitting site diel fluxes as there are uncertainties in observed fluxes (e.g., potential underestimation of T by sapflux measurement) at individual sites and possible deficiencies in other model parameters related to ET (e.g., plant hydraulic properties) that are not investigated in this study. It is particularly important not to overfit to a specific site because our PFT‐specific interception parameterization also aims to reproduce ET partitioning for oil palm and BET PFTs at the regional scale (section 3.3).
Figure 6. Simulated and measured evapotranspiration (ET) for Bariri‐Forest (a–c) and transpiration (T) for Jambi‐Forest (d–f) at a half‐hourly timescale using the Community Land Model version 5 default (fpimx = 0.25, dewmx = 0.1, and fwetmx = 1) and modified canopy interception (fpimx = 1, dewmxl = 0.2 and dewmxs = 2, and fwetmx = 0.05) for the broadleaf evergreen tropical tree (BET) forest plant functional type. RMSE = root mean square error.
3.3. ET of Oil Palm Plantations and Forests at the Regional Scale
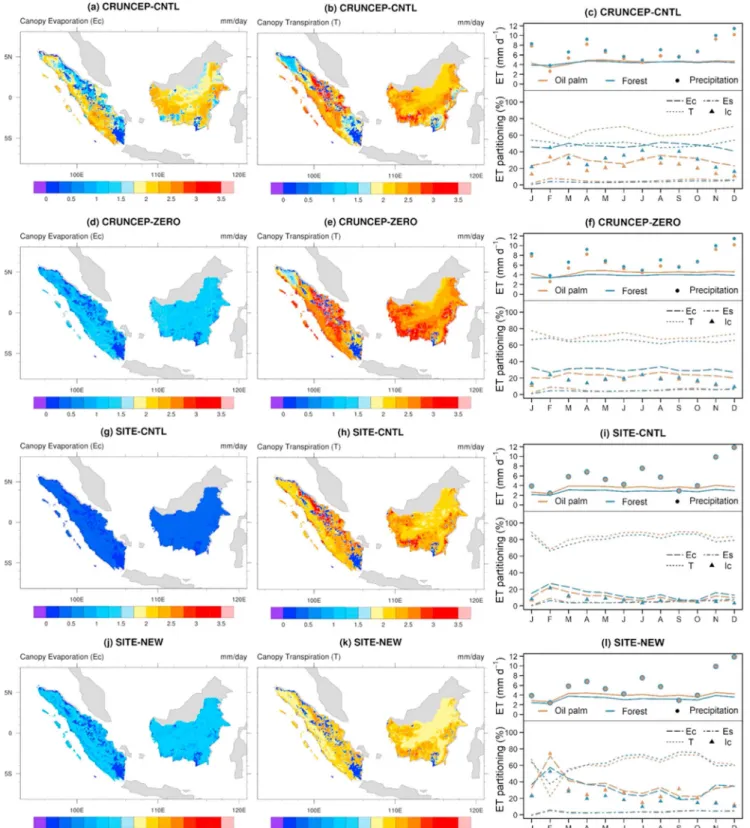
Using CLM5 default interception parameterization and half‐hourly site meteorology forcing, the regional simulation SITE‐CNTL predicts that oil palm and forest have similar annual ET partitioning (annual regio-nal average: 11% vs. 15% ECand 84% vs. 80% T for oil palm vs. forest), although with different magnitudes
(T = 3.0 vs. 2.3 mm/day, ET = 3.5 vs. 2.8 mm/day for oil palm vs. forest; Figure 7i; Table 2). The model under-estimates ECand interception loss (IC= 8% for both PFTs) in the same way as the site experiments for both
landscapes due to low daytime precipitation in Jambi (Figure 2a). Seasonal variation of precipitation drives similar trends of ET partitioning of the two PFTs; while transpiration predominates over evaporation, dryer seasons suppress T and enhance the ratio of ECto ET.
In contrast, CRUNCEP‐CNTL predicts similar magnitudes of ET (4.5 vs. 4.4 mm/day, oil palm vs. forest) but very different rainfall interception and ET partitioning for oil palm (IC= 22%, EC= 29%, and T = 65%) and
forest (IC= 31%, EC= 47%, and T = 49%) areas (Figure 7c). The difference in ET partitioning is mainly
attrib-uted to the spatial heterogeneity of microclimates (vapor pressure deficit = 578 vs. 495 Pa; precipitation = 194 vs. 215 mm/month; oil palm and forest areas, respectively) over the two land cover types that is captured in the CRUNCEP forcing but not in the site generalized half‐hourly forcing.
Comparison of these two control simulations (Figures 7a–7c and 7g–7i) shows that CLM5 default uniform parameterization potentially overestimates interception and ECand underestimates T for forest areas with
relatively high precipitation (CRUNCEP‐CNTL), when compared to observed ET partitioning in forest sites (25% EC, 69% T, 6% ES; Table 1). With lower precipitation (SITE‐CNTL) the model tends to underestimate EC
and overestimate the T to ET ratio, indicating that the amount of precipitation rather than PFT‐specific canopy traits is the major control on interception loss and ETfluxes in the default model.
When the six‐hourly CRUNCEP data are interpolated to half‐hourly with the new zero interpolation algo-rithm (Figures 7d–7f; Table 2), CRUNCEP‐ZERO simulates lower ET fluxes for oil palm (ET = 4.4 mm/ day, EC= 1.0 [23%], and T = 3.2 [71%]) and forest areas (ET = 3.9 mm/day, EC= 1.2 [30%], and T = 2.5
[65%]). Lower rainfall frequency significantly reduces ECcompared to CRUNCEP‐CNTL, although the daily
precipitation amount does not change. ET magnitudes are still overestimated because of overestimation of total precipitation in CRUNCEP (Figure 1). The overall ET partitioning becomes comparable to observed ranges for tropical forests and oil palm plantations summarized in Table 1, except that observations show higher ECin oil palm plantations than forests, but the model predicts an opposite pattern given higher
pre-cipitation in forest areas (Figure 7f). Overall, forest has more stable seasonal patterns of waterfluxes than oil palm across dry and wet periods (Figure 7f).
SITE‐NEW accurately simulates the magnitude and partitioning of ET for oil palm (ET = 3.9 mm/day, EC= 1.3 [35%], and T = 2.4 [61%]) and forest (ET = 3.2 mm/day, EC= 1.1 [33%], and T = 2.1 [63%]) areas
compared to observation (Table 1), although ECis slightly overestimated for both PFTs and T is slightly
underestimated for forest (Figures 7j–7l; Table 2). The simulated average T (2.4 mm/day) for oil palm areas is close to the observed T (2.6 mm/day; Röll et al., 2015) of a mature oil palm plantation in our study area Jambi. The measured ET (4.7 mm/day) from an eddy covariance flux tower in the same plantation (Meijide et al., 2017) is 20% higher than modeled regional average ET. Both measured T and ET from this industrial plantation in Jambi are higher than observed values for most rainforests and plantations (Table 1), which probably is related to its high rate of nitrogen fertilization (about 200 kg·N·ha−1·year−1) and management intensity (Kotowska et al., 2015; Meijide et al., 2017). Another study by Roupsard et al. (2006) on coconut palm, a close relative of oil palm but with much lower LAI, shows lower T (1.8 mm/ day) and ET (2.6 mm/day) but a higher T to ET ratio (68%). Our model simulations are run in satellite phe-nology mode (i.e., vegetation status was driven by monthly MODIS data) and do not include carbon‐nitrogen biogeochemistry and fertilization. Therefore, our experimental settings focus on simulating differences in biophysical properties between the BET and oil palm PFTs (e.g., LAI, leaf angle and rooting distribution, and interception parameters in this case) and spatial variation in hydrological conditions (e.g., topography and soil texture) in the surface input data. For example, compared to forests, oil palms are at lower elevations (mean elevation 71 vs. 292 m, oil palm vs. forest), have slightly higher LAI (annual regional mean 4.9 vs. 4.8 m2/m2, oil palm vs. forest), and have greater deep soil water reserves (mean volumetric soil water content 12% vs. 8% below 1 m, oil palm vs. forest). These factors could result in higher transpiration and therefore
Figure 7. Regional simulations with the Community Land Model version 5 (CLM5) for Sumatra and Kalimantan: (a–c) CRUNCEP forcing with CLM5 default nearest time interpolation and uniform interception parameterization (CRUNCEP‐CNTL: fpimx = 1, dewmx = 0.1, and fwetmx = 0.05); (d–f) default interception parameterization and CRUNCEP forcing but with the new zero interpolation method (CRUNCEP‐ZERO); (g–i) observed half‐hourly forcing from Jambi sites applied to the whole region and CLM5 default interception (SITE‐CNTL); (j–l) observed half‐hourly forcing but plant functional type (PFT)‐specific parameters (SITE‐NEW: dewmxl = 0.4, dewmxs = 4, and fwetmx = 0.1 for oil palm; dewmxl = 0.2, dewmxs = 2, and fwetmx = 0.05 for forest; fpimx = 1 for both PFTs). All simulations use the same land surface input data. (c, f, i, l) are regional average evapotranspiration (ET), canopy evaporation (EC), transpiration (T), soil evaporation (ES), and interception loss (IC) summarized each month for oil palm and forest areas separately during the year 2014. Regional spatial plots of ECand T use annual average values for 2014.
higher ET in oil palm plantations than forests even though they have similar photosynthetic capacity (Vcmax25for canopy top = 55.1 vs. 55.0μmol·m−2·s−1, oil palm vs. forest) and under the same climate
forcing. Seasonal analysis shows that oil palm's ET partitioning is more sensitive to drought (e.g., February 2014) than that of forests (Figure 7l) because oil palm transpiration is suppressed and ICand EC
are enhanced, to higher degrees with higher interception storage. Other dry months like June and September 2014 do not have a noticeable impact on ET because in the model, soil water content remains stable following the preceding months that are wetter. In general, PFT‐specific interception parameters derived from observation (section 3.2) significantly improve CLM5 default uniform parameters under half‐hourly site meteorology forcing characterized by convective rainfalls. The improvement is mainly due to enhanced IC and suppressed stomatal conductance by increased interception storage, which renders
overall higher ET.
Spatial analyses of both SITE‐NEW and CRUNCEP‐ZERO suggest that current oil palm areas have about 15–20% higher ET and 18–27% higher T fluxes than current natural forests in Indonesia (Figures 7f and 7i). Analysis of microclimate variables of CRUNCEP‐ZERO indicates that the higher vapor pressure deficit in managed oil palm landscapes is the major driver of their enhanced T and ET, whereas the higher preci-pitation in natural forests leads to enhanced EC but lower T, given the same interception parameters.
SITE‐NEW gives similar regional average ET partitioning (29% EC, 57% T, and 14% ES) to that of
CRUNCEP‐ZERO (26% EC, 59% T, and 15% ES), except that oil palm areas have slightly higher magnitude
of ECthan forest areas, mainly due to their different interception traits given the same climate.
In all simulations, ESis 15% of ET averaged over the whole region including bare soils, whereas soils under
both vegetation types contribute much lower ES(0.1–0.2 mm or 4–6% of ET), which is lower than
observa-tion for oil palm plantaobserva-tions (0.47 mm or 14%). Underestimaobserva-tion of ESalso occurs in the site sensitivity
experiments for both forest and oil palm PFTs (supporting information Figures S2 and S3). It might be related to the fact that the CLM default“big leaf” radiative transfer scheme ignores canopy gaps by assuming foliage distribution as turbid medium, but gaps exist in forests and especially oil palm plantations due to a regular planting density. One solution to this problem is to utilize a dynamic multilayer radiative scheme in CLM‐Palm (Fan, 2016) that represents the vertical profile of canopy as well as its horizontal gaps that can better simulate ground energy balance and enhance soil evaporation (see supporting information Figure S3 and Text S4).
Our regional experiments suggest that existing oil palm plantations in Sumatra and Kalimantan (8.8 × 106ha by 2010) use more water and increase total regional ET by 211 to 238 mm (19–21 Gigatonnes) per year com-pared to existing forest areas, according to spatial analysis of CRUNCEP‐ZERO and SITE‐NEW. The mean ET of forests in lowland areas (elevation <100 m) is almost the same as that of all forest areas in Sumatra and Kalimantan. The regional average difference between oil palm and forest is in line with our site comparisons (section 3.2) and an ecohydrological modeling study by Manoli et al. (2018) thatfind increased ET and T in mature industrial oil palm plantations compared to forests in Indonesia. Our literature reviewfinds slightly higher ET in oil palm plantations (3.6 ± 0.8 mm/day) than forests (3.5 ± 0.9 mm/day) in tropical regions
Table 2
Modeled Regional and Annual Mean Evapotranspiration Partitioning and Interception Loss for Each of the Series of Experiments Described in Section 2.2
Experiment Forest vs. oil palm T (%, mm/day) EC (%, mm/day) ES (%, mm/day) ET (mm/day) IC(%) CRUNCEP‐CNTL Forest 49, 2.21 47, 2.05 4, 0.16 4.42 31 Oil palm 65, 3.03 29, 1.27 6, 0.23 4.53 22
CRUNCEP‐ZERO Forest 65, 2.52 30, 1.16 5, 0.18 3.86 17
Oil palm 71, 3.21 23, 1.00 6, 0.23 4.44 17
SITE‐CNTL Forest 80, 2.25 15, 0.40 5, 0.14 2.79 8
Oil palm 84, 2.98 11, 0.37 5, 0.17 3.52 8
SITE‐NEW Forest 63, 2.06 33, 1.05 4, 0.12 3.23 21
Oil palm 61, 2.43 35, 1.32 4, 0.13 3.88 27
Note. Refer to section 2.2 or Figure 7 for definitions of CRUNCEP‐CNTL, CRUNCEP‐ZERO, SITE‐CNTL, and SITE‐ NEW. Abbreviations of ET, T, EC, ES, and ICare as in Table 1.
within and outside of Indonesia. Yet empirical observations of these variables for oil palm plantations are very limited, and the small number of oil palm studies (Table 1) might not sufficiently represent the spatial variation of climate and ET across oil palm areas in Indonesia.
The increased water use by oil palm has small negative impact on top 1‐m soil moisture (annual aver-age = 307 vs. 344 mm under oil palm and forest covers) but positive impact on total water content in the soil column (13.8% vs. 10.5% by volume for oil palm and forest). The multilayer soil profile derived from the model suggests that oil palm's higher water demand for transpiration could reduce soil moisture down to maximum 2‐m depth, which is related to oil palm's rooting distribution (99% roots in top 1 m, as compared to BET forest's 50% roots in top 1 m and 95% roots down to 4.5 m according to Jackson et al., 1996). Deeper soil water processes and states are mainly regulated by climate and topography, which may explain the dif-ference in total volumetric soil water. Soil water balance analysis with CRUNCEP‐ZERO shows that com-pared to forest areas, oil palm areas have substantially lower annual surface runoff (233 mm oil palm vs. 496 mm forest) and subsurface drainage (3 mm oil palm vs. 142 mm forest), resulting in slightly reduced water input to the land by 42 mm/year (precipitation minus ET and runoffs). Surface and subsurface runoffs in current lowland oil palm areas are likely limited by the much lower elevation and smaller topographic slope (mean 0.3° vs. 1.7°) than forest landscapes. Merten et al. (2016) observe no significant difference in soil moisture content (top 0.3 m) under forests and oil palms in our study area due to limited sampling size and high within‐plot variability. Manoli et al. (2018) find reduced surface runoff and aquifer recharge in multiple mature oil palm sites compared to a reference forest site, whereas Merten et al. (2016) and Tarigan et al. (2018) observe enhanced surface runoff in oil palm plantations due to reduced infiltration associated with soil compaction by intensive harvest activities. However, these site‐level studies do not consider large‐scale variations in hydrology driven by mesotopographic and macrotopographic features and watershed charac-teristics, and they focus on a limited range of plantation age. Our regional experiments simulate the spatio-temporalfluctuations in the water cycle considering different developmental stages of forests and oil palm plantations (LAI varies from 0 to 6) across climate and soil conditions according to 2010 land cover. Further land use change experiments are needed to isolate the effect of oil palm land cover on runoff from topographic/watershed effects at the regional scale. Nevertheless, the small drying effect on top soil moisture associated with oil palm's higher water use by our regional simulations indicates the risk of aridification after forest to oil palm conversion that would impact water supply to other ecosystems (Merten et al., 2016) and incur possible energy feedbacks (Meijide et al., 2017; Sabajo et al., 2017).
3.4. Uncertainties and Perspectives
The PFT‐specific interception parameters used in SITE‐NEW were calibrated for mature oil palm stands and mature rainforests. In contrast, the land surface input data include oil palm plantations with different maturity (LAI from 1.7 to 6, mean 4.9) and forests with different successional stages (LAI = 0 to 6.4, mean 4.8) in vegetated areas. Although the interception functions (Text S1, equation S1, and Text S2, equation S7) are designed to represent the nonlinear dependency of interception rate on LAI as it develops from 0 (newly established vegetation) to 6 (fully mature vegetation), the new interception storage parameters (demmxl and dewmxs) based on observation from mature stands might not be suitable for young palms or trees. The small fwetmx values (0.05 or 0.1) delimit the fraction of canopy area for evaporation of intercepted raindrops. However, nonlinearity also exists in the relationship between canopy evaporative area and plant area index (LAI + SAI) due to clumping of foliage and canopy layers. Therefore, the parameters demmxl, dewmxs, and fwetmx may not fully represent the dynamics of interception with increasing stand age and size. We only assessed the response of interception and ET partitioning to precipitation forcing and PFT‐specific canopy interception characteristics. Other climate variables such as wind speed (e.g., wind shake of branches) and PFT physiological parameters such as stem hydraulic property might influence interception and evaporationfluxes but are not sufficiently represented in the model. Moreover, the interception and eva-poration rates in CLM5 do not consider fast evaeva-poration processes such as splash droplet evaeva-poration, which is suggested by other studies as a significant component of interception loss when heavy rainfalls reach the vegetation surface at a high speed (Murakami, 2006, 2007). However, optimizing canopy evaporation schemes for splash droplet evaporation or other detailed interception‐evaporation processes in CLM is chal-lenging without knowing specific rainfall intensity and droplet size from gridded subdaily forcing data and without resolving within‐canopy radiation, temperature, momentum, and humidity profiles in a “big‐leaf”
canopy model used here. In a land surface modeling scheme, adapting interception storage capacity to PFT‐ specific canopy structure and morphological traits is a convenient and realistic approach instead of using uniform parameterization for all PFTs. Nevertheless, results of CRUNCEP‐ZERO with a new time interpo-lation algorithm but default interception provides complementary information (spatial heterogeneity of cli-mate) to that of SITE‐NEW (PFT‐specific canopy interception traits), which together allow improved accuracy over default model settings in quantifying the difference in surface water budgets between forest and oil palm landscapes in Indonesia.
Notably, our land surface data (Figure S1) contain most large‐scale plantations detectable by satellite imagery (Gunarso et al., 2013), including newly developed areas but excluding independent smallholders. Smallholder oil palm areas account for more than 40% of Indonesia's planted oil palm area (Lee et al., 2014), but independent smallholder areas, which are often less fertilized and have lower T and ET (Meijide et al., 2017; Röll et al., 2015), are omitted in our maps due to small plot size. Therefore, our esti-mates of oil palm effects on regional water balance mainly represent industrial plantations of different ages that are developed in large contiguous areas and managed intensively. Moreover, our regional assessment does not fully consider management effects such as different fertilization, soil compaction and drainage, and logging practices. Nevertheless, our regional simulations with different forcing methods and intercep-tion parameterizaintercep-tions all indicate that oil palm expansion in Indonesia could increase regional water use (ET) by 15% to 20% and incur aridification by decreasing top 1‐m soil moisture (−3% to −11%). These find-ings are based on spatial comparison of existing oil palm and forest areas in the current climate and 2010 land use, though not all oil palm plantations were developed from forests (Austin et al., 2017). Implications of conversions from other land cover types (e.g., annual crops, scrubland, and savannah) to oil palm are beyond the scope of this study. Transient land use land cover modeling experiments considering historical and future climate change and land use change are necessary steps to fully address the impacts of large‐ scale forest to oil palm conversion on regional water and energy budgets in the context of global climate change.
4. Conclusions
In this study wefind that forcing frequency substantially affects offline CLM simulation. Interpolating three‐hourly or six‐hourly reanalysis forcing data to a half‐hourly model timescale by a nearest time method introduces significant biases into the distribution of precipitation and thereby biases canopy interception modeling and associated estimates of water and energyfluxes from tropical forests and oil palm plantations. CLM5 default interception parameters optimized for global average patterns of ET partitioning may not be appropriate for site or regional simulations where interpolated diel precipitation patterns and rain‐event fre-quency from reanalysis data could depart widely from observed patterns and rain‐event frequency. Using PFT‐specific interception parameters based on canopy traits is reasonable for simulating ET of distinct vege-tation types even if they are under the same climate. Based on detailed sensitivity analysis and benchmark-ing with site observations, higher water interception efficiency and storage capacity considering both leaf and stem surfaces proved useful for modeling rainfall interception loss and ET partitioning of oil palm versus natural rainforests in Indonesia where short and intense rain events are prevalent. For regional or global simulations when half‐hourly precipitation forcing is not available, our zero interpolation method is a con-venient solution to the forcing frequency issue because it can remove biases in the frequency of precipitation, especially for regions dominated by convective precipitation. In more stratiform rainfall regimes, the zero‐ interpolation method would not be appropriate.
While uncertainty remains in modeling the full picture of surface water balance and in the collected refer-ence data, the CLM offline site and regional simulations do provide insights into the modeling of intercep-tion and waterfluxes of tropical ecosystems under land use change. Our results indicate that the existing oil palm plantations in Sumatra and Kalimantan may be using 15–20% (mean 20 Gt/year) more water than the original rainforests. The additional water use by oil palms reduces soil moisture down to 2‐m depth and would impair water availability for other ecosystems. The improved canopy hydrology schemes and water cycle assessment in this study provide a stepping stone for further investigations on coupled biogeophysical and biogeochemical cycles and feedbacks of rainforest to oil palm conversion to micro‐ and regional climates in an Earth system modeling framework.