HAL Id: hal-01595559
https://hal.archives-ouvertes.fr/hal-01595559
Submitted on 26 May 2020HAL is a multi-disciplinary open access
archive for the deposit and dissemination of sci-entific research documents, whether they are pub-lished or not. The documents may come from
L’archive ouverte pluridisciplinaire HAL, est destinée au dépôt et à la diffusion de documents scientifiques de niveau recherche, publiés ou non, émanant des établissements d’enseignement et de
Proteomic Analysis of Regulatory T Cells Reveals the
Importance of Themis1 in the Control of Their
Suppressive Function.
Fanny Duguet, Marie Locard-Paulet, Marlène Marcellin, Karima Chaoui,
Isabelle Bernard-Cadenat, Olivier Andreoletti, Renaud Lesourne, Odile
Burlet-Schiltz, Anne Gonzalez de Peredo, Abdelhadi Saoudi
To cite this version:
Fanny Duguet, Marie Locard-Paulet, Marlène Marcellin, Karima Chaoui, Isabelle Bernard-Cadenat, et al.. Proteomic Analysis of Regulatory T Cells Reveals the Importance of Themis1 in the Control of Their Suppressive Function.. Molecular and Cellular Proteomics, American Society for Biochemistry and Molecular Biology, 2017, 16 (8), pp.1416-1432. �10.1074/mcp.M116.062745�. �hal-01595559�
Version postprint
Proteomic analysis of regulatory T cells reveals the importance of Themis1
in the control of their suppressive function
Fanny Duguet1,2,&, Marie Locard-Paulet1,&, Marlène Marcellin1, Karima Chaoui1, Isabelle
Bernard2, Olivier Andreoletti3, Renaud Lesourne2, Odile Burlet-Schiltz1, Anne Gonzalez de
Peredo1,§,&, Abdelhadi Saoudi2,§,&
1Centre National de la Recherche Scientifique, Institut de Pharmacologie et de Biologie
Structurale, 31077 Toulouse, France; Université de Toulouse, Université Paul Sabatier, Institut de Pharmacologie et de Biologie Structurale, 31077 Toulouse, France.
2Centre de Physiopathologie de Toulouse Purpan, Université de Toulouse, Centre National de
la Recherche Scientifique, Institut National de la Santé et de la Recherche Médicale, UPS, 31024, Toulouse, France.
3UMR INRA ENVT 1225, Interactions Hôtes Agents Pathogènes, Ecole Nationale Vétérinaire
de Toulouse, 31000 Toulouse, France.
Running title: Label-free proteomics of regulatory T cells
&Contributed equally to this work
§Corresponding authors:
Abdelhadi Saoudi, e-mail: abdelhadi.saoudi@inserm.fr ; Phone: +33 562 744 512 Anne Gonzalez de Peredo, e-mail: gonzalez@ipbs.fr; Phone +33 561 175 541
Version postprint
Abbreviations: Treg: regulatory T cells; Tconv: conventional CD4
+ T cells; Foxp3: forkheadbox P3; GFP: Green Fluorescent Protein; XIC: Extracted Ion Chromatogram; SDS-PAGE: Sodium Dodecyl Sulfate Polyacrylamide Gel Electrophoresis; TFA: Trifluoroacetic Acid; CID: Collision Induced Dissociation; FDR: false discovery rate; GO: Gene Ontology; LN: lymph node; MS: mass spectrometry; LC-MS/MS: Liquid chromatography coupled with tandem mass spectrometry; IPEX: immunodysregulation polyendocrinopathy enteropathy X-linked syndrome; HCD: Higher-energy collisional dissociation; PCR: Polymerase chain reaction.
Keywords: regulatory T cells, mass spectrometry, proteomics, label-free quantification,
Themis1, TCR pathwayAll raw mass spectrometry files, as well as protein identification and quantitative results from the MaxQuant software, have been deposited to the ProteomeXchange repository via Pride, and can be accessed during the peer review process at
https://www.ebi.ac.uk/pride/archive/login with the following account details:
Project Name: Comparative proteomic analysis of mouse CD4+Foxp3+ regulatory T cells and CD4+Foxp3- conventional T cells
Project accession: PXD004436 Reviewer account details:
Username: reviewer78929@ebi.ac.uk Password: 8XPUZbe9
Version postprint
Abstract
Regulatory T cells (Treg) represent a minor sub-population of T lymphocytes which is crucial for the maintenance of immune homeostasis. Here, we present a large-scale quantitative mass spectrometry study that defines a specific proteomic “signature” of Treg. Treg and conventional T lymphocyte (Tconv) sub-populations were sorted by flow cytometry and subjected to global proteomic analysis by single-run nanoLC-MS/MS on a fast-sequencing Q-Exactive mass spectrometer. Besides “historical” proteins that characterize Treg, our study identified numerous new proteins that are up- or down-regulated in Treg versus Tconv. We focused on Themis1, a protein particularly under-represented in Treg, and recently described as being involved in the pathogenesis of immune diseases. Using a transgenic mouse model over-expressing Themis1, we provided in vivo and in vitro evidence of its importance for Treg suppressive functions, in an animal model of inflammatory bowel disease and in co-culture assays. We showed that this enhanced suppressive activity in vitro is associated with an accumulation of Tregs. Thus, our study highlights the usefulness of label free quantitative methods to better characterize the Treg cell lineage and demonstrates the potential role of Themis1 in the suppressive functions of these cells.
Version postprint
Introduction
Regulatory T cells (Treg) are a subset of CD4+ T cells that are characterized by the
expression of the transcription factor Foxp3 (Forkhead box protein P3). They play a central role in maintaining peripheral immune tolerance and preventing autoimmune diseases (1). This is best exemplified by the severe systemic autoimmunity and lymphoproliferative disorders observed in Treg deficient Scurfy mice and in human IPEX patients carrying non-functional or hypomorphic alleles of the Foxp3 gene (2-5). Furthermore, the quantitative or qualitative defect in Treg cells have also been implicated in the development of several common autoimmune and inflammatory diseases. In addition to the maintenance of self-tolerance, Treg population can also be exploited to establish immunologic tolerance to transplanted tissues (6). This has led to an increasing interest in the possibility of using Treg as a target for therapy to preserve and restore tolerance to self-antigens (in autoimmunity), to allergen (in allergy) and to alloantigens (in transplantation). However, an excessive Treg activity could coincidently impair immunity toward pathogens and tumors (7-9). It is thus critical to understand Treg functions and regulation to avoid potential negative side effects of such therapeutical setups.
In this study, we compared the proteomes of CD4+Foxp3+ Treg (that include both
CD25+ and CD25- Treg) and CD4+Foxp3- conventional T cells (Tconv) in order to build a data
set of proteins differentially regulated in these two cell populations. An important challenge in this context was to achieve sufficient proteomic analytical depth starting from the low protein amounts obtained from highly purified primary murine Treg cells. We herein present an optimized label free LC-MS/MS workflow that allowed us to build an extensive quantitative data set of proteins expressed in Treg and Tconv. Its thorough statistical analysis undercovered
Version postprint
regulated proteins were up-regulated in Treg compared to Tconv, and could be induced by Foxp3 and responsible for Treg development and functions. However, the Treg phenotype also depends on the specific repression of some molecules. For example, the genome organizer SATB1, which is required for the induction of T effector (Teff) cytokines, was actively and continuously suppressed by Foxp3 in Treg in order to prevent the differentiation of Treg into Teff cell (10). Other proteins down-regulated in Treg are involved in their development and/or function, such as TCF7 (11) or ITK (12), which both were shown to modulate TCR signal strength and thereby the commitment of precursors into the Treg lineage. Accordingly, we also identified in the present study many proteins that are down-regulated in Treg compared to Tconv. Among them, Themis1 appeared as a protein particularly down-regulated in Treg cells (4-fold) and was thus selected for further in vitro and in vivo validation studies. We showed that overexpression of Themis1 in Treg led to an increase of their suppressive functions, suggesting its importance as a checkpoint control in the suppressive function of Treg.
Version postprint
Experimental procedures
Mice. Treg cells were purified from DEREG mice expressing a diphtheria toxin
receptor-enhanced green fluorescent protein (DTR-eGFP) fusion protein under control of the endogenous Foxp3 promoter (13) (kindly provided by Dr. Tim Sparwasser - Hannover Medical
School, Germany). All mice were on C57BL/6 background. Transgenic mice expressing
Themis1 under the control of the human CD2 gene promoter (Themis1-Tg) and their litermate controls were used for functional studies (14). Rag2-/- mice were provided by the breeding
facility of INSERM (Zootechnie US-006). All the experiments were conducted with sex and age-matched mice between 6 and 10 weeks old housed under specific pathogen-free conditions at the INSERM animal facility (Zootechnie US-006; accreditation number A-31 55508), which is accredited by the French Ministry of Agriculture to perform experiments on live mice. All
experimental protocols were approved by the local ethics committee and are in compliance with
the French and European regulations on care and protection of the Laboratory Animals (EC Directive 2010/63).
Antibodies and flow cytometry analysis. The fluorescent conjugated antibodies used for flow cytometry were purchased from Biosciences and BD Biosciences: TCR (H57-597), anti-CD4 (RM4-5), anti-CD25 (PC61), anti-CD62L (MEL-14), anti-anti-CD45RB (16A), anti-CD39 (Duha59), anti-CD73 (TY/23), anti-PD-1 (J43), anti-CTLA4 (UC10-4F10-11), anti-GITR (DTA-1) and anti-CD127 (SB/119). Intracellular staining was performed using the Foxp3 staining buffer kit (e-Biosciences) according to the manufacturer’s instructions before data acquisition on a BD LSRII flow cytometer and analysis with the FlowJo software.
Purification and sorting of primary mouse T cells. For each of the 7 biological replicates, a
Version postprint
5 to 7 mice. Spleen and lymph nodes were harvested from DEREG mice and lysed in ACK
buffer and washed twice. CD4+ T cells were enriched with the Dynal mouse CD4 cell negative
isolation kit (Invitrogen) according to the manufacturer’s instructions. CD4+ T cells were then
labeled with anti-TCR, anti-CD4 and anti-CD62L for FACS sorting of CD4+CD62LhighGFP- T
cells (Tconv) or CD4+CD62LhighGFP+ T cells (Treg). The purity of the purified subsets was
higher than 99% (Fig. S1).
Sample preparation for proteomic analysis. CD4+CD62LhighGFP- and CD4+CD62LhighGFP+ cells were lysed in 4% SDS, 150 mM Tris pH8 and sonicated. Protein concentrations in each sample were determined using a detergent-compatible assay (DC assay, Bio-Rad) and total protein amounts were adjusted across samples. Cysteine residues were reduced by addition of 25 mM final of dithiothreitol for 5 min at 95°C, and alkylated by addition of iodoacetamide at a final concentration of 90 mM for 30 min at room temperature in the dark. For each protein sample, 10-15 µg were loaded onto 1D SDS-PAGE gel (stacking 4% and separating 12% acrylamide). For one-shot analysis of the entire mixture, no fractionation was performed, and the electrophoretic migration was stopped as soon as the protein sample entered the separating gel. The gel was stained with Coomassie Blue, and a single band containing the whole sample, was cut. Alternatively, electrophoretic migration was performed to fractionate the protein sample into 9 gel bands. Gel slices were washed with two repeated cycles of 15 min incubations at 37°C: 100 mM ammonium bicarbonate and 100 mM ammonium bicarbonate:acetonitrile (1:1). The proteins were then digested overnight at 37°C with 0.6 µg of modified sequencing grade trypsin (Promega) in 50 mM ammonium bicarbonate. The resulting peptides were extracted from the gel by incubation in 50 mM ammonium bicarbonate for 15 min at 37°C followed by two incubations in 10% formic acid:acetonitrile (1:1) for 15 min at 37°C. The resulting peptides were dried in a SpeedVac, and resuspended with 17 µl of 5% acetonitrile,
Version postprint
0.05% TFA before being subjected to nanoLC-MS/MS analysis.
NanoLC-MS/MS Analysis. Peptides were analyzed by nanoLC-MS/MS using an UltiMate
3000 RSLCnano system (Dionex, Amsterdam, The Netherlands) coupled to a LTQ-Velos Orbitrap or a Q-ExactivePlus mass spectrometer (ThermoScientific, Bremen, Germany). 5 µl of each sample were loaded onto a C-18 precolumn (300-µm inner diameter x 5 mm, Dionex) at 20 µl/min in 5% acetonitrile, 0.05% Trifluoroacetic Acid (TFA). After 5 min of desalting, the precolumn was switched online with the analytical C-18 column (75 μm inner diameter × 50 cm; in-house packed with Reprosil C18) equilibrated in 95% solvent A (5% acetonitrile, 0.2% formic acid) and 5% solvent B (80% acetonitrile, 0.2% formic acid). The peptides were eluted using a 5 to 50% gradient of solvent B at 300 nl/min flow rate, with gradient length as specified in the text and Fig. S2B. The mass spectrometer was operated in data-dependent acquisition mode with the XCalibur software. For LTQ-Velos Orbitrap runs, MS survey scans were acquired in the Orbitrap on the 300-2000 m/z range with a resolution of 60000 and the 20 most intense ions per survey scan were selected for CID fragmentation and analysis in the linear trap. For Q-ExactivePlus runs, survey MS scans were acquired in the Orbitrap on the 350-2000 m/z range with a resolution of 70000, the 10 most intense ions per survey scan were selected for HCD fragmentation and resulting fragments were analyzed at a resolution of 17500 in the Orbitrap.
Protein identification and quantification. Raw MS files were analyzed by MaxQuant version
1.5.2.8. Data were searched with the Andromeda search engine against Mouse entries of the Swissprot protein database (UniProtKB/Swiss-Prot Knowledgebase release 2014_09, Mouse taxonomy, 16699 entries) and a list of potential contaminant sequences provided in MaxQuant1.5.2.8. The search included methionine oxidation and protein N-terminal
Version postprint
acetylation as variable modifications, and carbamidomethylation of cysteine as a fixed modification. Validation was performed through a false discovery rate set to 1% at protein and PSM level determined by target-decoy search in MaxQuant (with a minimum length of 7 amino acids and a minimum Andromeda score of 20 as additional filters for peptide validation). Specificity of trypsin digestion was set for cleavage after lysine or arginine, and two missed cleavages were allowed. The precursor mass tolerance was set to 20 ppm for the first search and 4.5 ppm for the main Andromeda database search. The mass tolerance in MS/MS mode was set to 0.8 Da for LTQ-Velos data and 20 ppm for Q-Exactive data. For label-free relative quantification of the samples, the “match between runs” option of MaxQuant was enabled to allow cross-assignment of MS features detected in the different runs. The minimal ratio count was set to 1 for calculation of LFQ intensities.
Experimental Design and Statistical Rationale. The data set contains mass spectrometry
results from the analysis of 7 biological replicates of Treg/Tconv cell samples purified by flow cytometry, each experiment performed from a pool of 5-7 mice. Several MS injection replicates were performed, leading to 27 raw files considered for statistical analysis. The detailed description of each analysis (raw file name, sample type, biological replicate number, MS
technical replicate number, analytical conditions) is given in Fig. S2B and supplementary
Table 1. The quantitative proteomic analysis was performed using the statistical package R (R
Development Core Team, 2012; http://www.R-project.org/) on the normalised LFQ intensities from the “proteinGroups” table of MaxQuant. Protein entries identified as potential contaminants by MaxQuant were eliminated from the analysis, as well as proteins identified with less than 2 unique peptides. After log2-transformation of the data, missing values were independently replaced for each run by its 1% quantile. For each analyzed sample, the values of the technical replicates were averaged and only the proteins quantified in a minimum of 3
Version postprint
biological replicates were subjected to the statistical analysis. We performed a two-sided paired t-test between Treg and Tconv cells. The p-values obtained for the proteins presenting a minimum 2-fold change (minimum log2 transformed fold change of 1) between the two cell populations were adjusted (Benjamini-Hochberg). Proteins were considered significantly regulated between Treg and Tconv cells when their absolute log2-transformed fold change was superior or equal to 1 and their adjusted p-value under or equal to 0.05. R scripts related to the
analysis can be found online (https://github.com/mlocardpaulet/Duguet_TregTconv_2016 -
document DuguetAnalysis_2UpepMax.html and associated scripts and tables) and a simplified outline of the analysis is presented Fig. S3.
Comparison of proteomic and expression data sets. In order to validate our approach and
build an integrated list of Treg marker proteins, our proteomic data set was compared to a “transcriptional signature” of Treg (15) and a proteomic data set of Treg and Tconv populations separated based on their CD25 expression levels (11). The expression data set was downloaded from the gene expression omnibus webpage (http://www.ncbi.nlm.nih.gov/geo/; GSE7460). Gene identities were retrieved from the `moe430-20` Affymetrix Mouse Genome 430 2.0 Array (Annotation: GPL1261) in December 2015. We calculated the log2-transformed (Treg/Tconv) ratio using normalised quantities and were able to plot them against our proteomic log2-transformed fold changes for the 3657 unique genes present in the two data sets. For Barra et al.’s data set, we used the supplemental table 1, retrieved the updated protein Uniprot Accession entries using Uniprot ID mapper (http://www.uniprot.org/uploadlists/) and proceeded as described for 3611 proteins present in both Barra et al.’s data set and ours. R scripts related to
the analysis can be found online (https://github.com/mlocardpaulet/Duguet_TregTconv_2016
Version postprint
Proliferation analysis by Cell Trace Violet staining. For proliferation assays, Treg
populations (CD4+CD62LhighCD25bright) were sorted based on the expression of the endogenous
CD25 and CD62L markers to exclude contamination by activated Tconv cells. This population
contains more than 99% of Foxp3+ T cells (Fig. S4). Tconv, CD4+CD62LhighCD25- naive T
cells, were purified from wild type (WT) mice and were cultured in 96-well round-bottomed
plates in the presence of CD4+CD62LhighCD25bright Treg cells purified either from WT mice or
Themis1-Tg mice. To assess the number of cell divisions, CD4+CD62LhighCD25- T cells were
initially resuspended at 10x106 cells/mL in phosphate-buffered saline (PBS), incubated with 2
mM of Cell Trace Violet (life Technologies) at 37°C, and washed in 5% foetal calf serum
(FCS)-PBS. Cell Trace Violet-labeled cells were cultured with CD4+CD62LhighCD25bright T
cells at different ratio, in presence of 8 µg/mL of anti-CD3 (biolegend), and 12x104 irradiated
splenocytes. The incorporation of Cell Trace Violet was measured by flow cytometry after 3 days of co-culture.
Quantification of mRNAs by real-time PCR. Total RNA was extracted using the RNeasy kit
(Qiagen, Germantown, MD, USA) according to the manufacturer’s instructions. cDNA generated by SuperScript III (Life Technologies Ltd) were analyzed using primers for the indicated genes. Real-time PCR was performed using SYBR green. Results were normalized to ß2-microglobulin expression levels. The primers used were as follows:
Themis1 F: 5’-TGAAATCCAAGGTGTGCTGA-3’; Themis1 R: 5’-CGTCCGTAGACAGCAACTGA-3’; ß2m F: 5’–ACATACGCCTGCAGAGTTAAGCAT-3’; ß2m R: 5’–CGATCCCAGTAGACGGTCTTG- 3’.
Version postprint
qPCR was performed using LightCycler 480 (Roche).
Immunoblot analysis. Total cellular proteins from purified Tconv and Treg were extracted by
the addition of a twice-concentrated lysis buffer (2% n-dodecyl-β-maltoside, 10% glycerol, 100 mM Tris pH 7.5, 270 mM NaCl, 1 mM EDTA pH 8) supplemented with protease and phosphatase inhibitors. After 10 min of incubation on ice, cell lysates were centrifuged at 20000 g for 15 min at 4° C. Eluates were completed with laemmli buffer and resolved by SDS-PAGE followed by Western Blotting on Immobilon-P membranes (Millipore) using Themis1 antibody (Millipore) as well as Gapdh (Sigma) for loading control. Immunoreactive bands were detected by chemiluminescence with the SuperSignal detection system (Pierce Chemical, Rock-ford, IL).
Induction and evaluation of colitis. CD4+ T cells were enriched from spleen and lymph node cell suspensions using a CD4 negative selection kit (Dynal) before staining with TCR, anti-CD4, anti-CD25 and anti-CD45RB mAbs. CD4+CD25-CD45RBhigh colitogenic T cells and
CD4+CD25bright Treg cells were then separated by fluorescent cell sorting. The purity of sorted
cells is shown in Fig. S5. Colitis was induced in 6-week-old Rag2-/- mice by intravenous
injection of 4x10⁵ naive CD4+CD25-CD45RBhigh WT colitogenic T cells in 100 µL of PBS. In
the cotransfer experiments 2x10⁵ or 105 CD4+CD25bright Treg from WT or Themis1-Tg mice
were cotransferred with 4x10⁵ naive CD4+CD25-CD45RBhigh WT colitogenic T cells.
Macroscopic colonic tissue damage was evaluated using a scale ranging from 0 to 11 as follows: erythema (0 to 2), edema (0 to 2), strictures (0 to 3), ulceration (0 or 1), mucus (0 or 1), and adhesion (0 to 2). Colon wall thickness was measured with an electronic caliper. Colonic tissue specimens were excised 2 cm proximal to the cecum and immediately transferred into 10% formaldehyde to be embedded in paraffin. Five-micrometer colonic sections were then stained
Version postprint
with haematoxylin and eosin. Each Slide was scored twice (blind readings) by a single pathologist. Infiltration in the muscular layer, chorion and mucosa were independently scored using a semi quantitative scale (0: no infiltration; 5: severe infiltration). The nature of the infiltrating cells (mono-nucleated/ poly-nucleated cells) was assessed.
Data analysis. Unless otherwise specified, data are expressed as mean ± s.e.m. The GraphPad
Instat statistical package was used for statistical analyses (GraphPad Software, Inc., La Jolla,
CA USA). Results were compared using Mann–Whitney test. Results were considered
Version postprint
Results
Purification and mass spectrometry analysis of regulatory and conventional T cell
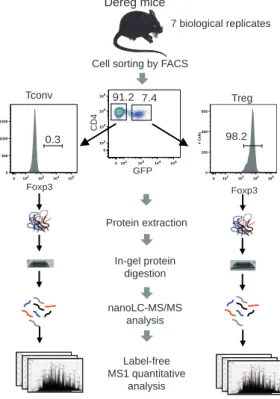
subpopulations. The most unambiguous Treg cell marker currently known is Foxp3, which is expressed specifically in mouse CD4+ Treg cells (16). To define a specific “signature” of the
Treg subpopulation at the proteomic level, we used the DEREG mouse model expressing a diphtheria toxin receptor-enhanced green fluorescent fusion protein (DTR-eGFP) under control of the endogenous Foxp3 promoter (13). In this model, Treg specifically express DTR-eGFP, allowing fluorescent detection and very efficient purification of Foxp3+ Treg cells by FACS
sorting independently of CD25 expression. Post-sorting verification by intracellular staining of Foxp3 indicated a purity >99% in Foxp3+ cells among all sample preparations (Fig. S1).
Although selection through the GFP marker increases the recovery yield of Treg cells, this population represents only a very minor percentage of the total CD4+ T cells, and we typically
isolated around 1.5-2 x 10⁵ Treg cells per mouse. In order to optimize protein extraction, we
lysed the cells with a strong detergent concentration (4% SDS) combined to sonication. This led to 5 to 10 µg of proteins per sample (from a pool of 5-7 mice). Total protein amounts from Treg and Tconv cell populations were then normalised, samples were trypsin-digested and analyzed in parallel by mass spectrometry using the label-free quantitative analytical workflow described in Fig. 1. In order to increase the Treg and Tconv proteome coverages using low amounts of starting material, several experimental workflows involving or not fractionation of the sample, and using different LC gradient lengths, were tested (Fig. S2A). The highest number of protein identification per run was obtained with a single run analysis of total cell extracts, using a 50 cm reversed-phase column packed in house and a long LC gradient (480min on a LTQ-Velos Orbitrap) to improve chromatographic separation of peptides. This protocol
Version postprint
was thus followed for a total of 27 analytical runs (7 biological replicates and up to 3 technical replicates, Fig. S2B) with a gradient length adapted to the sequencing speed of the instrument (i.e. 480min on the LTQ-Velos Orbitrap and 300min on the Q-Exactive). Resulting raw files were simultaneously processed through MaxQuant, which performed realignment and LFQ normalization of MS intensity signals for all identified proteins. Database search with Andromeda (1% FDR validation at peptide and protein level) led to the identification of 4345 unique protein groups identified in the whole, including 3998 proteins identified with a minimum of two unique peptides. Amongst these, we retained for further statistical analysis 3974 proteins which were quantified in a minimum of 3 independent experiments in the Tconv or the Treg samples. This dataset was controlled for high reproducibility, with Pearson correlation coefficients on log2(LFQ) protein intensities typically in the range 0.92-0.98 for runs performed on different samples of the same cellular type and CVs calculated across biological replicates lower than 10% for 99% of the proteins (median of CVs around 2%), showing good reproducibility of the label-free measurement (Fig. S6). An outline of the data processing steps and statistical analysis is shown in Fig. S3. The final list of quantified proteins, along with their statistics in the Treg/Tconv comparison, is shown in supplementary Table 1, and the entire dataset including raw MS files and MaxQuant output files has been deposited to the ProteomeXchange Consortium (17) via the PRIDE partner repository with the dataset identifier PXD004436.
Proteomic analysis identifies potentially new markers of the Treg lineage. Based on the label-free quantitative data, statistical analysis was performed to classify proteins specifically up- or down-regulated in Treg compared to Tconv cells in order to generate an updated list of Treg cell markers. A two-sided paired t-test was performed on the 7 biological replicates and
Version postprint
the proteins presenting a Benjamini-Hochberg adjusted p-value under or equal to 0.05 and a minimum 2-fold change (minimum log2-transformed fold change of 1) between Treg and Tconv were considered significative. According to these criteria, we identified a total of 169 differentially expressed proteins, 113 more abundant in Treg and 56 less abundant in Treg compared to Tconv (Fig. 2A and supplementary Table 2). The log2-transformed LFQ values of the 40 most up-regulated and the 40 most down-regulated markers are presented in Fig. 2B, and were highly consistent across the 7 experiments that were performed with 7 distinct pools of mice. Fig. 2C shows their mean log2-transformed ratio between Treg and Tconv, which was comprised between 2 and 6 (linear fold change comprised between 4 and 64). Most of the “historical” markers commonly used to characterize Treg cells were identified amongst this list of highly regulated targets. We identified Foxp3, the master transcription factor regulating Treg phenotype and function, and CD25 that is constitively expressed by Treg cells (16, 18). The zinc finger proteins Helios/IKZF2 (19) and Eos/IKZF4 (20) were also up-regulated in the Treg cells in our data set, together with the tumor necrosis factor superfamily receptors OX40/Tnfrsf4 (21) and GITR/Tnfrsf18 (22); and cell surface proteins such as Neuropilin1/Nrp1 (23), P2X purinoceptor 7/P2rx7 (24), the Folate receptor 4/Folr4 (also known as Sperm-egg fusion protein Juno/Izumo1r), and the ecto-5'-nucleotidase/Nt5e (CD73) (25). Conversely, proteins known to be under-expressed in Treg were significantly down-regulated in our data set (Fig. 2C). These include for example the DNA-binding protein SATB1, a transcription factor whose down-regulation in Treg was previously shown to be important for Treg phenotype (10). Fig. 3A schematically illustrates the cellular functions of proteins differentially regulated in
CD4+Foxp3+Treg compared to CD4+Foxp3-Tconv, as characterized in the present study, based
on their corresponding GO term annotations. We could detect many cell surface membrane proteins up-regulated in Treg, the most induced ones being the classical markers quoted above
Version postprint
(CD25; P2X7; OX40; JUNO; GITR; CD73). In addition to those, integrin beta-1/Itgb1 (CD29) was also found to be strongly up-regulated, as well as a panel of cell surface molecules with smaller, but significant fold changes between Treg and Tconv. These include the Signaling Lymphocytic Activation Molecule/Slamf1 (CD150), tumor necrosis factor receptor superfamily member 6/Fas (CD95), T-cell surface antigen CD2/Cd2, CD44 antigen/Cd44 and CD48 antigen/Cd48. In addition to the transcription factors FOXP3, HELIOS and EOS, we also detected nuclear proteins over-expressed in Treg such as the DNA-binding factors interferon regulatory factor 4/Irf4, the NF-kappa-B subunits Proto-oncogene c-Rel/Rel and Nuclear factor NF-kappa-B p100 subunit/Nfkb2. Conversely, in addition to SATB1, other transcription factors were found down-regulated, namely the transcription factor 7/Tcf7, lymphoid enhancer-binding factor 1/Lef1 and DNA-enhancer-binding protein Ikaros/Ikzf1. Other intracellular molecules involved in various functions such as cytoskeleton organization, metabolic processes, cell cycle control or apoptotic processes were also found differentially expressed in the two cellular subsets of CD4+ T cells. Markedly, only a few proteins involved in TCR signaling were
differentially regulated between Treg and Tconv. These include the actin-uncapping protein RLTPR (up-regulated in Treg), and the TCR signaling molecules ITK (Tyrosine-protein kinase ITK/TSK) and Themis1 (both down-regulated in Treg). Beside the molecules already described in the literature to be involved in Treg commitment or functions, our study allowed the identification of other proteins with a marked difference in abundance between Treg and Tconv, and which functions are not yet characterized in these cells. Figure 3B and 3C present a selection of such uncharacterized markers that could be added to the set of known markers of Treg cells and could be good candidates for follow-up studies of T cells mechanisms and functions.
Version postprint
We finally compared the results of our analysis performed on CD4+Foxp3+ Treg with other
available data on Treg, namely a recently published proteomic study performed on FACS sorted CD4+CD25+ and CD4+CD25- murine T cells (11) and transcriptomic data set obtained from
murine T cells, also sorted on CD25 (15). To avoid selection biases due to the different statistical methods used in each case, we first applied a simple selection criteria based on a 2-fold change between the Treg/Tconv subsets, and retrieved the proteins or mRNA quantified as variant in at least 2 of the 3 considered studies, i.e. this study (7 biological replicates), Barra et
al.’s proteomic data set (4 biological replicates), and the transcriptomic data set (3 biological
replicates). This first selection procedure retrieved 138 gene products showing consistent differences between Treg and Tconv in a minimum of 2 independant studies (supplementary Table 3). The top 50% of these proteins/genes, based on their mean log2-transformed fold change accross all studies, are shown in Fig. 4. Depending on the data processing method and statistics applied in each study, proteins/genes were reported or not as differentially expressed, as indicated in Fig. 4. A panel of 30 genes were consistently found significantly regulated in all 3 datasets (supplementary Table 3), both at mRNA and protein level (the later confirmed by both proteomic studies), representing highly reliable Treg/Tconv markers. These include FOXP3, Niban/FAM129A, GSTO-1 and Coronin-2A among the most overexpressed hits in the Treg, and Themis1, ITK, SATB1 and TCF7 among the most underexpressed hits in Treg. 14 proteins found significantly regulated in Barra et al’s data set and in the transcriptomic study were not detected (such as IL-2RB, CD86) or did not pass the statistical criteria (SWAP-70) in our analysis. Conversely, a subset of 24 proteins were reported as significantly regulated in our study and the transcriptomic dataset, but not in the dataset of Barra et al (including IL2-RA/CD25, Helios/IKZF2, IRF4, OX40/Tnfrsf4 or JUNO/Folr4). This discrepancy could be explained by several technical reasons. Some proteins were simply not detected, like for
Version postprint
example IRF4 or OX40/Tnfrsf4. Also, proteins highly specific of one cellular subset and undetectable in the other would not have a reported ratio due to dimethyl labelling used in that study (like IL2-RA/CD25 that shows no detectable signal in most of he CD25- samples).
Finally, a set of 25 proteins were repeatedely found as variant in both proteomic studies, while showing no significant variation at mRNA level (such as RLTPR), indicating that post-transcriptional mechanisms may be involved in their regulation. In conclusion, the combined analysis of these three high quality data sets (supplementary Table 3) provides a strong list of markers of the Treg and Tconv cell populations.
Overexpression of Themis1 in Treg enhanced their suppressive functions. Out of the 3974 quantified proteins, Themis1 appeared as one of the 10 most strongly down-regulated proteins in Treg cells when proteins were classified based on their intensity ratio (Tconv/Treg ratio=3.97). Out of these, it was the most abundantly expressed in Tconv (as can be roughly assessed based on spectral count or iBAQ values, see Supplementary Table 1) and had the lowest p-value (corrected p-value of 3.40 10-5), indicating a very consistent measurement of
Themis1 as an up-regulated molecule in Tconv compared to Treg. Additionnally, among possible candidates for validation and functional analysis, Themis1 and ITK (both in the top-10 downregulated proteins in Treg) appeared as interesting biological targets for being already described to play a role in immune cells, particularly in TCR signaling. In this regards, previous studies on TCR signaling have highlighted its importance for Treg development and functions (26-29). Interestingly, recent data indicate different TCR signal transduction mechanisms in Treg and Tconv cell populations, with attenuation of some pathways and signaling nodes in Treg (30). Although Themis1 was recently shown to be essential for T cell development in the thymus, its role in peripheral T cell function is still ill defined (31-34). Themis1 takes part in
Version postprint
TCR signaling but its role as a positive or negative regulator of this pathway is not fully elucidated (35, 36). Herein, we showed that Themis1 expression was not abolished in Treg, but maintained at a much-reduced level compared to Tconv, suggesting that the tight control of Themis1 level in the CD4+Foxp3+subset might have a functional relevance. We confirmed by
immunoblot that the protein Themis1 is less abundant in Treg than in Tconv (Fig. 5A) and we showed that Treg express low amounts of Themis1 mRNA compared to Tconv, which indicates a transcriptional regulation of this gene in Treg (Fig. 5B).
To examine the functional impact of Themis1 expression on Treg development and suppressive functions, we used Themis1 transgenic mice (Themis1-Tg) in which Themis1 expression is driven by the human-CD2 promoter. This model, in which the expression of Themis1 in Treg is increased, was selected to perform gain-of-function experiments and assess wether changing the physiological level of Themis1 impacts Treg phenotype and suppressive activity. Of note, the abundance of Themis1 in Themis1-Tg Treg cells is approximately three fold higher than in wild-type Treg cells, but is similar to the abundance of Themis1 in wild-type Tconv cells (Fig. 5A). At mRNA level, Themis1 expression in Themis1-Tg Treg cells is also higher than in WT Treg and WT Tconv cells (Fig. 5B). We compared by flow cytometry the frequency, the absolute numbers and the phenotypic markers of Treg between WT and Themis1-Tg mice and showed that the overexpression of Themis1 had no major impact on the development of thymic and peripheral Treg (Fig. 5C and 5D) and on the expression of the main peripheral Treg markers such as Foxp3, CD25, CD39, CD73, CD103, Cytotoxic T-lymphocyte protein 4/CTLA4, GITR and Interleukin-7 receptor subunit alpha/Il7r (CD127) before (Fig. 5E) and after TCR engagement (Fig. S7).
To examine the effect of Themis1 overexpression on the immunosuppressive function of Treg cells in vivo, we used a well-defined adoptive transfer model (37), which involved cotransfer
Version postprint
of CD4+CD25-CD45RBhigh colitogenic T cells together with Treg cells purified from either WT
or Themis1-Tg mice (Fig. 6A). First, we controlled that Themis1 overexpression had no impact
on the percentage of Foxp3 expressing cells among CD4+CD25bright sorted Treg, nor on the
level of Foxp3 expression (Fig. S5). As expected, adoptive transfer of only CD4+CD25
-CD45RBhigh colitogenic T cells into Rag2-/- mice induced severe colitis as assessed by
macroscopic score and weight loss, starting from 3 weeks after transfer (Fig. 6B and C, Fig.
S8A and B). This was associated with pronounced inflammatory cellular infiltration in the
mucosa and submucosa, as well as significant epithelial destruction (Fig. S8C). These
pathological phenotypes were efficiently blocked when colitogenic CD4 T cells were co-transferred with either WT Treg cells or Themis1-Tg Treg at an optimal ratio of 1:2 between Treg and colitogenic T cells (Fig. S8). To reveal a possible difference in the suppressive
capacities of WT Treg and Themis1-Tg Treg cells, we then chose a suboptimal 1:4 ratio
between Treg and colitogenic CD4 T cells that did not prevent completly the inflammation of
the colon. Although we could not detect any difference in weight loss between animals injected
with the two different types of Treg (Fig. 6B), we demonstrated by macroscopic evaluation of colonic tissue damage that Themis1-Tg Treg cells exhibited an enhanced ability to suppress the pathological activity of colitogenic CD4 T cells. This was associated with a significant decrease in colonic wall thickness, suggestive of a decreased inflammation in the colon (Fig. 6C). These
observations suggest that Themis1-Tg Treg exhibit an enhanced suppressive activity in vivo. To directly assess the immune-suppressive activity of Themis1-Tg Treg cells, we used an in
vitro suppression assay using Treg cells purified from the spleen and lymph nodes of either WT
or Themis1-Tg mice on the basis of their expression of high levels of CD25 and CD62L. This population contains more than 99% of Foxp3+ T cells (Fig. S4). These cells were co-cultured
Version postprint
with Cell Trace Violet (CTV) labeled WT CD4+ Tconv cells, in order to assess the capacity of
Treg cells to control the proliferation of Tconv cells in co-culture (Fig. 6D). As expected, in the absence of Treg cells, Tconv cells actively proliferate as assessed by the important proportion of divided cells (77,6%) monitored by the dilution of CTV. The addition of WT Treg cells decreased the proliferation of Tconv cells depending on the Treg:Tconv cell ratio. Interestingly, Treg cells from Themis1-Tg mice showed an enhanced ability, compared to WT Treg cells, to suppress TCR-stimulated proliferation of coexisting Tconv cells (For example at ratio 1:16 of Treg:Tconv cells, the percentage of divided cells is 62,9 % with WT Treg cells and 45.5% with Themis1-Tg Treg cells). Such difference was reproducibly observed at all ratio tested (Fig. 6E and F). This enhanced suppressive effect was associated with an accumulation of Themis1-Tg at the end of the 3-days co-culture. Indeed, the number of Foxp3+ Themis1-Tg
Treg cells was significantly increased compared to the number of Foxp3+ WT Treg at the end
of the co-culture for the ratio 1:8 and 1:16 (Treg:Tconv) (Fig. 6G). We compared the proliferation, using Cell Trace Violet dilution, of WT and Themis1-Tg Treg cells co-cultured in vitro with Tconv cells at different ratios and showed that both populations proliferate in a similar way (data not shown). These results suggest that the increased numbers of Themis1-Tg Treg did not result from an increase of their proliferative capacity.
Collectively, these data show that overexpression of Themis1 in Treg cells enhances their suppressive functions both in vitro and in vivo suggesting that this protein represents a checkpoint control of the suppressive function of Treg cells.
Version postprint
Discussion
Treg cells are defined by the expression of the transcription factor Foxp3, necessary for their development and functions (2-5, 38). Besides Foxp3, other intrinsic factors have been shown to contribute to the Treg suppressive function (15, 39). The identification of such specific molecules is of paramount importance for devising effective therapeutic strategies in the context of autoimmunity or cancer. Shotgun proteomic approaches applied to the large-scale analysis of complex proteomes are continuously progressing in terms of proteomic depth and accuracy of relative quantification. In recent years, such approaches have been successfully applied in the field of immunology to characterize several cellular subsets such as dendritic cells (40, 41), macrophages (42), natural killer cells (43) and cytotoxic T cells (44). Here, we used a global quantitative mass spectrometry workflow to characterize the proteomic composition of Treg (Foxp3+CD4+ T cells) and Tconv (Foxp3-CD4+ T cells) across 7
independent experiments. Through label-free quantification and stringent statistical analysis, we revealed the differential expression of 169 proteins, including most classical protein markers already used to characterize Treg cells, being either cell surface proteins (CD25; CD73/Nt5e; P2X7; OX40/Tnfrsf4; JUNO/Folr4; GITR/CD357/Tnfrsf18) or nuclear proteins (FOXP3, Helios/Ikzf2, Eos/Ikzf4), thereby confirming the efficiency of the quantitative approach. In addition, we identified a significant variation of the expression level of a large number of additional proteins that might have a functional impact on Treg functions. This is the case for example of RLTPR, an actin-uncapping protein that was shown to be essential for costimulation of the TCR via CD28 (45). Interestingly, the development of thymic Treg cells was severely impaired in mice bearing a mutation on Rltpr. In addition, Rltpr was reported to be down-regulated in psoriatic patients (46), and polymorphisms in Rltpr are associated with ankylosing spondylitis in humans (47), suggesting that it may play a role in autoimmunity. Consistent with
Version postprint
our study showing that it is up-regulated in Treg, these data suggest that the RLTPR protein may participate to the development and to the suppressive function of Treg cells. Interestingly, other proteins known to be involved in the regulation of actin structure organization were also found to be either up-regulated (Coronin-2A/Coro2a, Macrophage-capping protein/Capg) or down-regulated (for instance Filamin-interacting protein FAM101B/Fam101b also known as RefilinB) in Treg. This suggests a potentially important role in the mechanisms driving cytoskeleton architecture and actin remodeling, which are known to be actively taking part in TCR signaling. Further studies would be needed to investigate the mechanisms and function of these proteins.
More importantly, many proteins presenting a significant difference between Treg and Tconv cells in our data set have either no clear reported function, or were not studied at all in the context of T cell biology. For example, the biological function of Coronin-2A/Coro2a is not well understood. A recent study showed that it is a component of the nuclear receptor co-repressor complex (NCoR) and functions in macrophages to release inflammatory response genes by a mechanism involving interaction with oligomeric nuclear actin (48). Whether Coronin-2A could also play such a regulating role in Treg cells remains to be demonstrated. It is also interesting to mention that some proteins showed a very strong fold change between Tconv and Treg in our study, such as the protein Niban/Fam129a, which was reproducibly found to be specifically expressed in Treg at a level comparable to that of FOXP3. Thus, Niban could be considered as a very characteristic marker of Treg compared to Tconv, and further functional characterization would be needed to investigate its potential implications in the suppressive functions of Treg.
In the course of this work, two other proteomic studies on Treg cells were reported. Barra et al. performed a comparative study of FACS sorted CD4+CD25+ and CD4+CD25- murine T cells,
Version postprint
using isotopic dimethyl labeling and separation of peptides with offgel isoelectrofocusing (11). They could identify about 5000 proteins from 4 biological experiments, and quantify more than 4000 of them in a minimum of 2 replicates. On the other hand, Procaccini et al. performed a study on human Treg cells isolated from blood, and identified about 1900 proteins after MudPit analysis, which were compared with those found in Tconv cells using an in-house method for semi-quantitative analysis (49). This later study reported differences mainly related to cellular metabolism, with an up-regulation of glycolysis-related enzymes in freshly-isolated human Treg cells, such as Glyceraldehyde-3-phosphate dehydrogenase (Gapdh), Phosphoglycerate kinase 1 (Pgk1), Transaldolase (Taldo1) or Fructose-bisphosphate aldolase A (AldoA), while Tconv appeared to express higher amounts of mitochondrial proteins such as Isocitrate dehydrogenase (Idh2), Aconitase 2 (Aco2), Citrate synthase (Acly), Electron transfer flavoprotein (Etfa), Voltage-dependent anion channel 1 (Vdac1), Solute carrier family 25 (Slc25a3) or ATP synthase subunit b (Atp5f1). In our study, we did not detect such major metabolic changes in the two subsets of CD4+ T cells isolated from mouse. This may be due to
the different nature and origin of the Treg samples analyzed, which may present discrepant metabolic status, or alternatively to the differences in the techniques of protein analysis and quantification used in the two studies. By contrast, our proteomic analysis of CD4+Foxp3+
murine cells recapitulates many protein variations described by Barra et al in CD4+CD25+
murine cells (3367 common proteins were quantified in the two data sets). As shown in supplementary Table 3, a panel of 33 high-confidence Treg or Tconv markers were reproducibly identified in both proteomic studies and were also shown to be regulated at mRNA level by transcriptomic analysis (15). Interestingly, our statistical analysis of 7 independent replicates allowed the identification of 23 additional differentially regulated proteins (corresponding to genes also regulated at mRNA level) that were not significantly regulated in
Version postprint
Barra et al data set. Some were identified with no quantity ratio reported in their study (like the Interferon regulatory factor 4/Irf4 or the Folate receptor 4/Folr4), while others were not identified at all (such as OX40/Tnfrsf4, Ikzf4/Eos) or didn’t pass the p-value criteria to be reported as regulated (such as Helios/IkZF2, Annexin A4/Anxa4 or Lysocardiolipin acyltransferase 1/Lclat1). It is worth noticing that a panel of proteins were consistently characterized as differentially expressed in the two proteomic studies, while being not previously reported in the typical Treg signature established based on previous microarray analysis (15), such as RLTPR, Nuclear factor NF-kappa-B p100 (Nfkb2) or c-Rel. Overall,this comparison allowed a synthetic representation of expression changes at protein and mRNA levels in Treg compared to Tconv cells. Through the compilation of the results obtained with several biological replicates using different methods of Treg isolation, it was possible to identify the proteins that are very consistently differentially regulated in all studies and should be considered as strong specific markers, and possibly, as promising candidates for functional studies when their role in Treg is not described yet. In addition, the integration of these results allowed to rescue some interesting candidates that would not be identified or not considered as statistically significant in a particular single study.
It is known that Treg cells require stimulation via the TCR in order to be fully functional (27). Although the importance of Treg for immune tolerance is well recognized, our knowledge is particularly limited with respect to intracellular signaling molecules that regulate/modify Treg functions upon TCR engagement. Themis1 has recently been described as a new component of the TCR signaling machinery that is critical for the positive and negative selection of T cells in the thymus (31-34, 50). Following TCR engagement, Themis1 is phosphorylated by the src family kinase LCK, and is recruited to the transmembrane adaptor protein LAT (Linker for activation of T-cells family member 1) (14, 51). However, it remains unclear whether Themis1
Version postprint
acts as a positive or negative regulator of TCR signaling. Indeed, while initial investigations failed to pinpoint a major alteration in TCR signaling in Themis1-deficient thymocytes, the defect of T cell development in Themis1-/- mice suggested that Themis1 might act as an enhancer of TCR signaling (31-34, 50). Contrasting with this interpretation, two recent reports suggest that Themis1 acts as an attenuator of TCR signaling in thymocytes, by reducing the signaling threshold between positive and negative selection (35, 52). Themis1 was shown to bind to the inhibitory phosphatase SHP-1/Ptn6 (also known as Tyrosine-protein phosphatase non-receptor type 6) and was proposed to act as an adaptor protein that recruits SHP-1 in the vicinity of proximal TCR signaling complexes, to dephosphorylate them and reduce TCR signal strength (35, 52). However, more recently, through the use of TCR signaling reporter mice, a study conversely identified Themis1 as an enhancer of TCR signaling during the positive selection of thymocytes (36). This positive effect of Themis1 was proposed to be mainly mediated through the guanine nucleotide exchange factor Vav1, a protein shown by quantitative mass spectrometry analysis to be a major component of the Themis1 interactome in thymocytes, together with the Growth factor receptor-bound protein 2/Grb2 and SHP-1 (36). Therefore, Themis1’s mechanisms appear to be quite refined, with potentially a dual function as a negative regulator of TCR signaling through SHP-1, and a positive regulator of TCR signaling through Vav1.
In this study, through proteomic analysis and complementary functional studies of Themis1 overexpression in Treg, we made several important observations. First, we identified Themis1 as the only TCR signaling molecule, together with ITK, under-represented in Treg. Second, by using Themis1-Tg mice, we showed that the overexpression of Themis1 in Treg (to a similar level as in Tconv) did not modify their expression of Foxp3 but increased their suppressive potential in an in vivo model of IBD. Third, through an in vitro approach, we directly
Version postprint
demonstrated that the overexpression of Themis1 in Treg increased their ability to prevent the proliferation of Tconv cells. Finally, we showed that the increased efficacy of Themis1-Tg Treg in vitro is associated with an accumulation of Treg cells. We obtained similar results in vivo in the model of colitis, although the differences did not reach statistical significance (data not shown). As this increased number of Themis1-Tg Treg did not result from an increase of their proliferative capacity, we postulate that it is probably due to enhanced T cell survival, since recent studies showed that Themis1-SHP1 promotes T cell survival (52).
In light of previous studies suggesting that the suppressive abilities of Treg, but also their survival capacity, is correlated with the strength of TCR signaling (26-29), our data obtained with the Themis1-Tg mice suggest that, in Treg, Themis1 may rather act as an enhancer than as an attenuator of TCR signaling. While SHP-1 was proved before to be an endogenous inhibitor of the suppressive ability of Treg (53), our data do not fit with a simple model where Themis1 would recruit SHP-1 to TCR signaling complexes to negatively regulate the TCR pathway and Treg suppressive function. Alternatively, it could be hypothesized that the positive effect of Themis1 on Vav1 may be preponderant in these cells, and may counterbalance potential inhibitory function of Themis1 through SHP-1. Supporting this interpretation, we previously showed that the combined deficiency of Themis1 and Vav1 in Brown-Norway rats impairs the suppressive function of Treg, despite normal levels of Foxp3 expression, and leads to the spontaneous development of IBD (54, 55). This highlights that the cooperation between Themis1 and Vav1 is required for proper Treg function.
On the other hand, our proteomic data showed that the endogenous expression of Themis1 is maintained at low level in Treg compared to Tconv. This would be consistent with a recent report showing that TCR signals are naturally tuned down in Treg cells (30). In the later study,
Version postprint
the authors demonstrated that activation of several pathways and signaling nodes are broadly dampened upon TCR-mediated activation in Treg compared to Tconv. In an attempt to determine the origin of this attenuated signaling, they considered as possible candidates some inhibitory molecules known to be overexpressed in Treg cells, such as the T-cell surface glycoprotein CD5, CTLA-4, Programmed cell death protein 1/Pdcd1 (also known as PD-1) or the Dual specificity protein phosphatase/Dusp4, but could not confirm their role in the negative regulation of TCR signaling in Treg cells. In light of the present results, an alternative possible mechanism could be the specific down-regulation of activating molecules in Treg – such as Themis1– that would tune down TCR signaling in these cells.
In conclusion, through the characterization of the Treg proteome, the present study identified several new proteins that aredifferentially expressed between Treg and Tconv cells. We thus provide promising candidates for future functional characterization in order to decipher their implication in the suppressive functions of Treg cells. This will provide a whole new set of molecular targets for therapy aiming at controlling Treg functions in conditions such as chronic viral disease, graft-versus host disease and autoimmunity. More specifically, we showed that Themis1 – under-expressed in the Treg population – positively regulated the Treg suppressive function and could act as a postive regulator of TCR signaling in Treg. The specific down-regulation of Themis1 in Treg cells may be important to avoid excessive suppressive activity, thereby ensuring the development of an efficient effector immune response against pathogens and tumors. This protein, previously identified as a potential candidate gene for immune mediated diseases such as celiac disease (56-58) and multiple sclerosis (59), could thus represent a checkpoint control of the suppressive function of Treg.
Version postprint
Figures legends
Figure 1: Label-free quantitative analysis of conventional and regulatory T cell proteomes. General analytical workflow based on cell sorting by flow cytometry using the DEREG mouse model and parallel proteomic analysis of Tconv and Treg cell populations by nanoLC-MS/MS and label-free relative quantification.
Figure 2: Proteomic analysis of Foxp3+ regulatory T cells. A. Volcano plot showing proteins differentially regulated in Treg compared to Tconv in 7 independent experiments. Proteins with a Benjamini-Hochberg adjusted p-value ≤0.05 were considered significantly regulated if they presented a log2-fold change ≥1 (in orange) or ≤-1 (in cyan) (correspond to a 2-fold change of protein quantity). Proteins considered as well-characterized markers of Treg are shown in red (up-regulated proteins) and dark blue (down-regulated proteins) with their corresponding gene names. Themis1 is indicated in yellow. B. Heatmaps of Tconv (left) and Treg (right) log2-transformed LFQ intensities retrieved from MaxQuant for the 40 most up- or down-regulated proteins in the Treg cells (top and bottom, respectively). The columns correspond to the mean of technical replicates for the 7 independent experiments and proteins are ranked by decreasing mean intensity in the Treg cells. Gene names are indicated on the left, with marker proteins historically used to differentiate Treg from Tconv in red. C. Barplot of the log2-transformed fold changes (Treg/Tconv) of the 40 most up- or down-regulated proteins in the Treg cells (top and bottom, respectively). Historical marker proteins known to be more abundant in Treg compared to Tconv are in red, and those known to be less abundant in Treg are colored in dark blue. All the regulated proteins are indicated by their gene name.
Figure 3: Schematic representation of the Treg proteomic signature. A. Schematical representation of the proteins differentially regulated in CD4+Foxp3+ Treg compared to
Version postprint
CD4+Foxp3-Tconv. The proteins were organized based on their GO term annotations. B and
C. Boxplots of the log2-transformed MS intensities (LFQ values) of the 5 most up- (B) and down- (C) regulated proteins in Treg cells. Each point corresponds to a biological replicate. Gene names are presented on top of each graph.
Figure 4: Comparison of transcriptomic and proteomics Treg data sets.
Tile map of the log2-transformed relative quantification (Treg/Tconv) in our data set (i), the Treg and Tconv data from the transcriptomic data set Hill et al. 2007 mapped to the
`moe430-20` Affymetrix Mouse Genome 430 2.0 Array (Annotation: GPL1261) (ii) and the proteomic
dataset from Barra et al. 2015 (iii). The top 50% of proteins/genes that presented a 2-fold change between Treg and Tconv in 2 or 3 of the data sets are presented ordered with decreasing log2-transformed fold change (missing values are in grey). Known markers are highlighted in red. Symbols on the right indicate if the genes/proteins that were considered as significant hits by the authors according to their statistical thresholds. The numerical values of this figure can be found in the supplementary table 3.
Figure 5: Overexpression of Themis1 in Treg does not affect their development or phenotype at steady state. A. Immunoblot analysis of Themis1 and Gapdh quantities in Treg and Tconv isolated from WT mice and Themis1-Tg mice (left) and the densitometric quantification of Themis1 expression normalized with Gapdh (right; from 2 independent experiments). B. Relative quantification of Themis1 mRNA levels in Treg and Tconv relative to ß2-microglobulin (from 4 independent experiments). C and D. Frequency and absolute
numbers of CD4+CD25+ and CD4+Foxp3+ cells among CD4+ T cells from thymus (C) and
spleen (D) collected from WT mice (n=5) and Themis1-Tg mice (n=7). The results are presented as mean ± SEM. E. Mean fluorescence intensity (MFI) of selective markers expressed by CD4+Foxp3+ T cells in the spleen from WT mice and Themis1-Tg mice (n=4). ns,
non-Version postprint
significant. In C and D, the data are representative of two independent experiments. Non parametric test **p ≤0.01; ***p ≤0.001. WT mice (WT) and Themis1-Tg mice (Tg).
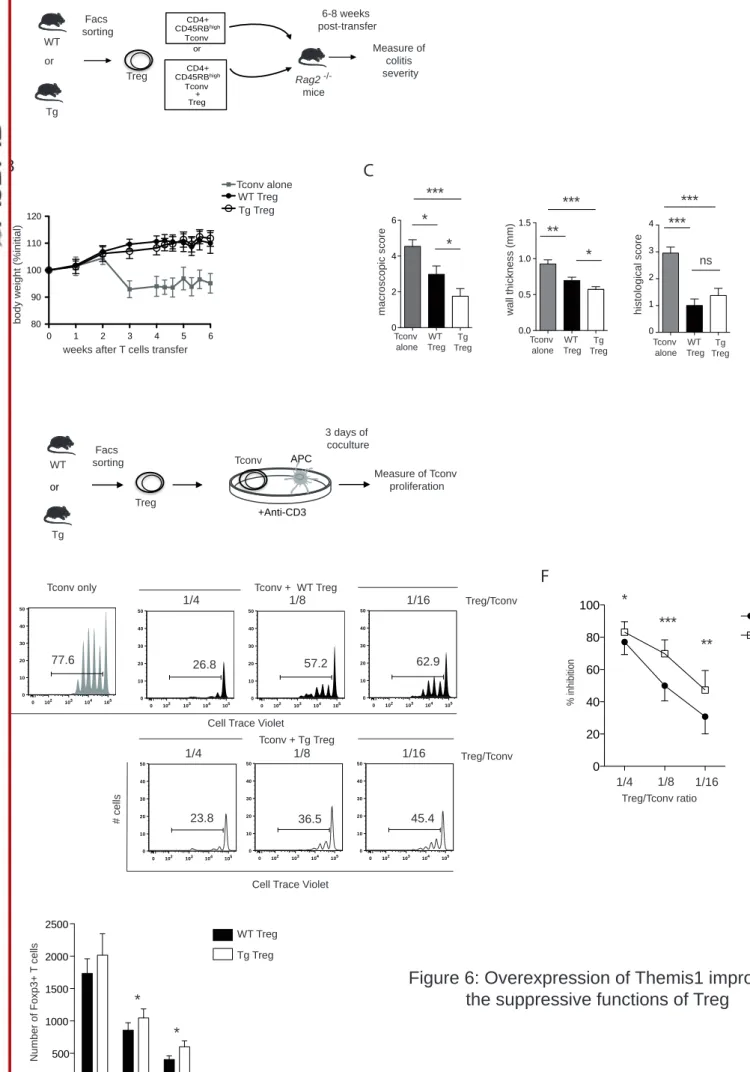
Figure 6: Overexpression of Themis1 improves the suppressive functions of Treg. A. CD4+CD25-CD45RBhigh colitogenic T cells were sorted from WT mice and injected into Rag2 -/- mice to induce colitis. In addition, CD4+CD25bright Treg cells were sorted either from
Themis1-Tg mice or littermates control and were co-transferred in a ratio of 1:4 (Treg:Tconv). B. Mice were monitored for their body weight for 8 weeks. C. The intensity of disease was assessed 8 weeks after T cell transfer by measuring macroscopic appearance and wall thickness of the colon. Bars show mean value of 3 independent experiments with 8 to 10 mice per group ± SEM. *p ≤0.05; **p ≤0.01; ***p ≤0.001. D. Suppressive activity of Treg cells from WT and Themis1-Tg mice was assessed in coculture experiments using Cell Trace Violet (CTV)-labeled and naive Tconv from WT mice as effector cells stimulated with plate-bound anti-CD3 and irradiated syngeneic antigen-presenting cells (APC). After 3 days of coculture, Tconv proliferation was assessed by CTV dilution. E. Representative histograms of the proliferation of Tconv alone or in the presence of the indicated ratios of Treg from WT or Themis1-Tg mice. Percentages indicate the proportion of CTV low effector cells. Results are representative of the 7 independent experiments. F. Suppressive functions of Treg from WT or Themis1-Tg mice at different ratios Treg:Tconv. Data are expressed as percentage of inhibition and presented as mean values ± SEM obtained from seven experiments. G. Boxplot of the number of Foxp3+
Treg at different ratio Treg/Tconv in co-culture experiment in vitro after 3 days. Data are presented as mean values ± SEM obtained from seven experiments. Non-parametric test *p
Version postprint
Acknowledgements:
We acknowledge Drs. Guillaume Gaud, Daniel Dunia, Anne Dejean for their valuable inputs on the manuscript. Mr Mehdi Benamar for his technical help. The authors acknowledge the technical assistance provided by the people from the Toulouse Proteomics Infrastructure; Fatima-Ezzahra L’Faqihi-Olive, Valérie Duplan-Eche and Anne-Laure Iscache from the CPTP Cytometry facility; Florence Capilla and Christine Salon from Inserm US006 hitstopathological platform, and the personnel of Inserm US006 Anexplo/Crefre animal facility.
This work was supported in part by the Région Midi-Pyrénées, European funds (Fonds Européens de Développement Régional, FEDER), Toulouse Métropole, the French Ministry of Research with the Investissement d’Avenir Infrastructures Nationales en Biologie et Santé program (ProFI, Proteomics French Infrastructure project, ANR-10-INBS-08), INSERM, Association Française contre les Myopathies. FD was supported by grants Région Midi-Pyrénées and ARSEP. AS and AG are supported by Centre National de la Recherche Scientifique.
Version postprint
References
1. Sakaguchi, S., Yamaguchi, T., Nomura, T., and Ono, M. (2008) Regulatory T Cells
and Immune Tolerance. Cell, pp. 775-787.
2. Brunkow, M. E., Jeffery, E. W., Hjerrild, K. A., Paeper, B., Clark, L. B., Yasayko, S.-A.,
Wilkinson, J. E., Galas, D., Ziegler, S. F., and Ramsdell, F. (2001) Disruption of a new forkhead/winged-helix protein, scurfin, results in the fatal lymphoproliferative disorder of the scurfy mouse. Nature Genetics 27, 68-73.
3. Fontenot, J. D., Gavin, M. A., and Rudensky, A. Y. (2003) Foxp3 programs the
development and function of CD4+CD25+ regulatory T cells. Nat Immunol 4, 330-336.
4. Hori, S., Nomura, T., and Sakaguchi, S. (2003) Control of regulatory T cell
development by the transcription factor Foxp3. Science (New York, N.Y.) 299, 1057-1061.
5. Wildin, R. S., Ramsdell, F., Peake, J., Faravelli, F., Casanova, J.-L., Buist, N.,
Levy-Lahad, E., Mazzella, M., Goulet, O., Perroni, L., Bricarelli, F. D., Byrne, G., McEuen, M., Proll, S., Appleby, M., and Brunkow, M. E. (2001) X-linked neonatal diabetes mellitus,
enteropathy and endocrinopathy syndrome is the human equivalent of mouse scurfy. Nature Genetics 27, 18-20.
6. Nadig, S. N., Wieckiewicz, J., Wu, D. C., Warnecke, G., Zhang, W., Luo, S., Schiopu, A.,
Taggart, D. P., and Wood, K. J. (2010) In vivo prevention of transplant arteriosclerosis by ex vivo-expanded human regulatory T cells. Nature medicine 16, 809-813.
7. Guyot-Revol, V., Innes, J. A., Hackforth, S., Hinks, T., and Lalvani, A. (2006)
Regulatory T cells are expanded in blood and disease sites in patients with tuberculosis. American Journal of Respiratory and Critical Care Medicine 173, 803-810.
8. Sayour, E. J., McLendon, P., McLendon, R., De Leon, G., Reynolds, R., Kresak, J.,
Sampson, J. H., and Mitchell, D. a. (2015) Increased proportion of FoxP3+ regulatory T cells in tumor infiltrating lymphocytes is associated with tumor recurrence and reduced survival in patients with glioblastoma. Cancer immunology, immunotherapy : CII 64, 419-427.
9. Shafiani, S., Tucker-Heard, G. s., Kariyone, A., Takatsu, K., and Urdahl, K. B. (2010)
Pathogen-specific regulatory T cells delay the arrival of effector T cells in the lung during early tuberculosis. The Journal of experimental medicine 207, 1409-1420.
10. Beyer, M., Thabet, Y., Müller, R.-U., Sadlon, T., Classen, S., Lahl, K., Basu, S., Zhou, X.,
Bailey-Bucktrout, S. L., Krebs, W., Schönfeld, E. a., Böttcher, J., Golovina, T., Mayer, C. T., Hofmann, A., Sommer, D., Debey-Pascher, S., Endl, E., Limmer, A., Hippen, K. L., Blazar, B. R., Balderas, R., Quast, T., Waha, A., Mayer, G., Famulok, M., Knolle, P. a., Wickenhauser, C., Kolanus, W., Schermer, B., Bluestone, J. a., Barry, S. C., Sparwasser, T., Riley, J. L., and Schultze, J. L. (2011) Repression of the genome organizer SATB1 in regulatory T cells is required for suppressive function and inhibition of effector differentiation. Nature immunology 12, 898-907.
11. Barra, M. M., Richards, D. M., Hansson, J., Hofer, A.-C., Delacher, M., Hettinger, J.,
Krijgsveld, J., and Feuerer, M. (2015) Transcription Factor 7 Limits Regulatory T Cell Generation in the Thymus. Journal of immunology (Baltimore, Md. : 1950) 195, 3058-3070.