Comprehensive molecular characterization
of clear cell renal cell carcinoma
The MIT Faculty has made this article openly available.
Please share
how this access benefits you. Your story matters.
Citation
Creighton, Chad J. et al. “Comprehensive Molecular
Characterization of Clear Cell Renal Cell Carcinoma.” Nature 499,
7456 (June 2013): 43–49 © 2013 Macmillan Publishers Limited
As Published
http://dx.doi.org/10.1038/NATURE12222
Publisher
Nature Publishing Group
Version
Final published version
Citable link
http://hdl.handle.net/1721.1/116727
Terms of Use
Creative Commons Attribution-Noncommercial-Share Alike
ARTICLE
OPEN
doi:10.1038/nature12222
Comprehensive molecular characterization
of clear cell renal cell carcinoma
The Cancer Genome Atlas Research Network*
Genetic changes underlying clear cell renal cell carcinoma (ccRCC) include alterations in genes controlling cellular oxygen
sensing (for example, VHL) and the maintenance of chromatin states (for example, PBRM1). We surveyed more than 400
tumours using different genomic platforms and identified 19 significantly mutated genes. The PI(3)K/AKT pathway was
recurrently mutated, suggesting this pathway as a potential therapeutic target. Widespread DNA hypomethylation was
associated with mutation of the H3K36 methyltransferase SETD2, and integrative analysis suggested that mutations
involving the SWI/SNF chromatin remodelling complex (PBRM1, ARID1A, SMARCA4) could have far-reaching effects
on other pathways. Aggressive cancers demonstrated evidence of a metabolic shift, involving downregulation of genes
involved in the TCA cycle, decreased AMPK and PTEN protein levels, upregulation of the pentose phosphate pathway and
the glutamine transporter genes, increased acetyl-CoA carboxylase protein, and altered promoter methylation of miR-21
(also known as MIR21) and GRB10. Remodelling cellular metabolism thus constitutes a recurrent pattern in ccRCC that
correlates with tumour stage and severity and offers new views on the opportunities for disease treatment.
Kidney cancers, or renal cell carcinomas (RCC), are a common group
of chemotherapy-resistant diseases that can be distinguished by
his-topathological features and underlying gene mutations
1. Inherited
predisposition to RCC has been shown to arise from genes involved
in regulating cellular metabolism, making RCC a model for the role of
an oncologic-metabolic shift, commonly referred to as the ‘Warburg
effect’, leading to malignancy
2. The most common type of RCC, clear
cell renal cell carcinoma (ccRCC), is closely associated with VHL gene
mutations that lead to stabilization of hypoxia inducible factors
(HIF-1a and HIF-2a, also known as HIF1A and EPAS1) in both sporadic
and familial forms. PBRM1, a subunit of the PBAF SWI/SNF
chro-matin remodelling complex, as well as histone deubiquitinase BAP1
and histone methyltransferase SETD2, were recently found to be
altered in ccRCC
3–5, implicating major roles for epigenetic regulation
of additional functional pathways participating in the development
and progression of the disease. Oncogenic metabolism and epigenetic
reprogramming have thus emerged as central features of ccRCC.
In the present study, clinical and pathological features, genomic
altera-tions, DNA methylation profiles, and RNA and proteomic signatures
were evaluated in ccRCC. We accrued more than 500 primary
nephrec-tomy specimens from patients with histologically confirmed ccRCC
that conformed to the requirements for genomic study defined by the
Cancer Genome Atlas (TCGA), together with matching ‘normal’
geno-mic material. Samples were restricted to those that contained at least 60%
tumour nuclei (median 85%) by pathological review (clinical data
sum-mary provided in Supplementary Table 1). A data freeze representing 446
samples was generated from at least one analytical platform (‘Extended’
data set) and data from all platforms were available for 372 samples for
coordinated, integrative analyses (‘Core’ data set) (Supplementary Data 1,
Supplementary Table 2). No substantial batch effects in the data that
might confound analyses were detected (Supplementary Figs 1–20).
Somatic alterations
The global pattern of somatic alterations, determined from analysis
of 417 samples, is shown in Fig. 1a. DNA hybridizations showed
that recurrent arm-level and focal somatic copy number alterations
(SCNAs) occurred at a fewer sites than is generally observed in other
cancers (P , 0.0004; Supplementary Figs 21–22 and Supplementary
Table 3). However, SCNAs that were observed more commonly
involved entire chromosomes or chromosome arms, rather than focal
events (17% vs 0.4%, Fig. 1b). Notably, the most frequent arm-level
events involved loss of chromosome 3p (ref. 6; 91% of samples),
encompassing all of the four most commonly mutated genes (VHL,
PBRM1, BAP1 and SETD2).
The data also suggested lower and more variable tumour cellularity
7in the accrued samples, compared to conventional pathological review
(median 54% 6 14%). This may reflect stromal or endothelial cell
contributions, or tumour cell heterogeneity. A recent study of multiple
samples from single tumours has demonstrated significant regional
genomic heterogeneity, but with shared mutations in frequently mutated
genes and convergent evolution of other common gene level events
8. The
mutation frequencies of key genes (VHL, PBRM1 and so on), as well as
copy number gains and losses found here, were, however, consistent
with previous reports. Tumour purity was therefore not determined to
be a limitation in the current study.
Arm level losses on chromosome 14q, associated with loss of
HIF1A, which has been predicted to drive more aggressive disease
9,
were also frequent (45% of samples). Gains of 5q were observed (67%
of samples) and additional focal amplifications refined the region of
interest to 60 genes in 5q35, which was particularly informative as
little has been known about the importance of this region in ccRCC
since the 5q gain was initially described. Focal amplification also
implicated the protein kinase C member PRKCI (ref. 10), and the
MDS1 and EVI1 complex locus MECOM at 3p26, the p53 regulator
MDM4 at 1q32, MYC at 8q24 and JAK2 on 9p24. Focally deleted
regions included the tumour suppressor genes CDKN2A at 9p21 and
PTEN at 10q23, putative tumour suppressor genes NEGR1 at 1p31,
QKI at 6q26, and CADM2 at 3p12 and the genes that are frequently
deleted in cancer, PTPRD at 9p23 and NRXN3 at 14q24 (ref. 11).
Whole-exome sequencing (WES) of tumours from 417 patients
identified 36,353 putative somatic mutations, including 16,821 missense
mutations, 6,383 silent mutations and 2,999 indels, with an average of
1.1 6 0.5 non-silent mutations per megabase (Supplementary Figs 23–
25). Mutations from 50 genes with high apparent somatic mutation
frequencies (Supplementary Table 4) were independently validated
using alternative sequencing instrumentation (Supplementary Fig. 26).
In tumours from 22 patients, whole-genome sequencing was also used to
validate and calibrate the WES data and confirmed 83% of the WES
mutation-calls (Supplementary Tables 5 and 6). In line with results of
previous studies (Supplementary Tables 7 and 8), the validated mutation
data identified nineteen significantly mutated genes (SMGs) (false
dis-covery rate (FDR) , 0.1), with VHL, PBRM1, SETD2, KDM5C, PTEN,
BAP1, MTOR and TP53 representing the eight most extreme members
(q , 0.00001) (Fig. 1a). Eleven additional SMGs were of considerably
lower significance (q , 0.1–0.5) but included known cancer genes.
Among all SMGs, only mutation of BAP1 correlated with poor survival
outcome (Supplementary Fig. 27)
12. Approximately 20% of cases had
none of the 19 recorded SMGs, although many contained rare
muta-tions in other known oncogenes or tumour suppressors, involving
survival associations, illustrating the genetic complexity of ccRCC
8(Supplementary Figs 28–30 and Supplementary Table 9).
Eighty-four putative RNA fusions were identified in 416 ccRCC
samples
13. Eleven of thirteen predicted events (Fig. 1c) were validated
using targeted methods, consistent with an 85% true-positive rate
(Supplementary Table 10 and Supplementary Figs 31–35). A recurrent
SFPQ–TFE3 fusion (previously linked to non-clear cell
translocation-associated RCC
14) was found in five samples, all of which were VHL
wild type, indicating either that these tumours are a clear cell variant or
that translocation-associated renal tumours may be histologically
indistinguishable from conventional ccRCC. Furthermore, the TFE3
protein as well as an X(p11) rearrangement was found in three of those
samples, where there were available slides.
DNA methylation profiles
We observed epigenetic silencing of VHL in about 7% of ccRCC tumours,
which was mutually exclusive with mutation of VHL (Fig. 1a), reflecting
the central role of this locus in ccRCC
15. An additional 289 genes showed
evidence of epigenetic silencing in at least 5% of tumours. The
top-ranked gene by inverse correlation between gene expression and
DNA methylation was UQCRH, hypermethylated in 36% of the
tumours. UQCRH has been previously suggested to be a tumour
suppressor
16, but not linked to ccRCC. Interestingly, increasing
pro-moter hypermethylation frequency correlated with higher stage and
grade (Fig. 2a, b).
We also evaluated the global consequences of mutation in specific
epigenetic modifiers. Mutations in SETD2, a non-redundant H3K36
methyltransferase, were associated with increased loss of DNA
methy-lation at non-promoter regions (Fig. 2c, d). This discovery is consistent
with the emerging view that H3K36 trimethylation may be involved in
the maintenance of a heterochromatic state
17, whereby DNA
methyl-transferase 3A (DNMT3A) binds H3K36me3 and methylates nearby
DNA
18. Thus, reductions of H3K36me3 through SETD2 inactivation
could lead indirectly to regional loss of DNA methylation.
RNA expression
Unsupervised clustering methods identified four stable subsets in
both mRNA (m1–m4) and miRNA (mi1–mi4) expression data sets
(Fig. 3a and Supplementary Figs 36–39). Supervised clustering revealed
the similarity of these new mRNA classes to the previously reported ccA
and ccB expression subtypes
19, with cluster m1 corresponding to ccA
and ccB divided between m2 and m3 (Supplementary Table 11). Cluster
m4 probably accounts for the roughly 15% of tumours previously
unclassified in the ccA/ccB classification scheme. Similarly, the survival
advantage previously observed for ccA cases was again identified for
m1 tumours (Fig. 3b).
The m1 subtype was characterized by gene sets associated with
chromatin remodelling processes and a higher frequency of PBRM1
mutations (39% in m1 vs 27% in others, P 5 0.027). Deletion of
CDKN2A (53% vs 26%; P , 0.0001) and mutations in PTEN (11%
vs 1%; P , 0.0001) were more frequent in m3 tumours (Supplementary
Fig. 5). The m4 group showed higher frequencies of BAP1 mutations
(17% vs 7%; P 5 0.002) and base-excision repair; however, this group
Fusion gene VHL methylation Number of mutations 100 50 200 100 0 0 VHL PBRM1 SETD2 KDM5C BAP1 PTEN MTOR TP53 PIK3CA % altered 3p21.1 5q35 14q24 9p21.3 - CDKN2A 6q26 - QKI 8p11 10q23 - PTEN 1p36 4q35 8q24 - MYC 3q26 - MECOM 13q21 - RB1 1q32 - MDM4 15q21 2q37 100% 50% 0% Arm-level alterations Focal alterations 100 10–1 10–2 10–3 10–4 10–5 10–6
Fraction of genome altered
17% 0.4% ccRCC samples 0 25 50 75 100 125 150 ccRCC CRC GBM BRCA OVCA Focal Arm-level
Copy-number events per sample
Cross-cancer comparison DHX33–NLRP1 (n = 2) SFPQ–TFE3 (n = 5) TRIP12–SLC16A14 (n = 2) TFG–GPR128 (n = 4) 1 2 3 10 9 8 7 6 5 4 11 12 20 21 22 X Y 18 19 17 16 15 14 13 3p21–p25 385 ccRCC samples Mutation spectrum C>T:G>A C>G:G>C C>A:G>T A>T:T>A A>G:T>C A>C:T>G
a
b
c
Figure 1
|
Somatic alterations in ccRCC. a, Top histogram, mutation events
per sample; left histogram, samples affected per alteration. Upper heat map,
distribution of fusion transcripts and VHL methylation across samples
(n 5 385 samples, with overlapping exome/SCNA/RNA-seq/methylation
data); middle heat map, mutation events; bottom heat map, copy number gains
(red) and losses (blue). Lower chart, mutation spectrum by indicated categories.
b, Left panel, frequency of arm-level copy-number alterations versus focal copy
number alterations. Right panel, comparison of the average numbers of
arm-level and focal copy-number changes in ccRCC, colon cancer (CRC),
glioblastoma (GBM), breast cancer (BRCA) and ovarian cancer (OVCA).
c, Circos plot of fusion transcripts identified in 416 samples of ccRCC, with
recurrent fusions highlighted.
also harboured more mTOR mutations (12% vs 4%; P 5 0.01) and
ribosomal gene sets.
Survival differences evident in miRNA-based subtypes
(Supplemen-tary Figs 40–44) correlated with the mRNA data (Fig. 3b–d). For
example, miR-21, previously shown to demonstrate strong regulatory
interactions in ccRCC
20and with established roles in metabolism
17,21,22correlated strongly with worse outcome, and DNA promoter
methyla-tion levels inversely correlated with expression of miR-21, miR-10b
and miR-30a (Supplementary Tables 12–14). miRNA interactions
thus represent a significant component of the epigenetic regulation
observed in ccRCC.
Integrative data analyses
We used a combination of approaches for integrative pathway analysis.
The HotNet
23algorithm uses a heat diffusion model, to find
sub-networks distinguished by both the frequency of mutation in genes
(nodes in the network) and the topology of interactions between genes
(edges in the network). In ccRCC, HotNet identified twenty-five
sub-networks of genes within a genome-scale protein–protein interaction
network (Supplementary Table 15 and Supplementary Fig. 45). The
largest and most frequently mutated network contained VHL and
inter-acting partners. The second most frequently mutated sub-network
included PBRM1, ARID1A and SMARCA4, key genes in the PBAF
SWI/SNF chromatin remodelling complex.
We also inferred activities for known pathways, by using the PARADIGM
algorithm to incorporate mutation, copy and mRNA expression data,
with pathway information catalogued in public databases. This method
identified a highly significant sub-network of 2,398 known regulatory
interactions, connecting 1,218 molecular features (645 distinct proteins)
(Supplementary Figs 46–49 and Supplementary Tables 16 and 17).
Several ‘active’ transcriptional ‘hubs’ were identified, by searching for
transcription factors with targets that were inferred to be active in the
PARADIGM network. The active hubs found included HIF1A/ARNT,
the transcription factor program activated by VHL mutation, as well as
MYC/MAX, SP1, FOXM1, JUN and FOS. These hubs, together with
several other less well-studied transcription factors, interlink much of the
transcriptional program promoting glycolytic shift, de-differentiation
and growth promotion in ccRCC.
We next searched for causal regulatory interactions connecting
ccRCC somatic mutations to these transcriptional hubs, using a
bi-directional extension to HotNet (‘TieDIE’) and identified a
chromatin-specific sub-network (Fig. 4a and Supplementary Figs 50–52). TieDIE
defines a set of transcriptional targets, whose state in the tumour cells is
proposed to be influenced by one or more of the significantly mutated
genes. The chromatin modification pathway intersects a wide variety of
processes, including the regulation of hormone receptors (for example,
ESR1), RAS signalling via the SRC homologue (SHC1), immune-related
signalling (for example, NFKB1 and IL6)
24, transcriptional output (for
example, HIF1A, JUN, FOS and SP1), DNA repair (via BAP1) and
beta-catenin (CTNNB1) and transforming growth factor (TGF)-b (TGFBR2)
signalling via interactions with a SMARC–PBRM1–ARID1A complex.
The complexity of these interactions reflects the potential for highly
pleio-tropic effects following primary events in chromatin modification genes.
The mutations in the chromatin regulators PBRM1, BAP1 and
SETD2 were differentially associated with altered expression patterns
of large numbers of genes when compared to samples bearing a
background of VHL mutation (Supplementary Tables 18–21 and
Sup-plementary Fig. 53). Each chromatin regulator had a distinct set of
downstream effects, reflecting diverse roles for chromatin
remo-delling in the transcriptome.
Additionally, an unsupervised pathway analysis using the MEMo
algorithm
25identified mutually exclusive patterns of alterations
target-ing multiple components of the PI(3)K/AKT/MTOR pathway in 28%
of the tumours (Fig. 4b and Supplementary Table 22). Interestingly, the
altered gene module included two genes from the broad amplicon on
5q35.3: GNB2L1 and SQSTM1. Both these genes have previously been
associated with activation of PI(3)K signalling
26,27. Furthermore, mRNA
expression levels of these two genes were correlated with both DNA
copy number increases and alteration status of the PI(3)K pathway
(Supplementary Figs 54–55). The mutual exclusivity module also includes
–Log
10
(B–H-adjusted
P
value)
DNA methylation difference (SETD2 mutant – SETD2 wild type)
Clear cell renal cell carcinomas DNA Me
a
c
d
Hypomethylated loci Hypermethylated lociTumour stage Tumour grade
Normal I II III IV G1 G2 G3 G4 0 –0.3 0.3 0 5 10 15 0.00 0.12
b
Normal Hyper-methylated Hypo-methylated H3K36me3 SETD2 mRNA 0.06 0.00 0.12 0.06 SETD2 WT SETD2 MUT Normal kidney Promoter DNA hypermethylation frequency DNA MethylationFigure 2
|
DNA methylation and ccRCC.
a, b, Overall promoter DNA hypermethylation
frequency in the tumour increases with rising stage
(a) and grade (b). The promoter DNA
hypermethylation frequency is calculated as the
percentage of CpG loci hypermethylated among
15,101 loci which are unmethylated in the normal
kidney tissue and normal white blood cells
(boxplots, median with 95% confidence interval).
c, Volcano plots showing a comparison of DNA
methylation for SETD2 mutant versus non-mutant
tumours (n 5 224, HumanMethylation450
platform). Unshaded area: CpG loci with
Benjamini–Hochberg (B–H) FDR 5 0.001 and
difference in mean beta value . 0.1 (n 5 2,557).
d, Heat map showing CpG loci with SETD2
mutation-associated DNA methylation (from part
c); blue to red indicates low to high DNA
methylation. The loci are split into those
hypomethylated (top panel; n 5 1,251) or
hypermethylated (bottom panel; n 5 1,306) in
SETD2 mutants. Top colour bars indicate SETD2
mRNA expression (red: high, green: low) and
SETD2 mutation status. Grey-scale row-side colour
bar on left-hand side represents the relative number
of overlapping reads, based on H3K36me3 ChIP-seq
experiment in normal adult kidney (http://
nihroadmap.nih.gov/epigenomics/); black, high
read count. DNA methylation patterns include 14
normal kidney samples. Among the tumours
without SETD2 mutations, six (arrowhead) have
both the signature pattern of SETD2 mutation and
low SETD2 mRNA expression.
frequent overexpression of EGFR, which correlates with increased
phosphorylation of the receptor (Supplementary Fig. 56), and which
has been previously associated with lapatinib response in ccRCC
28.
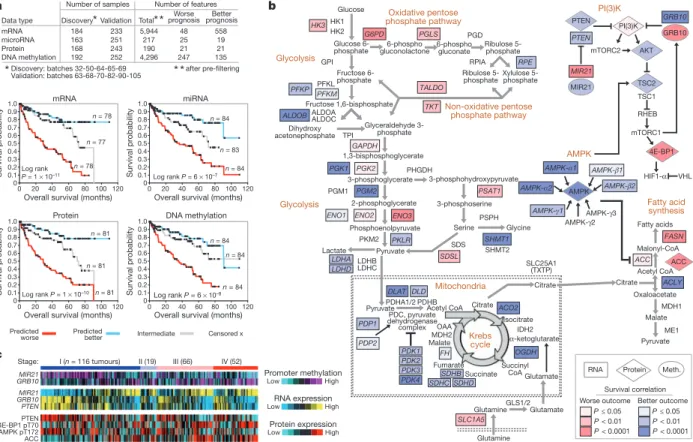
Correlations with survival
Where unsupervised analyses had indicated that common molecular
patterns were associated with patient survival, we sought to further
define molecular prognostic signatures at the levels of mRNA, miRNA,
DNA methylation and protein. Data were divided into ‘discovery’
(n 5 193) and ‘validation’ (n 5 253) sets and platform-specific
signa-tures were defined using Cox analyses
24. Kaplan–Meier analysis for each
signature showed statistically significant associations with survival in
the validation subset (Fig. 5a and Supplementary Fig. 57). Multivariate
Cox analyses, incorporating established clinical variables, showed that
the mRNA, miRNA and protein signatures provided additional
pro-gnostic power (Supplementary Table 23). In addition, these signatures
could provide molecular clues as to the drivers of aggressive cancers.
Top protein correlates of worse survival included reduced
AMP-activated kinase (AMPK) and increased acetyl-CoA carboxylase (ACC)
(Supplementary Fig. 58). Together, downregulation of AMPK and
upregulation of ACC activity contribute to a metabolic shift towards
increased fatty acid synthesis
29. A metabolic shift to an altered use of key
metabolites and pathways was also apparent when considering the full
set of genes involved in the core metabolic processes, including a shift
towards a ‘Warburg effect’-like state (Fig. 5b). Poor prognosis correlated
with downregulation of AMPK complex and the Krebs cycle genes, and
with upregulation of genes involved in the pentose phosphate pathway
a
b
c
d
mRNA-based clusters m1 m2 m3 m4 mi1 mi2 mi3 mi4Log rank P = 3 × 10⁻⁶ Log rank P = 0.0003 miRNA-based clusters 1.0 0.9 0.8 0.7 0.6 0.5 0.4 0.3 0.2 0.1 0 Survival probability 1.0 0.9 0.8 0.7 0.6 0.5 0.4 0.3 0.2 0.1 0 Survival probability
Overall survival (months)
0 20 40 60 80 100 120
Overall survival (months)
0 20 40 60 80 100120 x = censored x = censored mRNA cluster miRNA cluster mi1 mi2 mi3 mi4 34 5 62 32 21 22 32 8 13 52 5 18 9 29 37 10 m1 m2 m3 m4 500 mRNAs 26 miRs ~5,000 mRNAs Enrichment Anti-enrichment Overlapping samples mRNA–miRNA correlations (predicted targets only)
miR-21 miR-10b miR-204 let-7a High Low –10 0 10 Pred. target enrichment (t) miR-185 miR-22 miR-146 miR-182 miR-21 miR-221 miR-222 miR-9 miR-16 miR-32
(n) (147)m1 (90)m2 (94)m3 (86)m4 mi1(82) (115)mi2 (144)mi3 mi4(73)
Low High
RNA expression
Figure 3
|
mRNA and miRNA patterns reflect molecular subtypes of
ccRCC. a, Tumours were separated into four sample groups (that is, ‘clusters’)
by unsupervised analyses, on the basis of either differentially expressed mRNA
patterns (left panel, showing 500 representative genes: m1–m4) or differentially
expressed miRNA patterns (right panel, showing 26 representative miRNAs:
mi1–mi4). b, Significant differences in patient survival were identified for both
the mRNA-based clusters (left panel) and the miRNA-based clusters (right
panel). c, Numbers of samples overlapping between the two sets of clusters,
with significant concordance observed between m1 and mi3 and between m3
and mi2; red, significant overlap (P , 10
25, chi-squared test). d, mRNA–
miRNA correlations, for predicted targeting interactions. Rows indicate
miRNAs from a (indicated by cluster-specific colour bar); columns, mRNAs
(5,000 differentially regulated genes selected for average RPKM . 10 and at
least one predicted miRNA interaction); mRNA–miRNA entries with no
predicted targeting are white. To the right of the correlation matrix, t statistics
(Spearman’s rank) indicate group target enrichment.
a
b
PARADIGM Expression Mutation Correlation with chromatin mutation Post-transcriptional regulation Protein–protein interaction Positive/high Negative/low EGFR 6% GNB2L1 7% AKT 2% PIK3CA 3% RHEB 1% MTOR 6% PTEN 4% IGF1R TSC1/2 2% SQSTM1 7% 5q Genes Somatic mutation Homozygousdeletion High-levelamplification
EGFR GNB2L1 PTEN PIK3CA AKT TSC1/2 RHEB SQSTM1 MTOR mRNA up-regulation AKT/TSC mutation: AKT1 AKT2 AKT3 TSC1 TSC2
Inactivation Activation IL6 SP1 COL1A2 TGFBR2 FOS JUN ESR1 CTNNB1 PBRM1 SMARCA4 BAP1 COBRA1 SMARCD1 ARID1A AXIN2 HIF1A IL5RA NFKB1 PTPN2 E2F1 SHC1 JAK2 BRCA1 Transcriptional regulation
PI(3)K pathway genes: 107 tumours altered (28% of core set samples)
Figure 4
|
Genomically-altered pathways in ccRCC. a, Alterations in
chromatin remodelling genes were predicted to affect a large network of genes
and pathways (larger implicated network in Supplementary Information). Each
gene is depicted as a multi-ring circle with various levels of data, plotted such
that each ‘spoke’ in the ring represents a single patient sample (same sample
ordering for all genes). ‘PARADIGM’ ring, bioinformatically inferred levels of
gene activity (red, higher activity); ‘Expression’, mRNA levels relative to normal
(red, high); ‘Mutation’, somatic event; centre, correlation of gene expression or
activity to mutation events in chromatin-related genes (red, positive). Protein–
protein relationships inferred using public resources. b, For the PI(3)K/AKT/
MTOR pathway (altered in ,28% of tumours), the MEMo algorithm identified
a pattern of mutually exclusive gene alterations (somatic mutations, copy
alterations and aberrant mRNA expression) targeting multiple components,
including two genes from the recurrent amplicon on 5q35.3. The alteration
frequency and inferred alteration type (blue for inactivation and red for
activation) is shown for each gene in the pathway diagram.
(G6PD, PGLS, TALDO (also known as TALDO1P1), TKT) and fatty
acid synthesis (FASN, ACC (also known as ACACA)).
Examination of potential genetic or epigenetic drivers of a glycolytic
shift led us to identify methylation events involving MIR21 and GRB10,
with decreased promoter methylation of each gene (thereby higher
expression) being associated with worse or better outcome,
respect-ively (Fig. 5b, Supplementary Fig. 59 and Supplementary Table 24).
Both genes regulate the PI(3)K pathway: miR-21 is inducible by high
glucose levels and downregulates PTEN
22; whereas the tumour
sup-pressor GRB10 negatively regulates PI(3)K and insulin signalling
30.
Promoter methylation of MIR21 and GRB10 were coordinated with
their mRNA expression patterns, as well as with the mRNA expression
of other key genes and protein expression in the metabolic pathways
(Fig. 5c and Supplementary Fig. 60). In addition to the PI(3)K pathway
(Fig. 5b and Supplementary Fig. 61), molecular survival correlations
involved several pro-metastatic matrix metalloproteinases
(Supplemen-tary Fig. 62).
Discussion
Our study sampled a single site of the primary tumour, in a disease
with a potentially high level of tumour heterogeneity
8. The extent to
which convergent evolutionary events are a common theme in ccRCC
remains to be determined, but may indicate that critical genes will be
represented across the tumour landscape for an individual mass. In
general, the large sample size seemed to overcome the intrinsic
chal-lenges of studying a genetically complex disease, revealing rare variants
at rates similar to what has been described previously
3. The samples,
taken from primary tumour specimens, were reflective of patients fit
for either definitive or cytoreductive nephrectomy, whereas future work
could explore the genomic landscape of metastatic lesions.
Pathway and integrated analyses highlighted the importance of
the well-known VHL/HIF pathway, the newly emerging chromatin
remodelling/histone methylation pathway, and the PI(3)K/AKT
path-way. The observation of chromatin modifier genes being frequently
mutated in ccRCC strongly supports the model of nucleosome dynamics,
providing a key function in renal tumorigenesis. Although the
mech-anistic details remain to be defined as to how such modulation promotes
tumour formation, the data presented here revealed alterations in DNA
methylation associated with SETD2 mutations. As an epigenetic process
that can potently modify many transcriptional outputs, these mutational
events have the potential to change the landscape of the tumour genome
through altered expression of global sets of genes and genetic elements.
Molecular correlates of patient survival further implicated PI(3)K/AKT
as having a role in tumour progression, involving specific DNA
methy-lation events. The PI(3)K/AKT pathway presents a strong therapeutic
target in ccRCC, supporting the potential value of MTOR and/or
related pathway inhibitor drugs for this cancer
31,32.
Cross-platform molecular analyses indicated a correlation between
worsened prognosis in patients with ccRCC and a metabolic shift
involving increased dependence on the pentose phosphate shunt,
decreased AMPK, decreased Krebs cycle activity, increased glutamine
transport and fatty acid production. These findings are consistent
1.0 0.9 0.8 0.7 0.6 0.5 0.4 0.3 0.2 0.1 0 1.0 0.9 0.8 0.7 0.6 0.5 0.4 0.3 0.2 0.1 0 Survival probability 1.0 0.9 0.8 0.7 0.6 0.5 0.4 0.3 0.2 0.1 0 1.0 0.9 0.8 0.7 0.6 0.5 0.4 0.3 0.2 0.1 0 Survival probability Survival probability Survival probability
Overall survival (months) Overall survival (months)
0 20 40 60
Overall survival (months) Overall survival (months) mRNA
Log rank
P = 1 × 10–11 Log rank P = 6 × 10⁻⁷
Log rank P = 1 × 10⁻¹⁰ Log rank P = 6 × 10⁻⁸ miRNA
Protein DNA methylation n = 78 n = 77 n = 84 n = 84 n = 81 n = 81 n = 84 n = 84 Predicted
worse Predictedbetter Censored x
80 100 120 n = 81 n = 84 0 20 40 60 80 100 120 n = 83 0 20 40 60 80 100 120 0 20 40 60 80 100 120 n = 78 Intermediate mRNA microRNA Protein DNA methylation 184 163 168 192 Discovery 233 251 243 252 Validation 5,944 217 190 4,296 Total 48 25 21 247 Worse prognosis 558 19 21 135 Better prognosis
*
*
after pre-filtering Number of samples Number of features Data type Discovery: batches 32-50-64-65-69 Validation: batches 63-68-70-82-90-105*
*
*
*
HK1 HK2 P < 0.01 P ≤ 0.05 P < 0.0001 P < 0.01 P ≤ 0.05 P < 0.0001Worse outcome Better outcome Survival correlation HK3 G6PD PGLS PGD RPIA RPE PFKP PFKMPFKL GPI ALDOA ALDOC ALDOB TALDO GAPDH TPI PHGDH PSPH SHMT2 SDS PKM2 LDHB LDHC LDHA LDHD TKT PKLR PGK1 PGK2 PGM1 PGM2 ENO1 ENO2 ENO3
MDH1 SHMT1 PSAT1 SDSL FASN ACC ACLY ME1 SLC25A1 (TXTP) PDHB PDHA1/2 DLAT PDP1 PDP2 PDK1 PDK2 PDK3 PDK4 FH SDHCSDHBSDHD OGDH IDH2 ACO2 DLD GLS1/2 MDH2 SLC1A5 AMPK-γ1 AMPK-β1 AMPK-α1 AMPK-γ2 AMPK-β2 AMPK-α2 AMPK-γ3 AMPK PI(3)K Protein RNA AMPK Fatty acid synthesis Oxidative pentose phosphate pathway Glycolysis Glycolysis Non-oxidative pentose phosphate pathway Krebs cycle OAA Mitochondria PI(3)K mTORC2 AKT TSC2 TSC1 PTEN PTEN MIR21 MIR21 GRB10 GRB10 RHEB mTORC1 Meth. ACC PTEN 4E-BP1 pT70 AMPK pT172 ACC MIR21 GRB10 PTEN MIR21 GRB10 I (n = 116 tumours) RNA expression High Low High Low Protein expression Promoter methylation High Low II (19) III (66) IV (52) Stage: 4E-BP1 HIF1-α VHL
a
c
b
Glucose 6-phosphate Fructose 6-phosphate Fructose 1,6-bisphosphate Glucose Glyceraldehyde 3-phosphate Dihydroxy acetonephosphate 6-phospho gluconolactone 6-phosphogluconateRibulose 5-phosphate Ribulose
5-phosphateXylulose 5-phosphate
1,3-bisphosphoglycerate 2-phosphoglycerate 3-phosphoglycerate Phosphoenolpyruvate 3-phosphohydroxypyruvate 3-phosphoserine Serine Glycine Pyruvate Lactate
Pyruvate Acetyl CoA PDC, pyruvate dehydrogenase complex Pyruvate Malate Oxaloacetate Citrate Acetyl CoA Malonyl-CoA Fatty acids Isocitrate Citrate Citrate α-ketoglutarate Malate Fumarate Succinyl CoAGlutamate Succinate Glutamine Glutamate Glutamine
Figure 5
|
Molecular correlates of patient survival involve metabolic
pathways. a, Sample profiles were separated into discovery and validation
subsets, with the top survival correlates within the discovery subset being
defined for each of the four platforms examined (mRNA, microRNA, protein,
DNA methylation). Kaplan–Meier plots show results of applying the four
prognostic signatures to the validation subset, comparing survival for patients
with predicted higher risk (red, top third of signature scores), lower risk (blue,
bottom third) or intermediate risk (grey, middle third); successful predictions
were observed in each case. b, When viewed in the context of metabolism, the
molecular survival correlates highlight a widespread metabolic shift, with
tumours altering their usage of key pathways and metabolites (red and blue
shading representing the correlation of increased gene expression with worse or
better survival respectively, univariate Cox based on extended cohort). Worse
survival correlates with upregulation of pentose phosphate pathway genes
(G6PH, PGLS, TALDO and TKT), fatty acid synthesis genes (ACC and FASN),
and PI(3)K pathway enhancing genes (MIR21). Better survival correlates with
upregulation of AMPK complex genes, multiple Krebs cycle genes and PI(3)K
pathway inhibitors (PTEN, TSC2). Additionally, specific promoter methylation
events, including hypermethylation of PI(3)K pathway repressor GRB10,
associate with outcome. c, Heat map of selected key features from the metabolic
shift schematic (b) demonstrating coordinate expression by stage at DNA
methylation, RNA, and protein levels (data from validation subset).
with the isotopomer spectral analysis of a pair of VHL
2/2clear cell
kidney cancer cell lines, both of which were notably derived from
patients with aggressive, metastatic disease, which revealed a
depend-ence on reductive glutamine metabolism for lipid biosynthesis
33. The
metabolic shift identified in poor prognosis ccRCC remarkably mirrors
the Warburg metabolic phenotype (increased glycolysis, decreased
AMPK, glutamine-dependent lipogenesis) identified in type 2
pap-illary kidney cancer characterized by mutation of the Krebs cycle
enzyme, fumarate hydratase
33. Further studies to dissect out the role
of the commonly mutated chromosome 3 chromatin remodelling
genes, PBRM1, SETD2 and BAP1, in ccRCC tumorigenesis and their
potential role in the metabolic remodelling associated with progression
of this disease will hopefully provide the foundation for the
develop-ment of effective forms of therapy for this disease.
METHODS SUMMARY
Specimens were obtained from patients, with appropriate consent from insti-tutional review boards. Using a co-isolation protocol, DNA and RNA were purified. In total, 446 patients were assayed on at least one molecular profiling platform, which platforms included: (1) RNA sequencing, (2) DNA methylation arrays, (3) miRNA sequencing, (4) Affymetrix single nucleotide polymorphism (SNP) arrays, (5) exome sequencing, and (6) reverse phase protein arrays. As described above and in the Supplementary Methods, both single platform analyses and integrated cross-platform analyses were performed.
Received 25 October 2012; accepted 24 April 2013. Published online 23 June 2013.
1. Linehan, W. M., Walther, M. M. & Zbar, B. The genetic basis of cancer of the kidney. J. Urol.170, 2163–2172 (2003).
2. Linehan, W. M., Srinivasan, R. & Schmidt, L. S. The genetic basis of kidney cancer: a metabolic disease. Nature Rev. Urol.7, 277–285 (2010).
3. Dalgliesh, G. L. et al. Systematic sequencing of renal carcinoma reveals inactivation of histone modifying genes. Nature463, 360–363 (2010).
4. Guo, G. et al. Frequent mutations of genes encoding ubiquitin-mediated proteolysis pathway components in clear cell renal cell carcinoma. Nature Genet. 44, 17–19 (2012).
5. Varela, I. et al. Exome sequencing identifies frequent mutation of the SWI/SNF complex gene PBRM1 in renal carcinoma. Nature469, 529–542 (2011). 6. Zbar, B., Brauch, H., Talmadge, C. & Linehan, M. Loss of alleles of loci on the short
arm of chromosome 3 in renal cell carcinoma. Nature327, 721–724 (1987). 7. Carter, S. L. et al. Absolute quantification of somatic DNA alterations in human
cancer. Nature Biotechnol.30, 413–421 (2012).
8. Gerlinger, M. et al. Intratumor heterogeneity and branched evolution revealed by multiregion sequencing. N. Engl. J. Med.366, 883–892 (2012).
9. Shen, C. et al. Genetic and functional studies implicate HIF1a as a 14q kidney cancer suppressor gene. Cancer Discov.1, 222–235 (2011).
10. Eder, A. M. et al. Atypical PKCi contributes to poor prognosis through loss of apical basal polarity and cyclin E overexpression in ovarian cancer. Proc. Natl Acad. Sci. USA102, 12519–12524 (2005).
11. Herbers, J. et al. Significance of chromosome arm 14q loss in nonpapillary renal cell carcinomas. Genes Chromosom. Cancer19, 29–35 (1997).
12. Hakimi, A. A. et al. Adverse outcomes in clear cell renal cell carcinoma with mutations of 3p21 epigenetic regulators BAP1 and SETD2: a report by MSKCC and the KIRC TCGA research network. Clin. Cancer Res. http://dx.doi.org/10.1158/ 1078-0432.CCR-12-3886 (2013).
13. Lewis, B. P., Shih, I., Jones-Rhoades, M., Bartel, D. & Burge, C. Prediction of mammalian microRNA targets. Cell115, 787–798 (2003).
14. Clark, J. et al. Fusion of splicing factor genes PSF and NonO (p54nrb) to the TFE3
gene in papillary renal cell carcinoma. Oncogene15, 2233–2239 (1997). 15. Herman, J. G. et al. Silencing of the VHL tumor-suppressor gene by DNA
methylation in renal carcinoma. Proc. Natl Acad. Sci. USA91, 9700–9704 (1994). 16. Modena, P. et al. UQCRH gene encoding mitochondrial Hinge protein is interrupted by a translocation in a soft-tissue sarcoma and epigenetically inactivated in some cancer cell lines. Oncogene22, 4586–4593 (2003).
17. Wagner, E. J. & Carpenter, P. B. Understanding the language of Lys36 methylation at histone H3. Nature Rev. Mol. Cell Biol.13, 115–126 (2012).
18. Dhayalan, A. et al. The Dnmt3a PWWP domain reads histone 3 lysine 36 trimethylation and guides DNA methylation. J. Biol. Chem.285, 26114–26120 (2010).
19. Brannon, A. R. et al. Molecular stratification of clear cell renal cell carcinoma by consensus clustering reveals distinct subtypes and survival patterns. Genes Cancer1, 152–163 (2010).
20. Liu, H. et al. Identifying mRNA targets of microRNA dysregulated in cancer: with application to clear cell renal cell carcinoma. BMC Syst. Biol.4, 51 (2010). 21. Creighton, C. J. et al. Integrated analyses of microRNAs demonstrate their
widespread influence on gene expression in high-grade serous ovarian carcinoma. PLoS ONE7, e34546 (2012).
22. Dey, N. et al. MicroRNA-21 orchestrates high glucose-induced signals to TOR complex 1, resulting in renal cell pathology in diabetes. J. Biol. Chem.286, 25586–25603 (2011).
23. Vandin, F., Upfal, E. & Raphael, B. J. Algorithms for detecting significantly mutated pathways in cancer. J. Comput. Biol.18, 507–522 (2011).
24. The Cancer Genome Atlas Research Network. Integrated genomic analyses of ovarian carcinoma. Nature474, 609–615 (2011).
25. Ciriello, G., Cerami, E., Sander, C. & Schultz, N. Mutual exclusivity analysis identifies oncogenic network modules. Genome Res.22, 398–406 (2012).
26. He, X., Wang, J., Messing, E. M. & Wu, G. Regulation of receptor for activated C kinase 1 protein by the von Hippel–Lindau tumor suppressor in IGF-I-induced renal carcinoma cell invasiveness. Oncogene30, 535–547 (2011).
27. Duran, A. et al. p62 is a key regulator of nutrient sensing in the mTORC1 pathway. Mol. Cell44, 134–146 (2011).
28. Ravaud, A. et al. Lapatinib versus hormone therapy in patients with advanced renal cell carcinoma: a randomized phase III clinical trial. J. Clin. Oncol.26, 2285–2291 (2008).
29. Tong, W. H. et al. The glycolytic shift in fumarate-hydratase-deficient kidney cancer lowers AMPK levels, increases anabolic propensities and lowers cellular iron levels. Cancer Cell20, 315–327 (2011).
30. Yu, Y. et al. Phosphoproteomic analysis identifies Grb10 as an mTORC1 substrate that negatively regulates insulin signaling. Science332, 1322–1326 (2011). 31. Motzer, R. J. et al. Efficacy of everolimus in advanced renal cell carcinoma: a
double-blind, randomised, placebo-controlled phase III trial. Lancet372, 449–456 (2008).
32. Hudes, G. et al. Temsirolimus, interferon alfa, or both for advanced renal-cell carcinoma. N. Engl. J. Med.356, 2271–2281 (2007).
33. Metallo, C. M. et al. Reductive glutamine metabolism by IDH1 mediates lipogenesis under hypoxia. Nature481, 380–384 (2012).
Supplementary Information is available in the online version of the paper. Acknowledgements We wish to thank all patients and families who contributed to this study. A full list of grant support and acknowledgments is included in the supplement. Author Contributions The Cancer Genome Atlas research network contributed collectively to this study. Biospecimens were provided by the tissue source sites and processed by the Biospecimen Core Resource. Data generation and analyses were performed by the genome-sequencing centers, cancer genome-characterization centers and genome data analysis centers. All data were released through the Data Coordinating Center. Project activities were coordinated by the NCI and NHGRI project teams. The following TCGA investigators of the Kidney Analysis Working Group contributed substantially to the analysis and writing of this manuscript: Project leaders: Richard A. Gibbs, W. Marston Linehan. Data Coordinator: Margaret Morgan. Analysis Coordinators: Chad J. Creighton, Roel G. W. Verhaak. Manuscript Coordinators: Richard A. Gibbs, Chad J. Creighton. Writing Team: W. Marston Linehan, Chad J. Creighton, W. Kimryn Rathmell, Roel G. W. Verhaak, Richard A. Gibbs. DNA Sequence analysis: David A. Wheeler, Kristian Cibulskis. mRNA analysis: Roel G. W. Verhaak, A. Rose Brannon, W. Kimryn Rathmell, Wandaliz Torres-Garcia. microRNA analysis: A. Gordon Robertson, Andy Chu, Preethi H. Gunaratne. DNA methylation analysis: Hui Shen, Peter W. Laird. Copy number analysis: Rameen Beroukhim, Sabina Signoretti. Protein analysis: Dimitra Tsavachidou, Yiling Lu, Gordon B Mills. Pathway/Integrated Analysis: Rehan Akbani, Giovanni Ciriello, Chad J. Creighton, Suzanne S. Fei, Anders Jacobsen, Evan O. Paull, Ben Raphael, Sheila M. Reynolds, Christopher J. Ricketts, Nikolaus Schultz, Joshua M. Stuart, Fabio Vandin. Clinical Data: W. Kimryn Rathmell, A. Ari Hakimi, Johanna Gardener, Candace Shelton. Pathology and Clinical Expertise: James Hsieh, Marston W. Linehan, Pheroze Tamboli, W. Kimryn Rathmell, Victor Reuter.
Author Information All of the primary sequence files are deposited in CGHub (file IDs in Supplementary Information) and all other data are deposited at the Data Coordinating Centrer (DCC) for public access (http://cancergenome.nih.gov/). Reprints and permissions information is available at www.nature.com/reprints. The authors declare no competing financial interests. Readers are welcome to comment on the online version of the paper. Correspondence and requests for materials should be addressed to R.A.G. (agibbs@bcm.edu) or W.M.L. (linehanm@mail.nih.gov).
This work is licensed under a Creative Commons
Attribution-NonCommercial-Share Alike 3.0 Unported licence. To view a copy of this licence, visit http://creativecommons.org/licenses/by-nc-sa/3.0
The Cancer Genome Atlas Research Network
Analysis working group: Baylor College of Medicine Chad J. Creighton1,2, Margaret
Morgan1, Preethi H. Gunaratne1,3, David A. Wheeler1, Richard A. Gibbs1;BC Cancer
Agency A. Gordon Robertson4, Andy Chu4;Broad Institute Rameen Beroukhim5,6,
Kristian Cibulskis6;Brigham & Women’s Hospital Sabina Signoretti7,54,59;Brown
University Fabio Vandin8; Hsin-Ta Wu8, Benjamin J. Raphael8;The University of Texas
MD Anderson Cancer Center Roel G. W. Verhaak9, Pheroze Tamboli10, Wandaliz
Torres-Garcia9, Rehan Akbani9, John N. Weinstein9;Memorial Sloan-Kettering Cancer
Center Victor Reuter11, James J. Hsieh12, A. Rose Brannon11, A. Ari Hakimi12, Anders
Jacobsen13, Giovanni Ciriello13, Boris Reva13;National Cancer Institute Christopher J.
Ricketts14, W. Marston Linehan14;University of California Santa Cruz Joshua M.
Stuart15;University of North Carolina, Chapel Hill W. Kimryn Rathmell16;University
of Southern California Hui Shen17, Peter W. Laird17Genome sequencing centres:
Baylor College of Medicine Donna Muzny1, Caleb Davis1, Margaret Morgan1, Liu Xi1,
Kyle Chang1, Nipun Kakkar1, Lisa R. Trevin˜o1, Susan Benton1, Jeffrey G. Reid1, Donna
Morton1, Harsha Doddapaneni1, Yi Han1, Lora Lewis1, Huyen Dinh1, Christie Kovar1,
Yiming Zhu1, Jireh Santibanez1, Min Wang1, Walker Hale1, Divya Kalra1, Chad J.
Creighton1,2, David A. Wheeler1, Richard A. Gibbs1;Broad Institute Gad Getz6,57,
Kristian Cibulskis6, Michael S. Lawrence6, Carrie Sougnez6, Scott L. Carter6, Andrey
Sivachenko6, Lee Lichtenstein6, Chip Stewart6, Doug Voet6, Sheila Fisher6, Stacey B.
Gabriel6, Eric Lander6Genome characterization centres: Broad Institute Rameen
Beroukhim5,6,54,56, Steve E. Schumacher6,56, Barbara Tabak6,56, Gordon Saksena6,
Robert C. Onofrio6, Scott L. Carter6, Andrew D. Cherniack6, Jeff Gentry6, Kristin
Ardlie6, Carrie Sougnez6, Gad Getz6,57, Stacey B. Gabriel6, Matthew Meyerson6,7,54;BC Cancer Agency A. Gordon Robertson4, Andy Chu4, Hye-Jung E. Chun4, Andrew J.
Mungall4, Payal Sipahimalani4, Dominik Stoll4, Adrian Ally4, Miruna Balasundaram4,
Yaron S. N. Butterfield4, Rebecca Carlsen4, Candace Carter4, Eric Chuah4, Robin J. N.
Coope4, Noreen Dhalla4, Sharon Gorski4, Ranabir Guin4, Carrie Hirst4, Martin Hirst4,
Robert A. Holt4, Chandra Lebovitz4, Darlene Lee4, Haiyan I. Li4, Michael Mayo4, Richard
A. Moore4, Erin Pleasance4, Patrick Plettner4, Jacqueline E. Schein4, Arash Shafiei4,
Jared R. Slobodan4, Angela Tam4, Nina Thiessen4, Richard J. Varhol4, Natasja Wye4,
Yongjun Zhao4, Inanc Birol4, Steven J. M. Jones4, Marco A. Marra4;University of North
Carolina, Chapel Hill J.Todd Auman18, Donghui Tan19, Corbin D. Jones20, Katherine A.
Hoadley16,21,22, Piotr A. Mieczkowski22, Lisle E. Mose21, Stuart R. Jefferys22, Michael D.
Topal21,22, Christina Liquori16, Yidi J. Turman16, Yan Shi16, Scot Waring16, Elizabeth
Buda16, Jesse Walsh16, Junyuan Wu16, Tom Bodenheimer16, Alan P. Hoyle16, Janae V.
Simons16, Mathew G. Soloway16, Saianand Balu16, Joel S. Parker16, D. Neil Hayes16,23,
Charles M. Perou16,21,22;Harvard Medical School Raju Kucherlapati24,25, Peter
Park25,26,27;University of Southern California & Johns Hopkins University Hui
Shen17, Timothy Triche Jr17, Daniel J. Weisenberger17, Phillip H. Lai17, Moiz S.
Bootwalla17, Dennis T. Maglinte17, Swapna Mahurkar17, Benjamin P. Berman17, David
J. Van Den Berg17, Leslie Cope28, Stephen B. Baylin28, Peter W. Laird17Genome data
analysis: Baylor College of Medicine Chad J. Creighton1,2, David A. Wheeler1;Broad
Institute Gad Getz6,57, Michael S. Noble6, Daniel DiCara6, Hailei Zhang6, Juok Cho6,
David I. Heiman6, Nils Gehlenborg6,26, Doug Voet6, William Mallard6, Pei Lin6, Scott Frazer6, Petar Stojanov6,54, Yingchun Liu6, Lihua Zhou6, Jaegil Kim6, Michael S. Lawrence6, Lynda Chin6,31;Brown University Fabio Vandin8, Hsin-Ta Wu8, Benjamin J.
Raphael8;Buck Institute for Research on Aging Christopher Benz55, Christina Yau55;
Institute for Systems Biology Sheila M. Reynolds29, Ilya Shmulevich29;The University
of Texas MD Anderson Cancer Center Roel G.W. Verhaak9, Wandaliz Torres-Garcia9,
Rahul Vegesna9, Hoon Kim9, Wei Zhang10, David Cogdell10, Eric Jonasch9, Zhiyong
Ding9, Yiling Lu30, Rehan Akbani9, Nianxiang Zhang9, Anna K. Unruh9, Tod D.
Casasent9, Chris Wakefield9, Dimitra Tsavachidou30, Lynda Chin6,31, Gordon B. Mills30,
John N. Weinstein9;Memorial Sloan-Kettering Cancer Center Anders Jacobsen13, A.
Rose Brannon11, Giovanni Ciriello13, Nikolaus Schultz13, A. Ari Hakimi12, Boris Reva13,
Yevgeniy Antipin13, Jianjiong Gao13, Ethan Cerami13, Benjamin Gross13, B. Arman
Aksoy13, Rileen Sinha13, Nils Weinhold13, S. Onur Sumer13, Barry S. Taylor13, Ronglai
Shen13, Irina Ostrovnaya32, James J. Hsieh12, Michael F. Berger11, Marc Ladanyi12,
Chris Sander13;Oregon Health & Science University Suzanne S. Fei33, Andrew
Stout33, Paul T. Spellman33;Stanford University Daniel L. Rubin34, Tiffany T. Liu34;
University of California Santa Cruz Joshua M. Stuart15, Sam Ng15, Evan O. Paull15,
Daniel Carlin15, Theodore Goldstein15, Peter Waltman15, Kyle Ellrott15, Jing Zhu15,
David Haussler15,35;University of Houston Preethi H. Gunaratne1,3, Weimin Xiao3
Biospecimen core resource: International Genomics Consortium Candace Shelton36,
Johanna Gardner36, Robert Penny36, Mark Sherman36, David Mallery36, Scott Morris36,
Joseph Paulauskis36, Ken Burnett36, Troy Shelton36Tissue source sites: Brigham &
Women’s Hospital Sabina Signoretti7,54,59
,Dana-Farber Cancer Institute William G. Kaelin54,60, Toni Choueiri54;Georgetown University Michael B. Atkins37
;International Genomics Consortium Robert Penny36, Ken Burnett36, David Mallery36, Erin Curley36;
Memorial Sloan-Kettering Cancer Center Satish Tickoo11, Victor Reuter11;University
of North Carolina at Chapel Hill W. Kimryn Rathmell16, Leigh Thorne16, Lori Boice16,
Mei Huang16, Jennifer C. Fisher16;National Cancer Institute W. Marston Linehan14,
Cathy D. Vocke14, James Peterson14, Robert Worrell14, Maria J. Merino14, Laura S.
Schmidt14,38;The University of Texas MD Anderson Cancer Center Pheroze
Tamboli10, Bogdan A. Czerniak10, Kenneth D. Aldape10, Christopher G. Wood39;Fox
Chase Cancer Center Jeff Boyd40, JoEllen Weaver40;Helen F Graham Cancer Center
at Christiana Care Mary V. Iacocca41, Nicholas Petrelli41, Gary Witkin41, Jennifer
Brown41, Christine Czerwinski41, Lori Huelsenbeck-Dill41, Brenda Rabeno41;
Penrose-St. Francis Health Services Jerome Myers42, Carl Morrison42, Julie
Bergsten42, John Eckman42, Jodi Harr42, Christine Smith42, Kelinda Tucker42, Leigh
Anne Zach42;Roswell Park Cancer Institute Wiam Bshara43, Carmelo Gaudioso43,
Carl Morrison43;University of Pittsburgh Rajiv Dhir44, Jodi Maranchie44, Joel Nelson44,
Anil Parwani44;Cureline Olga Potapova45;St. Petersburg City Clinical Oncology
Dispensary Konstantin Fedosenko46;Mayo Clinic John C. Cheville58, R. Houston
Thompson58Disease working group: Brigham & Women’s Hospital Sabina
Signoretti7,54,59;Dana-Farber Cancer Institute William G. Kaelin54,60;Georgetown
University Michael B. Atkins37;Memorial Sloan-Kettering Cancer Center Satish
Tickoo11, Victor Reuter11;National Cancer Institute W. Marston Linehan14, Cathy D.
Vocke14, James Peterson14, Maria J. Merino14, Laura S. Schmidt14,38;The University of
Texas MD Anderson Cancer Center Pheroze Tamboli10;Weill Cornell Medical College
Juan M. Mosquera47, Mark A. Rubin47;Massachusetts General Hospital Michael L. Blute48
;University of North Carolina, Chapel Hill W. Kimryn Rathmell16Data
coor-dination centre: Todd Pihl49, Mark Jensen49, Robert Sfeir49, Ari Kahn49, Anna Chu49,
Prachi Kothiyal49, Eric Snyder49, Joan Pontius49, Brenda Ayala49, Mark Backus49,
Jessica Walton49, Julien Baboud49, Dominique Berton49, Matthew Nicholls49, Deepak
Srinivasan49, Rohini Raman49, Stanley Girshik49, Peter Kigonya49, Shelley Alonso49,
Rashmi Sanbhadti49, Sean Barletta49, David Pot49Project team: National Cancer
Institute Margi Sheth50, John A. Demchok50, Tanja Davidsen50, Zhining Wang50,
Liming Yang50, Roy W. Tarnuzzer50, Jiashan Zhang50, Greg Eley51, Martin L.
Ferguson52, Kenna R. Mills Shaw50;National Human Genome Research Institute
Mark S. Guyer53, Bradley A. Ozenberger53& Heidi J. Sofia53. 1
Human Genome Sequencing Center, Baylor College of Medicine, Houston, Texas 77030, USA.2
Dan L Duncan Cancer Center, Baylor College of Medicine, Houston, Texas 77030, USA.3
Department of Biology & Biochemistry, University of Houston, Houston, Texas 77204, USA.4
Canada’s Michael Smith Genome Sciences Centre, BC Cancer Agency, Vancouver, British Columbia V5Z, Canada.5
Department of Medicine, Harvard Medical School, Boston, Massachusetts 02215, USA.6
The Eli and Edythe L. Broad Institute of Massachusetts Institute of Technology and Harvard University, Cambridge, Massachusetts 02142, USA.7
Department of Pathology, Harvard Medical School, Boston, Massachusetts 02215, USA.8
Department of Computer Science, Brown University, Providence, Rhode Island 02912, USA.9
Department of Bioinformatics and
Computational Biology, The University of Texas MD Anderson Cancer Center, Houston, Texas 77030, USA.10
Department of Pathology, The University of Texas MD Anderson Cancer Center, Houston, Texas 77030, USA.11
Department of Pathology, Memorial Sloan-Kettering Cancer Center, New York, New York 10065, USA.12
Human Oncology and Pathogenesis Program, Memorial Sloan-Kettering Cancer Center, New York, New York 10065, USA.13
Computational Biology Center, Memorial Sloan-Kettering Cancer Center, New York, New York 10065, USA.14
Urologic Oncology Branch, Center for Cancer Research, National Cancer Institute, Bethesda, Maryland 20892, USA.15
Department of Biomolecular Engineering and Center for Biomolecular Science and Engineering, University of California Santa Cruz, Santa Cruz, California 95064, USA.16
Lineberger Comprehensive Cancer Center, University of North Carolina at Chapel Hill, Chapel Hill, North Carolina 27599, USA.17
USC Epigenome Center, University of Southern California, Los Angeles, California 90033, USA.18
Eshelman School of Pharmacy, University of North Carolina at Chapel Hill, Chapel Hill, North Carolina 27599, USA.19
Carolina Center for Genome Sciences, University of North Carolina at Chapel Hill, Chapel Hill, North Carolina 27599, USA.20
Department of Biology, University of North Carolina at Chapel Hill, Chapel Hill, North Carolina 27599, USA.21
Department of Pathology and Laboratory Medicine, University of North Carolina at Chapel Hill, Chapel Hill, Chapel Hill, North Carolina 27599, USA.22
Department of Genetics, University of North Carolina at Chapel Hill, Chapel Hill, North Carolina 27599, USA.23
Department of Internal Medicine, Division of Medical Oncology, University of North Carolina at Chapel Hill, Chapel Hill, North Carolina 27599, USA.24
Department of Genetics, Harvard Medical School, Boston, Massachusetts 02215, USA.25
Division of Genetics, Brigham and Women’s Hospital, Boston, Massachusetts 02115, USA.26
The Center for Biomedical Informatics, Harvard Medical School, Boston, Massachusetts 02115, USA.27
Informatics Program, Children’s Hospital, Boston, Massachusetts 02115, USA.28
Cancer Biology Division, The Sidney Kimmel
Comprehensive Cancer Center at Johns Hopkins University, Baltimore, Maryland 21231, USA.29
Institute for Systems Biology, Seattle, Washington 98109, USA.30
Department of Systems Biology, The University of Texas MD Anderson Cancer Center, Houston, Texas 77030, USA.31
Department of Genomic Medicine, University of Texas MD Anderson Cancer Center, Houston, Texas 77054, USA.32
Department of Epidemiology and Biostatistics, Memorial Sloan-Kettering Cancer Center, New York, New York 10065, USA.
33
Department of Molecular & Medical Genetics, Oregon Health & Science University, Portand, Oregon 97239, USA.34
Department of Radiology, Stanford University Medical Center, Stanford, California 94305, USA.35
Howard Hughes Medical Institute, University of California Santa Cruz, Santa Cruz, California 95064, USA.36
International Genomics Consortium, Phoenix, Arizona 85004, USA.37
Georgetown-Lombardi Comprehensive Cancer Center, Georgetown University, Washington DC 20057, USA.38
Basic Science Program, SAIC-Frederick, Inc., Frederick National Lab, Frederick, Maryland 21702, USA.
39
Department of Urology, The University of Texas MD Anderson Cancer Center, Houston, Texas 77030, USA.40
Cancer Biology Program, Fox Chase Cancer Center, Philadelphia, Pennsylvania 19111, USA.41
Helen F. Graham Cancer Center, Christiana Care, Newark, Delaware 19713, USA.42
Penrose-St. Francis Health Services, Colorado Springs, Colorado 80907, USA.43
Department of Pathology, Roswell Park Cancer Institute, Buffalo, New York 14263, USA.44
Department of Pathology, University of Pittsburgh, Pittsburgh, Pennsylvania 15213, USA.45
Cureline, Inc. South San Francisco, California 94080, USA.
46
St Petersburg City Clinical Oncology Dispensary, St Petersburg 198255, Russia.
47
Department of Pathology and Laboratory Medicine, Weill Cornell College of Medicine, New York, New York 10065, USA.48
Department of Urology, Massachusetts General Hospital, Boston, Massachusetts 02114, USA.49
SRA International, 4300 Fair Lakes Court, Fairfax, Virginia 22033, USA.50
The Cancer Genome Atlas Program Office, Center for Cancer Genomics, National Cancer Institute, Bethesda, Maryland 20892, USA.51
TCGA Consultant, Scimentis, LLC, Atlanta, Georgia 30666, USA.52
MLF Consulting, Arlington, Massachusetts 02474, USA.53
National Human Genome Research Institute, National Institutes of Health, Bethesda, Maryland 20892, USA.54
Department of Medical Oncology, Dana-Farber Cancer Institute, Boston, Massachusetts 02215, USA.55
Buck Institute for Research on Aging, Novato, California 94945, USA.56
Department of Cancer Biology, Dana-Farber Cancer Institute, Boston, Massachusetts 02215, USA.57
Cancer Center and Department of Pathology, Massachusetts General Hospital, 55 Fruit St, Boston, Massachusetts 02114.58
Mayo Clinic, Rochester, Minnesota 55905, USA.59
Department of Pathology, Brigham and Women’s Hospital, Boston, Massachusetts 02215, USA.
60