COMMON PATTERNS IN THE EVOLUTION
BETWEEN THE LUMINOUS NEUTRON STAR
LOW-MASS X-RAY BINARY SUBCLASSES
The MIT Faculty has made this article openly available.
Please share
how this access benefits you. Your story matters.
Citation
Fridriksson, Joel K., Jeroen Homan, and Ronald A. Remillard.
“COMMON PATTERNS IN THE EVOLUTION BETWEEN THE
LUMINOUS NEUTRON STAR LOW-MASS X-RAY BINARY
SUBCLASSES.” The Astrophysical Journal 809, no. 1 (August 10,
2015): 52. © 2015 The American Astronomical Society
As Published
http://dx.doi.org/10.1088/0004-637x/809/1/52
Publisher
IOP Publishing
Version
Final published version
Citable link
http://hdl.handle.net/1721.1/99904
Terms of Use
Article is made available in accordance with the publisher's
policy and may be subject to US copyright law. Please refer to the
publisher's site for terms of use.
COMMON PATTERNS IN THE EVOLUTION BETWEEN THE LUMINOUS NEUTRON STAR
LOW-MASS X-RAY BINARY SUBCLASSES
Joel K. Fridriksson1,2, Jeroen Homan2,3, and Ronald A. Remillard2 1
Anton Pannekoek Institute for Astronomy, University of Amsterdam, Science Park 904, 1098 XH Amsterdam, The Netherlands;[email protected]
2
Kavli Institute for Astrophysics and Space Research, Massachusetts Institute of Technology, 77 Massachusetts Avenue, Cambridge, MA 02139, USA
3
SRON, Netherlands Institute for Space Research, Sorbonnelaan 2, 3584 CA Utrecht, The Netherlands Received 2014 September 12; accepted 2015 March 29; published 2015 August 10
ABSTRACT
The X-ray transient XTE J1701–462 was the first source observed to evolve through all known subclasses of low-magnetic-field neutron star low-mass X-ray binaries (NS-LMXBs), as a result of large changes in its mass accretion rate. To investigate to what extent similar evolution is seen in other NS-LMXBs we have performed a detailed study of the color–color and hardness–intensity diagrams (CDs and HIDs) of Cyg X-2, Cir X-1, and GX 13+1—three luminous X-ray binaries, containing weakly magnetized neutron stars, known to exhibit strong secular changes in their CD/HID tracks. Using the full set of Rossi X-ray Timing Explorer Proportional Counter Array data collected for the sources over the 16 year duration of the mission, we show that Cyg X-2 and Cir X-1 display CD/HID evolution with close similarities to XTE J1701–462. Although GX 13+1 shows behavior that is in some ways unique, it also exhibits similarities to XTE J1701–462, and we conclude that its overall CD/HID properties strongly indicate that it should be classified as a Z source, rather than as an atoll source. We conjecture that the secular evolution of Cyg X-2, Cir X-1, and GX 13+1—illustrated by sequences of CD/HID tracks we construct—arises from changes in the mass accretion rate. Our results strengthen previous suggestions that within single sources Cyg-like Z source behavior takes place at higher luminosities and mass accretion rates than Sco-like Z behavior, and lend support to the notion that the mass accretion rate is the primary physical parameter distinguishing the various NS-LMXB subclasses.
Key words: accretion, accretion disks – stars: neutron – X-rays: binaries – X-rays: individual (Cir X-1, Cyg X-2, GX 13+1, XTE J1701–462)
1. INTRODUCTION
In neutron star low-mass X-ray binaries (NS-LMXBs), a neutron star accretes matter from a low-mass companion star. The vast majority of NS-LMXBs contains weakly magnetized neutron stars, and these systems are traditionally divided into two main subclasses based on their correlated spectral and timing properties: the Z sources and atoll sources(Hasinger & van der Klis 1989). The names derive from the shapes of the tracks the sources trace out in the X-ray color–color and hardness–intensity diagrams (CDs and HIDs). The Z sources are the more luminous, with near-Eddington X-ray luminosi-tities, whereas the atoll sources are thought to in general have
LX≲ 0.5LEdd. Further divisions of these two main NS-LMXB
types have also been made; in particular, the Z sources have been divided into the Cyg-like and Sco-like subtypes(Kuulkers et al.1997and references therein).
In addition to differences in X-ray luminosity, rapid-variability characteristics, and spectral properties (see, e.g., van der Klis 2006 and references therein), the NS-LMXB subclasses also differ with respect to behavior in the radio band (Migliari & Fender2006) and the rates and properties of type I X-ray bursts exhibited (Galloway et al.2008). Understanding what physical factors underlie this variety in characteristics has been a long-standing problem in the study of X-ray binaries. It has long been clear that the mass accretion rate must play an important role (e.g., it seems evident that Z sources must in general accrete at a higher rate than atoll sources, given the formerʼs significantly higher luminosity), but exactly what that role is, and where other physical parameters enter the picture, has been debated.
Another long-standing question concerns the physical nature of the motion of Z sources in the CD/HID. The Z sources trace
out characteristic tracks in the CD and HID(consisting of the so-called horizontal, normal, and flaring branches) on typical timescales of hours to a few days. Initially, it was assumed that motion along the Z track was driven by changes in the mass accretion rate, with M˙ increasing monotonically from the tip of the horizontal branch to the tip of the flaring branch (e.g., Hasinger et al.1990), but later observations cast doubts on this, and other scenarios have been proposed(see, e.g., van der Klis 2001; Homan et al. 2002, 2007; Church et al. 2012). In addition to motion along the tracks, these sources show another type of motion, usually on longer timescales(days to weeks), where the tracks can shift, primarily in the HID. This has been referred to as secular motion/shifts/changes/variations. In most cases these shifts are small and do not lead to significant changes in the shapes of the tracks. However, a few sources have been known to exhibit much stronger secular changes where the tracks shift and change shape radically in both the CD and HID.
A breakthrough in our understanding of the Z/atoll phenomenology and the nature of secular evolution came with the transient NS-LMXB XTE J1701–462, which over the course of its 2006–2007 outburst evolved through all subclasses of low-magnetic-field NS-LMXBs—from a Cyg-like Z source at the highest luminosities to a Sco-like one, followed by a phase in the atoll source soft state(during which type I X-ray bursts were seen), and ending with a transition to the atoll source hard state before returning to quiescence (Lin et al. 2009b; Homan et al. 2010). Lin et al. (2009b) performed a detailed spectral analysis of the entire outburst, using data from the Rossi X-ray Timing Explorer (RXTE), and their results indicate that changes in the mass accretion rate were responsible for the evolution of the source.
The Astrophysical Journal, 809:52 (21pp), 2015 August 10 doi:10.1088/0004-637X/809/1/52
Homan et al. (2010)—hereafter referred to as H10—further argue that the observed behavior of the source implies that differences in the mass accretion rate can alone explain the existence of the various NS-LMXB subclasses, and that it is not necessary to invoke differences in other parameters, such as the magnetic field of the neutron star (Hasinger & van der Klis 1989; Psaltis et al.1995) or the inclination angle of the system(Kuulkers & van der Klis 1995).
The main goal of this paper is to study to what extent(if any) evolution similar to that of XTE J1701–462 is observed in other sources. Comparisons of XTE J1701–462ʼs evolution at the low-luminosity end with atoll sources have been made in Lin et al. (2009b), H10, and Muñoz-Darias et al. (2014), showing that there the source behaved similar to other low-luminosity(atoll) NS-LMXBs; in this paper we focus mainly on the high-luminosity (Z source) portion of XTE J1701–462ʼs evolution. To this end we performed a detailed analysis of the CDs and HIDs of three luminous neutron star X-ray binaries—Cyg X-2, Cir X-1, and GX 13+1—using all available RXTE Proportional Counter Array (PCA) data. Similar to XTE J1701–462, these sources are known to have shown strong secular evolution(e.g., Oosterbroek et al. 1995; Kuulkers et al.1996; Wijnands et al. 1997; Shirey et al. 1999a; Schnerr et al.2003). Since we are mainly interested in sources that cross subclass boundaries, we do not include in our study persistent Z sources that show only mild secular shifts and no significant changes in the shapes of their tracks. Although small subsets of the RXTE data sets for Cyg X-2, Cir X-1, and GX 13+1 have been studied in several papers—usually with an emphasis on spectroscopy and/or timing analysis—we are not aware of any papers presenting a comprehensive study of the secular evolution of any of these sources using a large amount of RXTE data, with the exception of Schnerr et al.(2003), who studied a large set of observations of GX 13+1 made in 1998 (see discussion in Section 3.4). However, since then the amount of GX 13+1 data in the RXTE archive has grown considerably. We also note that Shirey and collaborators studied CDs and HIDs of Cir X-1 using a number of observations made in 1996 and 1997 in a series of papers (Shirey et al.1996,1998,1999a; see discussion in Section3.3), but these observations represent only a small fraction of the currently available RXTE data for this source. In addition to our analysis of Cyg X-2, Cir X-1, and GX 13+1 we also perform some reanalysis of XTE J1701–462 in order to ensure complete consistency with the analysis of the other three sources and to facilitate comparisons between them and XTE J1701–462. We note that although Cir X-1 may be a rare low-magnetic-field neutron star high-mass X-ray binary (as further discussed in Section3.3) we will for simplicity in general refer to all four sources studied in this paper as NS-LMXBs.
The structure of the paper is as follows. In Section 2 we describe the general data analysis steps common to all four sources, but leave the description of analysis specific to each source to Section 3. In Section 3.1 we briefly describe our analysis and present our results for XTE J1701–462. This analysis largely follows that previously performed by H10 (and includes creating a sequence of CD/HID tracks that shows the secular evolution of the source); we therefore mostly refer to that paper for details. In this section we also tie this sourceʼs behavior to the various source states/branches generally seen in the CDs and HIDs of NS-LMXBs. In Sections 3.2–3.4 we describe our analysis and present our results for Cyg X-2, Cir X-1, and GX 13+1, respectively. For
each source we construct a sequence of CD/HID tracks (analogous to the one for XTE J1701–462) that illustrates its secular evolution; we also give a brief background on each of these three sources. In Section4we discuss our results, and in Section5we give a summary of our results and conclusions.
2. DATA ANALYSIS 2.1. Data Extraction
We used the PCA data from all pointed RXTE observations of XTE J1701–462, Cyg X-2, Cir X-1, and GX 13+1 obtained during the lifetime of the mission. In Table1 we list the total amount of useful data(i.e., data remaining after the removal of X-ray bursts and bad data of any kind) for each of these sources. In the case of Cir X-1, however, the quoted exposure time includes data affected by local absorption; see Section3.3. Because of the large number of observations (over 2300 individual ObsIDs), most of the data analysis steps described below were automated.
The data were analyzed using HEASOFT, versions 6.9–6.12, as well as locally developed software. We used the Standard-2 data, extracting counts in 16 s time bins, combined from all three xenon layers, from all active Proportional Counter Units (PCUs) at any given time. The data were filtered following the recommendations of the RXTE Guest Observer Facility (GOF);4this included the removal of data around PCU voltage breakdown events (but only from the relevant PCU in each case). We also corrected for dead time using the standard procedure recommended by the RXTE GOF and subtracted background using the faint or bright background model as appropriate in each observation, based on the average count rate during the observation after exclusion of any type I X-ray bursts.
2.2. Burst and Particle Flare Removal
We removed all data obtained during type I X-ray bursts; to identify bursts in an automated fashion we used a method similar to the one used by Remillard et al.(2006). We note that although some bursts observed from Cyg X-2 and Cir X-1 do not show cooling along their tails—as is usually observed in type I X-ray bursts—the origin of these faint bursts is nevertheless very likely thermonuclear (Linares et al.2011) and they were removed.
PCUs 0 and 1 lost their propane layers in 2000 and 2006, respectively, diminishing their ability to reject events due to particle background. Based on a comparison with data from PCU 2—which did not suffer from such particle flares and was nearly always on—these events were identified and subse-quently removed from the data. We note that since PCU 2 data exist for all times during which PCU 0/1 data were removed, we did not exclude data from any given point in time entirely,
Table 1
Total Exposure Times for Analyzed Sources
Source Exp. Time(Ms) XTE J1701–462 2.71 Cyg X-2 2.28 Cir X-1 2.57 GX 13+1 0.58 4 Seehttp://heasarc.gsfc.nasa.gov/docs/xte/xhp_proc_analysis.html.
but simply reduced the number of PCUs contributing to a particular time bin in these cases.
2.3. Response Correction
From the Standard-2 data we extracted count rates in several different energy bands and used those to calculate colors for CDs and HIDs. The response of the RXTE PCUs evolved over the duration of the mission due to several factors, and these changes in response must be corrected for before data across the lifetime of the mission can be combined into a single CD or HID for a given source. For this correction we used observations of the Crab Nebula, which was observed on average ∼3 times per month throughout the mission. For each Crab observation, we extracted the average count rate in each of the energy bands of interest for each active PCU, using the Standard-2 data. We then fitted the mission-long light curve (where each data point represented the average count rate during a single observation) for each PCU in each energy band with a piecewise-linear function. We(somewhat arbitrarily) chose MJD 50800 (1997 Decem-ber 18) as our reference epoch and normalized all data points to that date,first for each PCU individually, and then in each case the count rates from PCUs 0, 1, 3, and 4 to that of PCU 2. Recently it has become apparent that X-ray emission from the Crab Nebula shows significant intrinsic variability. Wilson-Hodge et al. (2011) show that from 2001 to 2010 the RXTE PCA count rate from the Crab(after correcting for changes in response) varied rather irregularly by several percent. The(response-corrected) PCU 2 variability is ∼5% in the 2–15 keV band and ∼8% in the 15–50 keV band. This can compromise our correction for the variation in the PCA response. Comparing our mission-long Crab light curves to those of Wilson-Hodge et al. (2011) we can estimate the magnitude of the effect on our derived rates and colors. The relative amplitude of the Crab count rate fluctuations gradually increases with energy, but otherwise the variability behaves in more or less the same way in the different energy bands. This energy dependence of the variability should have some effect on the colors; however, given the relatively small difference in the strength of the variability between adjacent energy bands, we expect that this variability will largely cancel out in the colors. We estimate that shifts in our colors due to the Crab variability are at most∼1%–2% and in most cases significantly less; we therefore expect the influence of this on our results to be negligible (cf. discussion about uncertainty due to counting statistics in Section 2.4). The intensity is affected more strongly; we expect that shifts there can possibly be as high as∼6% in the worst case. However, they are generally much smaller—probably less than ∼4% in almost all cases and typically in the 0%–3% range—and we expect the effect of this on our results to in general be negligible as well.
2.4. Construction of CDs and HIDs
For the creation of CDs (i.e., hard color versus soft color) and HIDs (hard color versus intensity) we used color definitions similar to those used in H10: we defined our soft color as the net counts in the 4.0–7.3 keV band divided by those in the 2.4–4.0 keV band, and our hard color as net counts in the 9.8–18.2 keV band divided by those in the 7.3–9.8 keV band. The intensity we used for the HID was the net count rate
per PCU in the 2–60 keV band. Before creating our CDs and HIDs we combined the counts from all active PCUs for each 16 s time bin (after performing the corrections and filtering described above) and then rebinned the data in a given observation in order to maintain a more uniform size in the error bars across different values in count rate. We set a minimum of 16,000 counts in the 2–60 keV band (after background subtraction) for each rebinned data point. The rebinning was done in an adaptive/dynamic fashion—i.e., we in general did not use a single value for the time binning factor over an entire observation, but instead allowed the factor to vary (while imposing our counts limit) to adapt to a possibly varying count rate. In a few cases we applied a larger counts limit; these will be mentioned explicitly. In some instances entire observations did not contain enough counts to reach the 16,000 counts minimum; in those cases we created a single data point from the whole observation if the total number of counts was larger than 10,000, but excluded it from further consideration if it had fewer counts. (Any exceptions to this will be explicitly mentioned.) We note that for most observations of the four bright sources studied here no rebinning was necessary, since each 16 s time bin usually contained more than the minimum 16,000 counts. With this minimum counts limit the uncertainty due to counting statistics is at most∼2% in the soft color and at most ∼3% in the hard color (often much less); the uncertainty in the intensity is always less than 1%.
3. RESULTS 3.1. XTE J1701–462
XTE J1701–462 was discovered with the RXTE All-Sky Monitor (ASM) on 2006 January 18 as the source was entering outburst (Remillard & Lin 2006). The first RXTE PCA observation took place on 2006 January 19, and the source was subsequently observed with the PCA on average ∼1.5–2 times per day for the remainder of the 19 month outburst, apart from a∼50 day period in late 2006 and early 2007 during which the source could not be observed due to proximity to the Sun. The source returned to quiescence in early 2007 August and has since remained inactive apart from occasional low-level flaring (up to ∼1035erg s−1),
which has been observed by Swift and XMM-Newton (Fridriksson et al. 2010, 2011). As in H10, dates during the outburst will in this paper be referred to as days since the start of 2006 January 19 (MJD 53754.0).
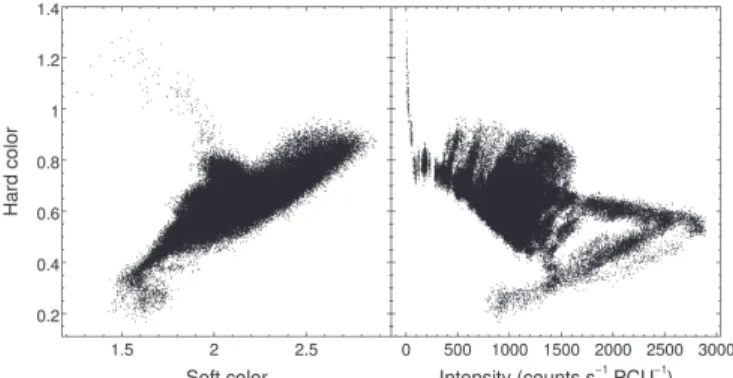
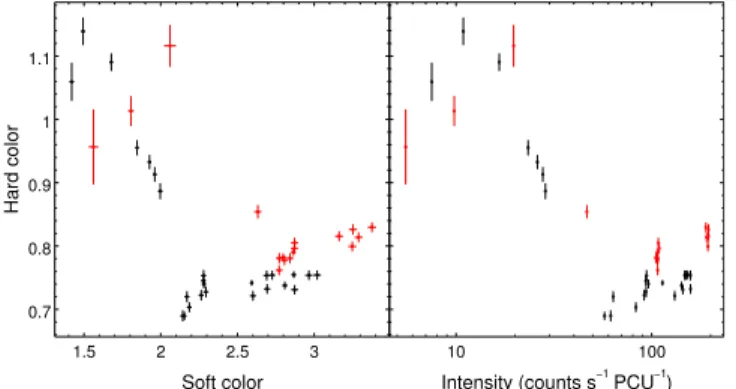
Figure 1. CD and HID representing the entire RXTE PCA data set of XTE J1701–462.
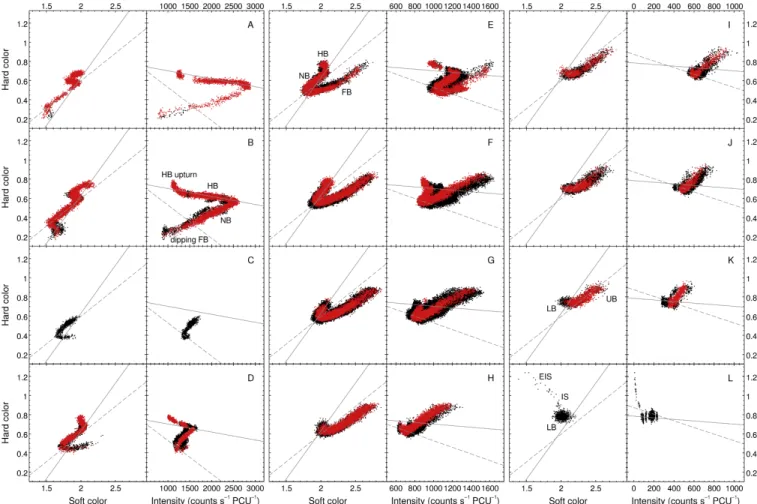
The combined CD and HID for the entire 2006–2007 outburst of XTE J1701–462 are shown in Figure1; the diagrams clearly illustrate that the source tracks exhibited strong secular motion during the outburst. As inH10 we divided the observations of the source into 12 subsets—hereafter referred to as selections— which we label A–L. In Figure2we show the CDs and HIDs for all 12 selections, which illustrate the secular evolution of the source during the outburst. We label the source states/branches of a few representative tracks: a Cyg-like Z track(selection B), a close-to Sco-like Z track (E), and two atoll-like tracks (K and L). For the Z-like tracks these are the horizontal branch (HB), the HB upturn, the normal branch(NB), the flaring branch (FB), and the dipping FB. For the atoll-like tracks these are the lower and upper banana branches(LB and UB), the island state (IS), and the extreme island state(EIS). The banana branch, IS, and EIS are also referred to as the soft, intermediate/transitional, and hard state, respectively. (We refer to H10 for examples of CDs/HIDs of several Cyg/Sco-like Z sources and atoll sources and a comparison of those with the CD/HID tracks of XTE J1701–462.)
The 12 data selections mostly correspond to particular ranges in the low-energy(2.0–2.9 keV) count rate, whichH10found to closely trace the secular changes during most of the outburst. This tracing of the secular evolution with the low-energy count
rate breaks down when the source enters the HB or a dipping FB. For days 0–28 time-based selections (A and B) were therefore used, rather than ones based on the low-energy count rate. In addition, data from several HB excursions taking place after day 28 had to be moved to the same selection as neighboring NB data in the low-energy light curve. The time and count rate intervals we used are given in Table2. Figure 2 inH10shows a low-energy light curve of the entire outburst, indicating the count rate intervals used there(which are for the most part equivalent to ours) and the HB data moved between selections.
Within most of the selections some secular motion is still evident, mostly in the HID. We therefore in 10 of the 12 selections color red the data points from a subset of the observations used in each case, to show tracks with minimal secular shifts; the subintervals in time or count rate defining these subsets are given in Table2. We also show, in both the CDs and HIDs, two straight lines that the NB/FB(lower) and HB/NB (upper) vertices of the tracks are seen to follow closely (as pointed out by Lin et al. 2009b). We note that selections A–L do not represent a strict monotonic progres-sion in time(although overall the evolution in time was from A to L); the source moved back and forth between selections during the outburst, mostly within the range F–H (see
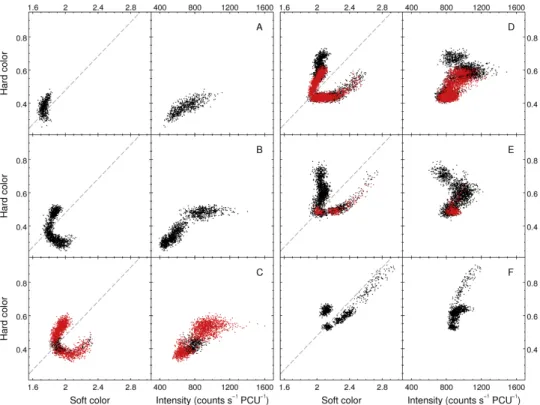
Figure 2. CDs and HIDs for XTE J1701–462, showing the secular evolution of the source. Each of the 12 panels (consisting of a CD on the left and an HID on the right) corresponds to a particular selection of data from the entire RXTE PCA data set for the source; red data points correspond to a particular subset (exhibiting minimal secular shifts) within a given selection (see Table2). Particular source states/branches are indicated in a few of the panels (see text for definitions). The
dashed and solid lines show the approximate paths followed by the NB/FB and HB/NB vertices, respectively, as the tracks evolve. Data are binned to a minimum of 16,000 counts per data point, except for the IS and EIS data in selection L, which are binned to a minimum of 64,000 counts. Note the change in the intensity scale between the different HID columns. We also note that essentially the same tracks(with only small modifications here) were presented in slightly different form in Figures3and4inH10.
Figure 2 inH10). It is clear from the sequence in Figure2that going from panel A to L the tracks smoothly evolve in shape from Cyg-like Z to Sco-like Z to atoll tracks as the upper and lower vertices both move monotonically along the vertex lines to higher color values and the overall intensity of the tracks decreases.
After day 566(as the outburst was ending) the count rate from the source reached a roughly constant level of∼2 counts s PCU−1 −1
in the 2–60 keV band (∼0.2 counts s PCU−1 −1 in the low-energy band). This residual flux can be attributed to diffuse Galactic background emission (see Fridriksson et al. 2010). Figure 3 shows an alternative version of panel L in Figure 2 where we have binned the data more heavily and have subtracted this diffuse background emission based on data from observa-tions made during the three weeks following the end of the outburst. In addition, we include in this version data from two observations made during days 564–566 (constituting the leftmost data point), which had a low-energy count rate of ∼0.36 counts s PCU−1 −1. We furthermore use a logarithmic scale
for the horizontal axis in the HID so as to better illustrate the behavior of the source at the lowest count rates.
3.2. Cyg X-2
Cygnus X-2 (Cyg X-2) is one of the longest-known and most extensively studied X-ray binaries. Cyg X-2 was classified as a Z source by Hasinger & van der Klis (1989) based on EXOSAT data and is the prototype of the Cyg-like subgroup of the persistent Z sources. However, as was clear already from pre-RXTE data Cyg X-2 is unique among the six “classic” (persistent Galactic) Z sources in that it shows by far the strongest secular evolution (e.g., Kuulkers et al. 1996; Wijnands et al.1997).
3.2.1. Analysis
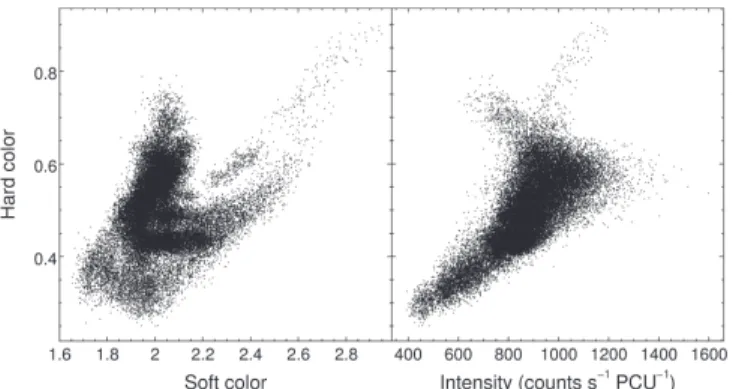
In Figure 4 we show a CD/HID based on the entire RXTE PCA data set for the source; strong variations in the shape and location of tracks are readily apparent. This combined CD/HID for Cyg X-2 has strong similarities to the one for XTE J1701–462 (Figure 1). However, the fragmented nature of the data set(obtained over a period of 15 years) forces us to
analyze the data in a manner different from the XTE J1701–462 analysis.
For this analysis we considered all 591 individual ObsIDs for pointed observations of Cyg X-2 made during the RXTE mission (13 of which contained no useful data). Often multiple observations were fairly densely clustered together in time. Going chronologically through the data set the source jumps erratically back and forth around the CD/HID, in any given observation usually tracing out only short partial track segments. As afirst step we went through the entire data set in time order, at any point combining into a single CD/HID track as many consecutive ObsIDs as possible without introducing clearly noticable secular shifts. We refer to such clusters of data (containing all data from a certain time interval) as subsets. In a few cases significant secular motion took place during a single ObsID, requiring the observation to be split up between two different subsets. To identify secular motion we examined the tracks not only in the CD and HID, but also in a diagram of soft color versus intensity(which we refer to as an SID). The SID frequently yielded useful extra information/constraints. The result of this process was∼300 subsets, which span periods as long as several days, although the vast majority are less than a day in length.
Considering only individual subsets results in a few tracks that seem to a large extent complete, but most of the subsets consist of shorter segments (i.e., incomplete tracks). By an “incomplete” track we mean that had the source stayed long enough at a particular stage in its secular progression(and had
Table 2
Time or Count Rate Intervals Used for Data Selections Selection Full Interval Subinterval
(counts s PCU−1 −1)a (counts s PCU−1 −1)a
A Days 13.5–20.5 Days 13.5–19.5 B Days 0–13.5 and 20.5–28 Days 2–13.5 C 106–114/Days 28–32.5 L D 83–106 89–97 E 66.5–83 72.5–78 F 56–66.5 56–58.36 G 46–56 50–52 H 38.5–46 39.6–43 I 31–38.5 33.5–35.5 J 23.5–31 26–28.5 K 15–23.5 20–22.5 L 0.4–15/Days 550–564 L Note. a
Count rates are in the 2.0–2.9 keV band. Time intervals refer to days since MJD 53754.0.
Figure 3. Alternative version of panel L in Figure2with the data binned into fewer groups and Galactic background emission subtracted. Data in the LB (i.e, intensity ≳65 counts s PCU−1 −1and hard color ≲0.85) are binned to a
minimum of 128,000 counts per data point; data in the IS and EIS are binned to approximately one data point per day. The data represented by the leftmost point were not included in Figure2.
our observational coverage of the source been sufficiently comprehensive during that time) we expect that the source would have traced out a fuller (i.e., continuous and possibly more extended) track. It is important to note that this “completeness” is a function of location in the secular progression, as not all branches of the Z track are present at every stage of the secular evolution, and that there is always some uncertainty regarding what constitutes a “complete” track.
Fortunately, it was in general possible to combine subsets from various times throughout the RXTE mission to form more complete tracks than are available from individual subsets. Usually, the most complete individual-subset tracks served as a foundation on which these combined tracks were built. To guide us in this process we took advantage of overlapping track segments and made sure that they lined up in all three diagrams —the CD, HID, and SID—which together provided a fairly stringent criterion for the appropriateness of combining particular segments.
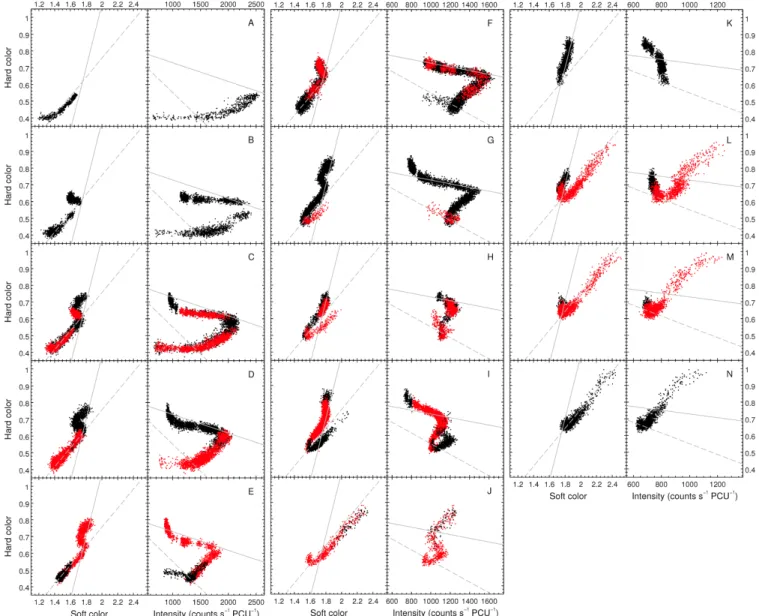
In Figure5we show a sequence of 14 tracks, chosen(from a larger set of tracks) to illustrate as clearly as possible the overall secular evolution exhibited by the source—both of the individual branches and the locations of the tracks—as they move through the CD/HID. As is the case for XTE J1701–462, the lower and upper vertices approximately follow straight line paths in both the CD and HID as the tracks evolve and shift in the diagrams. We show illustrative lines in Figure5and order the panels based on the vertex locations of the tracks, starting (panel A) at the highest intensities and lowest color values.
The number of individual subsets in the tracks in the Cyg X-2 sequence ranges from 1 to 10. The subsets(i.e., time intervals) and ObsIDs used for each panel in Figure 5 are listed in Table3. For the panels that consist of more than one data subset (i.e., all except A, B, K, and N), a single representative subset is plotted in red. The combined exposure time of the data shown in Figure 5 is ∼31% of the total exposure time of the Cyg X-2 data set(see Table1). As far as we can tell, practically all the remaining data seem to belong
Figure 5. Sequence of CDs and HIDs for Cyg X-2 illustrating the secular evolution of the source. Table3lists the data used in each panel. In general, a panel combines data from observations widely separated in time(by months or years); exceptions to this are panels A, B, K, and N. In each of the other panels, a particular subset of the data—obtained over a period of at most a few days—is shown in red. The dashed and solid lines show the approximate paths followed by the lower and upper vertices, respectively. Note the change in the intensity scale between the different HID columns.
Table 3
Time Intervals and Observations Used to Create Cyg X-2 Tracks
Panel Time Interval(MJD)
Interval Length days(hr)a ObsIDs Exp. Time ks(hr)b A 50316.592–50316.764 0.17(4.1) 10063-[09:10]-01-00 9.0(2.5) B 51697.550–51698.705 1.15(27.7) 40019-04-05-[00:10] 33.9(9.4) C 50996.450–51000.593 (R) 4.14(99.4) 30418-01-[(01:05)-00,02-01] 37.4(10.4) 51561.344–51561.517 0.17(4.1) 40017-02-19-00 10.1(2.8) 53138.767–53138.855 0.09(2.1) 90030-01-16-00 5.2(1.4) 53788.496–53788.577 0.08(2.0) 91009-01-42-[00:01] 2.7(0.7) 54649.890–54650.626 0.74(17.6) 93443-01-01-[02,14:21] 23.6(6.6) D 51009.488–51009.725 0.24(5.7) 30046-01-01-00 12.9(3.6) 51349.631–51349.669 0.04(0.9) 40017-02-09-01 3.3(0.9) 53079.687–53079.785 0.10(2.3) 90030-01-04-00 5.2(1.4) 53222.440–53222.532 0.09(2.2) 90030-01-33-[00:01] 4.8(1.3) 53286.420–53286.512 0.09(2.2) 90030-01-46-00 5.3(1.5) 53291.340–53291.433 0.09(2.2) 90030-01-47-00 5.4(1.5) 54007.232–54007.331 0.10(2.4) 92039-01-15-00 5.7(1.6) 54009.195–54010.341 1.15(27.5) 92039-01-[17,18]-00 8.2(2.3) 54452.324–54452.554 0.23(5.5) 90022-08-04-[00:01] 9.5(2.6) 54648.066–54649.329 (R) 1.26(30.3) 93443-01-01-[00,000,03:13] 37.2(10.3) E 50168.900–50169.731 (R) 0.83(20.0) 10066-01-01-[00,000,001] 37.3(10.4) 51048.360–51048.599 0.24(5.7) 30046-01-07-00 13.4(3.7) F 51055.495–51055.782 0.29(6.9) 30046-01-08-00 13.4(3.7) 51266.719–51267.126 0.41(9.8) 40017-02-05-[00:01] 15.9(4.4) 51413.523–51413.746 0.22(5.4) 40017-02-12-00 13.0(3.6) 52429.372–52429.908 0.54(12.9) 70016-01-01-[02,04:06] 12.4(3.4) 53511.868–53512.546 0.68(16.3) 91010-01-01-[01,06:09] 29.9(8.3) 53685.118–53685.193 0.08(1.8) 90030-01-82-00 4.3(1.2) 54395.861–54398.037 (R) 2.18(52.2) 92038-01-[08-(00:02),09-(00:02),10-(00:03)] 12.3(3.4) G 51081.447–51081.725 0.28(6.7) 30046-01-12-00 14.3(4.0) 51444.401–51445.215 0.81(19.5) 40019-04-[01-01G,01-02G,01-03,02-00,02-000] 17.6(4.9) 52533.929–52535.087 1.16(27.8) 70015-02-[01-01G,02-00] 19.1(5.3) 53311.026–53311.105 0.08(1.9) 90030-01-51-[00:01] 2.6(0.7) 53335.431–53335.724 0.29(7.0) 90022-08-01-00, 90030-01-56-[00:01] 8.2(2.3) 53375.032–53375.053 0.02(0.5) 90030-01-64-00 1.8(0.5) 53394.710–53394.812 0.10(2.5) 90030-01-68-00 6.3(1.8) 53488.223–53488.310 0.09(2.1) 91009-01-12-[00:01] 3.4(0.9) 53493.152–53493.227 (R) 0.07(1.8) 91009-01-13-[00:01] 2.8(0.8) 53498.069–53498.142 0.07(1.8) 91009-01-14-00 3.1(0.9) H 51539.192–51539.562 (R) 0.37(8.9) 40017-02-18-[00:02] 14.4(4.0) 53119.069–53119.174 0.10(2.5) 90030-01-12-00 6.8(1.9) 53330.721–53330.805 0.08(2.0) 90030-01-55-[00:01] 2.9(0.8) 53347.497–53347.527 0.03(0.7) 90022-08-02-00 2.6(0.7) 53744.187–53744.278 0.09(2.2) 90030-01-94-00 5.2(1.4) 54388.862–54389.040 0.18(4.3) 92038-01-01-[00:02] 3.8(1.1) I 50629.832–50631.933 (R) 2.10(50.4) 20053-04-01-[00:04,06,010,020,030]c 77.5(21.5) 51029.751–51030.032 0.28(6.7) 30046-01-04-[00:01] 13.8(3.8) 53266.795–53266.821 0.03(0.6) 90030-01-42-00 2.3(0.6) 53758.990–53759.021 0.03(0.7) 90030-01-97-00 2.7(0.7) 54427.903–54428.970 1.07(25.6) 93082-02-04-[00:01] 2.4(0.7) J 53123.996–53129.015 (R) 5.02(120.5) 90030-01-[13:14]-00 8.8(2.4) 53320.893–53320.934 0.04(1.0) 90030-01-53-[00:01] 1.4(0.4) K 51528.887–51529.451 0.56(13.5) 40019-04-[03-01,04-(00:01),04-000] 22.8(6.3) L 50719.393–50719.759 0.37(8.8) 20057-01-01-[00,000] 20.2(5.6) 51536.473–51536.968 (R) 0.50(11.9) 40021-01-02-[00:04]d 19.2(5.3) M 51535.886–51536.436 (R) 0.55(13.2) 40021-01-[01-01,02-00,02-000]d 26.7(7.4) 53202.754–53202.834 0.08(1.9) 90030-01-29-00 4.3(1.2) N 51535.010–51535.571 0.56(13.5) 40021-01-01-[00,000,02] 25.8(7.2)
Notes.Subsets colored in red in Figure5are denoted by(R) in the Time Interval column. In the ObsIDs column a colon denotes a range.
a
The interval length is shown in units of both days and hours.
b
The total exposure time is shown in units of both ks and hours.
c
As the source showed significant secular motion during observation 20053-04-01-04, only an early part of it was used.
d
The source showed clear secular motion during observation 40021-01-02-00. Data from thefirst two orbits were used in panel M and data from the third (and final) orbit was used in panel L.
to tracks similar to (and usually intermediate between) the ones shown in Figure 5 (i.e., none of the other subsets is inconsistent with belonging to such tracks).
Although the tracks in panels K and L do not line up well enough in the HID(contrary to the CD) to be combined into a single track, together they should give a reasonably good idea of the rough shape of a (near-)complete track at this point in the secular progression. It is clear that such a track is similar in shape to those of the Sco-like Z sources.
We note that small secular shifts do occur in some of these tracks; some of the individual segments used have a broad appearance(e.g., the red-colored segment in panel D), which is in some cases probably due to mild secular motion, and in some instances we matched up segments despite their not lining up perfectly in the HID or SID if the overall appearance of the track is only minimally affected by this. There was inevitably sometimes some ambiguity regarding whether certain segments used in a given track rather belonged to a track slightly shifted from the one in question. In particular, the HB upturn was usually observed in short isolated segments in the CD/HID, and it was often hard to judge exactly with which tracks those should be combined. However, the overall conclusions about the secular evolution of the source that we infer from the data are not sensitive to these ambiguities in the combining process. Finally, we note that many of the tracks in Figure 5 likely still suffer from some incompleteness, either because data segments that would serve to complete them are simply not available in the Cyg X-2 data set, or because we felt that there was too much ambiguity in whether candidate segments were appropriate. In particular, we conclude that the track in panel A is likely missing the HB, the tracks in panels B and F are presumably missing(most of) the HB upturn, the one in panel H is missing most of the HB, the track in panel J is missing the NB and HB, and the one in panel K is missing the FB.
3.2.2. Comparison with XTE J1701–462
Cyg X-2 exhibits secular evolution that is for the most part very similar to that of XTE J1701–462. As the overall intensity decreases the tracks smoothly evolve in shape from Cyg-like to Sco-like Z tracks. The tracks in Cyg X-2 panels A–E (Figure5) are very similar to the Cyg-like Z tracks of XTE J1701–462 in panels A and B. Taken together, the tracks in Cyg X-2 panels K and L show that at this point in the secular progression of the source its tracks look similar to (and perhaps intermediate between) those in XTE J1701–462 panels E and F, the latter of which is very similar to the tracks of the persistent Sco-like Z sources, such as GX 17+2 (see, e.g., H10; Lin et al. 2012). Finally, the tracks in Cyg X-2 panels M and N look very similar to the tracks in XTE J1701–462 panels G and H. As the Cyg X-2 tracks shift and evolve in shape, both the upper and lower vertices quite closely follow straight lines in the CD and HID; as the overall intensity of the tracks decreases, the NB is squeezed between the converging vertex lines and gradually shortens, as observed in XTE J1701–462.
The main differences between Cyg X-2 and XTE J1701–462 lie in the fact that Cyg X-2 is persistently luminous and has never been seen to enter the atoll regime(although the track in panel N does not seem to have an NB, short NB segments seem to exist down to the very lowest intensities observed in the Cyg X-2 data set) and in the somewhat different FB behavior exhibited by Cyg X-2. In both sources the FB gradually
evolves from being a purely dipping FB in the earliest (highest-intensity, Cyg-like) panels to a “proper” flaring (Sco-like) FB in later panels. However, in Cyg X-2 the rotation of the FB is for the most part in the opposite direction to that seen in XTE J1701–462 in both the CD and HID. In Cyg X-2 the FB also develops a more complicated morphology in the HID, making a counterclockwise twist of between 180° and 270° around the lower vertex in panels G and H(such a twist was also observed in EXOSAT data by Kuulkers et al. 1996) and then assuming a jagged S-like shape in panels I and J that gradually straightens out going from panel I to N. We note that a similar, although less pronounced, S-shaped FB was observed in the HID of panel E in XTE J1701–462.
3.3. Cir X-1
Circinus X-1(Cir X-1) features some of the richest and most complex phenomenology seen among the known neutron star X-ray binaries, and although it has been extensively studied for over four decades many of its properties remain poorly understood. The binary has an orbital period of ∼16.6 days, identified from periodic flaring first observed in the X-ray band (Kaluzienski et al.1976), and later in the radio, infrared, and optical(Whelan et al.1977; Glass1978; Moneti1992). These flares are thought to be due to enhanced accretion near periastron passage in a highly eccentric orbit (e.g., Murdin et al. 1980; Tauris et al. 1999; Jonker & Nelemans 2004). Heinz et al.(2013) identify the radio nebula surrounding the binary as a relatively young(≲5000 yr old) supernova remnant, which makes Cir X-1 the youngest known X-ray binary and provides an explanation for the eccentricity of the orbit. This implies that the donor is likely an early-type star (see also Jonker et al.2007). However, type I X-ray bursts detected from the source(Tennant et al. 1986a, 1986b; Linares et al. 2010) show that the neutron star is weakly magnetized, which is very unusual for a high-mass companion.
The X-ray emission from Cir X-1 is highly variable on a wide range of timescales. In Figure6we show an RXTE ASM light curve of the source. The source was in a historically high state during thefirst few years of the RXTE mission (Parkinson et al. 2003), with an average flux of ∼1.3 Crab (and a maximum observedflux with the ASM of ∼3.5–4 Crab). The flux started gradually decreasing in mid-to-late 1999, and kept doing so until the source became undetectable with the ASM and showed no measurable activity over a two-year period in 2008–2010. In 2009 the source was observed with Chandra at aflux of only a few tenths of a milliCrab (Sell et al. 2010). Since 2010 May, however, the source has shown sporadic activity. When active the source usually exhibits complex variability over the course of an orbital period, featuring both absorption dips andflaring in the X-ray band; the effects of this on the ASM light curve can easily be seen in Figure6. In the inset we showfive orbital cycles from the bright phase of the source early in the RXTE mission. X-ray flaring is strongest during thefirst few days after it commences; it then gradually decreases in strength as the orbit progresses. The source usually exhibits strong X-ray dipping during the last ∼0.5–1 days before the onset offlaring and then intermittent dips for up to two days afterwards (Shirey et al. 1998); we discuss this dipping in more detail below.
Oosterbroek et al.(1995) reported indications of both Z and atoll behavior in EXOSAT data of Cir X-1. Shirey et al.(1999a) analyzed data from 10 days of RXTE PCA observations in
1997. They detected all three Z branches—although with some differences in shape compared to the classic Z sources—and found that the tracks moved around the CD/HID and evolved in shape. The identifications of the Z branches were supported by timing data.
3.3.1. Analysis
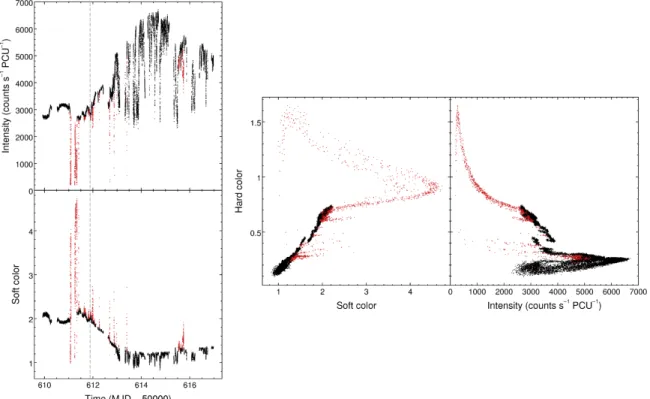
In our analysis we considered all 811 individual ObsIDs for pointed observations of Cir X-1 made during the RXTE mission (18 of which contained no useful data). A CD/HID using the entire data set(which spans ∼15 years) is shown in the upper plot in Figure7. The diagrams are heavily affected by both absorption and secular shifts and shape changes in the source tracks. As mentioned above, most of the dipping occurs close to the time of presumed periastron passage, which is often associated withflaring. Clarkson et al. (2004) fitted a quadratic ephemeris to the times of dips observed in RXTE ASM data from 1996 to 2003 and found that it provides a good predictor of the X-ray light curve. The strongest dipping often produces a characteristic track in the CD and HID; this track goes up to high color values and has two sharp bends in the CD. This can be seen in Figures7 and8; in the latter we show various diagrams for 7 days of observations in 1997 June, which we discuss further below.(The observations used in Figure 8 constitute the bulk of the data analyzed by Shirey et al.1999a). The shape of these dipping tracks can be understood if the X-ray emission is composed of two components: a bright component that is subject to heavy absorption and a faint component that is unaffected by the absorption, the latter perhaps due to X-rays from the central source scattered into our line of sight by surrounding material (Shirey et al. 1999b). We note that the source also often exhibits shallower dips (also seen in Figure8) which do not result in a(full) track of the sort described above.
Before proceeding with our analysis of the Cir X-1 data set we removed by eye(to the extent possible) data points affected by absorption dips. An example of this is shown in Figure 8, where removed data points are colored red. As can be seen in thefigure, during these observations the source showed intense dipping shortly before the start of flaring (at day ∼611.5), producing the characteristic dipping track in the CD/HID. Some shallower dips were then observed during the first
∼2 days of flaring. We note that the periodic “flaring” during an orbital cycle is in general associated with motion along all three (Cyg-like) Z branches, rather than being exclusively associated with motion along the FB (which is mostly a dipping FB in these particular observations). As is apparent from the figure, it is almost impossible to identify absorption dips on the basis of the light curve alone during periods of flaring. However, tracking the behavior of the soft color (and, to a lesser extent, the hard color) as a function of time, as well as inspecting the CD and HID, greatly aids in identifying dipping. In addition, we took into account the dipping ephemeris of Clarkson et al. (2004) when performing the removal, since the vast majority of dipping events take place in the∼1–1.5 days immediately before or after phase 0. However, we note that (shallow) dips are sometimes seen later in an orbital cycle; one example can be seen in Figure8. In general, when unsure whether a given data segment was afflicted by dipping or not, we in general opted to rather err on the side of caution and remove the segment in question. The “cleaned” CD/HID resulting from our manual removal of absorption-affected data is shown in the lower plot in Figure7. It was of course unavoidable that some instances of minor dipping remain and that a small amount of unaffected data be removed. However, we expect that the effects of this on the conclusions we draw from the data are negligible.
After removing data points affected by absorption dips, as described above, we organized the data into subsets, similar to our Cyg X-2 analysis described in the previous section. This resulted in ∼300 subsets spanning periods as long as several days, although most are less than a day in length. From these, we created a sequence of 12 CD/HID(partial) tracks, shown in Figure9. These tracks were chosen to illustrate as best possible
Figure 6. RXTE ASM light curve of Cir X-1 covering the entire lifetime of the RXTE mission. Data points in the main plot are one day averages. The inset zooms in onfive orbital cycles in early 1997; each data point there corresponds to a single dwell of the ASM. The long-dashed lines in the main plot and inset show the typical ASM count rate level for the Crab Nebula.
Figure 7. CD and HID representing the entire RXTE PCA data set of Cir X-1 before (upper plot) and after (lower plot) the removal of data affected by absorption. A small portion of the data at very high soft and hard color values falls outside the diagrams in the upper panel. Note the differences in scale in soft and hard color between the upper and lower panels.
the overall secular behavior of the source. In all cases except two, the data in a given panel are from a single subset, whose time intervals range from∼2 hr to ∼7 days. The exceptions are panels A and I, where 2–3 independent segments (shown in different colors) were combined. It was not viable to form a whole sequence of combined and more complete tracks, as we did for Cyg X-2, since the data for Cir X-1 show a much greater dynamic range and do not sample the HID densely enough for this. Overall, the upper and lower vertices of the Cir X-1 tracks move systematically up and to the right in the CD, and up and to the left in the HID, as the tracks evolve in shape—similar to the behavior seen in XTE J1701–462 and Cyg X-2. The paths of the vertices can be approximated by the straight lines shown in Figure9. We order the tracks based on the position of the lower and/or upper vertex in the CD.(When both are present, the two vertices give consistent results.) In cases where some ambiguity remains due to very similar vertex locations (in particular, panels F and G), we use the shape of the track in the CD to decide the ordering, in particular the FB (i.e., we choose the ordering that produces a gradual evolution in the shape of the track in the CD). The combined exposure time of the data shown in Figure 9 is ∼10% of the total exposure time of the Cir X-1 data set. The data subsets (time intervals) and ObsIDs used in each panel are listed in Table4. We note that a few of the tracks in Figure 9 show some signs of secular motion in the HID(but much less in the CD); however, in most cases this has a negligible effect on the overall appearance of the track. The instance where this is most noticable is in the HID of panel E, where the upper parts of the track (NB and especially HB) show shifting toward lower intensities relative to the FB. A similar, but smaller, shift affects the HID in panel F. We also note that the behavior
of Cir X-1 is not as regular as that of XTE J1701–462 and Cyg X-2, and the vertices in the HID(and to a lesser extent in the CD) often deviate significantly from the lines shown. As will be discussed in Section 4, the relationship between a trackʼs shape and its location in the HID is also not nearly as tight for Cir X-1 as for XTE J1701–462 and Cyg X-2, where the motion of both vertices in both the CD and HID, as well as the decrease in overall intensity, is monotonic along the entire sequence. The behavior of Cir X-1 is more regular in the CD than the HID, which is why we chose to use the CD as the basis for our ordering of the tracks. However, apart from some irregularities in panels F–I, the Cir X-1 sequence does show a gradual decrease in overall intensity.
Panel L shows what seems to be an atoll transition from the banana branch through the IS and to an EIS. These data were obtained in 2010 May/June as the intensity steadily decreased over a∼7 day period (part of a ∼50 day minioutburst following two years of nondetection by the RXTE ASM). Observations preceding this 7 day period show what looks like a sequence of segments at successively lower count rates from tracks similar to the one in panel K. Figure 10 shows the same data as in panel L (in black) but with more binning. D’Aì et al. (2012) studied the spectral evolution of the source during the entire 2010 May–June minioutburst with spectral fitting and also concluded that the source transitioned from the atoll soft to hard state. In 2010 August the source showed a similar transition(again with an intensity decline over ∼7 days), which we show with red data points in Figure10. We note that the apparent decrease in hard color with decreasing intensity in the EIS in both cases may well be due to soft diffuse background emission (which could not be subtracted) affecting the data points at the lowest intensities.
Figure 8. Diagrams demonstrating the removal of data affected by absorption from 7 days of observations of Cir X-1 in 1997 June; the left plot shows intensity and soft color as a function of time, and the right plot shows a CD/HID. We identified the red data points with absorption and removed them from the data set before proceeding with further analysis. In the left plot the dashed vertical line shows the time of zero phase according to the dipping ephemeris of Clarkson et al.(2004).
3.3.2. Comparison with XTE J1701–462 and Cyg X-2
Like XTE J1701–462, Cir X-1 has been observed in all NS-LMXB subclasses (Cyg-like Z, Sco-like Z, atoll). The overall secular evolution has many similarities to that observed for XTE J1701–462 and Cyg X-2, and many of the individual tracks have shapes similar to those seen for those two sources. Progressing along the Cir X-1 sequence, the NB grows shorter and rotates counterclockwise in the HID, while the HB rotates clockwise as it shortens, similar to what was seen for XTE J1701–462 and Cyg X-2. As in those two sources the FB shows the most complex behavior of the three branches in Cir X-1. In the CD of Cir X-1 the FB gradually rotates counterclockwise and evolves in shape in a similar fashion to XTE J1701–462. In the HID the behavior of the FB is more irregular in Cir X-1 than XTE J1701–462 and Cyg X-2, but overall it seems to rotate counterclockwise as it evolves from a dipping FB in the higher-intensity tracks to a Sco-like FB at lower intensities. In panel G, the Cir X-1 FB in both the CD and HID has a shape similar to those of the persistent Cyg-like Z sources GX 340+0 and GX 5–1 (see, e.g., Jonker et al.1998,2002; H10). We note that in the CD of XTE J1701–462 the shape and orientation of the FB in panels A and B seems intermediate between Cir X-1 panels E and F, whereas the
XTE J1701–462 FB in panels C (which has a very incomplete track) and D seems intermediate between Cir X-1 panels G and H. XTE J1701–462 may therefore have traced out a CD (and HID) track similar to those of GX 340+0 and GX 5–1 in between panels B and C; this portion of the secular progression of the source was missed due to a gap in RXTE coverage and rapid secular evolution. However, we note that in none of the four sources compared in this paper do we see a full track in both the CD and HID where the shapes of all three spectral branches closely match those of GX 5–1 and GX 340+0.
The atoll transitions of Cir X-1—especially the one in 2010 May/June—resemble the one of XTE J1701–462 (see Figures3 and10); one notable similarity is that the soft color decreases significantly throughout the transitions, in contrast to the increase observed in most atoll sources(e.g., Fridriksson2011). However, there is also a striking difference between the atoll transitions of the two sources: the data from the banana branch preceding the ascent to the hard state extend to very high soft color for Cir X-1, occupying parameter space in the CD never explored before by the source in the RXTE archive except during absorption dips or(partly) during traversals to the tip of the(nondipping) FB. The data points in question are unlikely to be associated with the FB, given the small changes in intensity and hard color observed, and the long timescale
Figure 9. Sequence of CDs/HIDs for Cir X-1 illustrating the secular evolution of the source. The data points in each panel were obtained within a relatively short period of time, ranging from∼4 hr to ∼7 days, except for panels A and I, which combine three and two segments, respectively, widely separated in time (with each segment shown in a particular color). The dashed and solid lines are lower and upper vertex lines similar to those shown for XTE J1701–462 and Cyg X-2. Data are binned to a minimum of 16,000 counts per data point, except for IS and EIS points in panel L, which are binned to a minimum of 32,000 counts. Note the change in the intensity scale between the different HID columns.
involved (more than a day). This pre-atoll-transition behavior of Cir X-1 is in stark contrast to XTE J1701–462, where no such excursion to high soft color values was seen, and the region occupied by the source in the CD in selection L before moving to the IS was a logical extension of the movement of the source in the preceding selections. We also note that the observations in 2010 May/June were the first time in almost 15 years of RXTE observations that Cir X-1 was seen to transition to the atoll hard state.
The Cir X-1 track in panel D bears a strong resemblance in shape to the highest-intensity tracks (panels A and B) of XTE J1701–462 (in particular when the HID is plotted on the same scale) and occupies a similar color range (especially in hard color). But Cir X-1 also shows tracks that reach much higher intensities(panels A–C). Going from panel D to A in the Cir X-1 sequence, the overall color values of tracks decrease and the color range spanned drops sharply as the intensity swings become larger, resulting in very stretched and flat tracks in the HID. In these “extreme” Cyg-like Z tracks in panels A and B, Cir X-1 exhibits much lower color values than ever observed for any of the other three sources analyzed in this paper, and it is striking how small the color variations along the tracks are despite the large changes in intensity.
3.4. GX 13+1
GX 13+1 is a bright X-ray binary whose classification as a Z or atoll source is ambiguous, although it has usually been labeled an atoll source. Hasinger & van der Klis (1989) classified GX 13+1 as a bright atoll source based on CDs and power spectra from EXOSAT observations. In RXTE observations from 1996, Homan et al. (1998) discovered a 57–69 Hz QPO, which showed similar behavior to the horizontal-branch oscillation(HBO) seen in Z sources. Schnerr et al. (2003) performed a combined CD, HID, and power-spectral analysis of a large number of RXTE observations made in 1998. They found that the source traced out, on a timescale of hours, a curved two-branched track in the CD, which
Table 4
Time Intervals and Observations Used for Cir X-1 Tracks
Interval Length Exp. Time Panel Time Interval(MJD) days(hr)a ObsIDs ks(hr)b
A 50365.216–50365.307 0.09(2.2) 10068-08-02-00 5.5(1.5) 50497.364–50497.437 (G) 0.07(1.8) 20095-01-01-00 4.8(1.3) 50711.692–50711.763 (R) 0.07(1.7) 20095-01-18-00 5.9(1.6) B 50613.800–50614.155 0.36(8.5) 20094-01-02-[04,040]c 21.6(6.0) C 51603.985–51604.316 0.33(8.0) 40059-01-01-[00,02]c 13.1(3.6) D 52615.803–52618.276 2.47(59.4) 70020-01-[02-(01:02),03-01,03-04,04-(00:04)] 37.9(10.5) E 53013.822–53017.845 4.02(96.6) 70020-03-04-[00:20] 34.6(9.6) F 53163.821–53165.483 1.66(39.9) 80027-02-[02-02,02-06,03-(00:02),03-06] 31.0(8.6) G 51831.981–51832.459 0.48(11.5) 50136-01-04-[00:06] 18.7(5.2) H 53168.550–53168.789 0.24(5.7) 80027-02-04-01 14.1(3.9) I 52787.744–52787.894 (R) 0.15(3.6) 80114-04-01-[02:04] 4.4(1.2) 52951.992–52952.229 0.24(5.7) 80027-01-01-[02:03] 9.4(2.6) J 53003.507–53003.590 0.08(2.0) 70020-03-01-01 5.6(1.6) K 53271.381–53271.787 0.41(9.8) 90025-01-02-[02,24,25,27] 7.9(2.2) L 55343.361–55350.716 7.36(176.5) 95422-01-[03-(03:04),04-(00:13)] 49.4(13.7) Notes.Subsets colored in red/green in Figure5are denoted by(R)/(G) in the Time Interval column. In the ObsIDs column a colon denotes a range.
a
The interval length is shown in units of both days and hours.
bThe total exposure time is shown in units of both ks and hours. c
The early parts of observations 20094-01-02-040 and 40059-01-01-00 were omitted due to secular motion.
Figure 10. CD/HID showing two instances of Cir X-1 undergoing an atoll transition from the soft to hard state. Black data points are from a ∼7 day period in 2010 May/June(also shown in panel L in Figure9) and red data
points are from a∼7 day period in 2010 August. The data were binned with a minimum of 128,000 counts per data point. In some cases entire observations did not have that many counts and were combined with other ones close in time.
showed strong secular motion on a timescale of∼1 week. The shape of the track was similar to the lower part(IS, LB, UB) of an atoll track or the NB/FB part of a Z track; the location of the vertex between the two branches was seen to approximately follow a straight line in the CD. They also found that the source showed peculiar CD/HID and rapid-variability behavior compared to most other Z or atoll sources, but overall they favored an atoll classification. Homan et al. (2004) analyzed two simultaneous RXTE/radio observations of GX 13+1 performed in 1999. Based on the results of spectral fits, rapid-variability properties, behavior in the radio band, and the scarcity of type I X-ray bursts observed from the source since its discovery, they concluded that the properties of GX 13+1 were more similar to Z sources than atolls.
3.4.1. Analysis
In our analysis we considered all 92 individual ObsIDs for pointed observations of GX 13+1. These span a period of ∼14 years. In Figure11 we show a CD/HID based on all the GX 13+1 data; strong secular motion is apparent. However, we note that GX 13+1 overall shows the smallest range in secular evolution among the four sources studied here (e.g., as quantified by the range in soft or hard color over which the lower vertex is observed), and the other three sources show secular motion on shorter timescales than does GX 13+1. As for Cyg X-2 and Cir X-1 we organized the data into subsets; this resulted in∼50 such sets, which could in a few cases span intervals as long as several days with little or no visible secular motion. We constructed a sequence of six CD/HID tracks (shown in Figure12), which illustrates the secular evolution of the source. Similar to our analysis of Cyg X-2, we combined subsets widely separated in time in three of these tracks to create more complete tracks than otherwise available and thereby give a fuller depiction of the overall secular behavior of the source. For these three tracks we also indicate in red a representative subset obtained in a short time interval. The number of individual subsets used for each track ranges from 1 to 4; these are listed in Table 5 along with the corresponding ObsIDs. Similar to our Cyg X-2 and Cir X-1 analysis, we order the tracks based on the location of the lower vertex in the CD, starting at the lowest soft and hard color.(See discussion of this vertex in the following paragraph.) The data used in the six tracks together constitute ∼42% of the total exposure time of the GX 13+1 data set. We note that in a few of the subsets used we do see indications of small secular shifts—especially in panels B and F in Figure12. These shifts are apparent mostly in the HID(and SID), rather than the CD. However, the overall conclusions we draw from these tracks and the sequence as a whole are not affected by this.
As can be seen from Figure12the tracks in the CD mostly have a two-branched form. The vertex between these branches follows rather closely a straight line (as observed by Schnerr et al. 2003), which we show in the figure. We classify GX 13+1 as a Z source based on its overall secular evolution in the CD/HID, the timescales on which it traces out its CD/HID tracks, and its rapid-variability properties. (We discuss this further in Section4.6.) We identify the vertex in the CD as the lower Z track vertex and the branches to the left/right of the vertex line in the CD as the normal/flaring branch. In addition, the tracks in panels D and E include subsets that we identify as the HB (plus upturn). In the CD these segments look very similar to excursions onto the HB
and HB upturn in the Cyg-like Z tracks of XTE J1701–462, Cyg X-2, and Cir X-1. In the HID these segments also stand out and are located above and to the left of the rest of the track. We note that there is considerable ambiguity regarding where within panels C–E to place these presumed HB segments. What we show in Figure 12 is therefore our best guess but only one of a few possible ways of incorporating them into the sequence. What does seem clear from inspection of the entire GX 13+1 data set is that these segments cannot plausibly be combined with other track segments—or accommodated in our sequence—as NB segments similar to the other ones we see.(We discuss these tracks further in Section4.)
The tracks in the HID look quite different from those of the other three sources. As we discuss below, different track branches can be identified in the HIDs; however, the fact that these branches are in general very broad and rather irregularly shaped makes them less useful for judging in what cases observations can be appropriately combined to form CD/HID tracks without significant secular shifts. The SID—although also displaying broad and somewhat irregular track branches— turned out to be more useful in this respect. To better illustrate the behavior of the source in the HID we show in Figure13a color-coded version of the track in panel C. The locations of the NB/FB vertex in the HID are in general less well defined than in the CD and they do not seem to follow a straight line.
3.4.2. Secular Evolution
GX 13+1 shows behavior that is in some ways quite different from that of the other three sources, especially in the HID. A more detailed description of the secular evolution of this source is therefore warranted. We note at the outset that, as Figure11 indicates, the largest portion of the total exposure time for the source was spent on tracks near the middle of the sequence in Figure12(especially panel D), and it is therefore natural that the tracks in these panels would be the most complete ones. Conversely, the amount of data available at the lowest(panels A and B) and highest (panel F) vertex locations (all of which and is shown in Figure12) is very small. These tracks therefore seem most likely to suffer from incompleteness.
Wefirst focus on the evolution of the tracks in the CD. As the tracks move up the vertex line the FB gradually rotates counterclockwise and becomes longer and straighter (more Sco-like). Starting at the other end of the sequence, the NB gradually becomes longer as the tracks move down the vertex line from panel F to D. The NB seems to shorten again going from panel C to A, although we suspect that this may be due to
Figure 11. CD and HID representing the entire RXTE PCA data set of GX 13+1.
incompleteness in panels A, B, and possibly C. These three tracks may also be missing HB and HB upturn portions.
The evolution in the HID is less obvious. At the lower vertex locations the NB is strongly tilted to the right and for a given hard-color value spans a large intensity range, especially in its upper part. The NB gradually becomes more compact going to higher vertex locations(although it is always broad compared to the NBs observed in the other three sources). The behavior
of the FB in the HID is even harder to discern than that of the NB. The morphology of the FB in panel C can more easily be seen in the color-coded version in Figure 13. The upward-pointing part of the FB is essentially vertical(but very short) in panel C, and is at the lowest intensities. Going counter-clockwise along this track in the CD, the highest intensities are near the top of the NB and then the intensity becomes gradually lower moving along the track until the FB reaches its lowest
Figure 12. Sequence of CDs/HIDs for GX 13+1 illustrating the secular evolution of the source. Table5indicates the data used in each panel. In panels C, D, and E data from observations widely separated in time were combined; in each of these three panels a subset of the data—obtained over a period of at most ∼1.8 days—is shown in red. The dashed line in the CDs shows the approximate path followed by the NB/FB vertex.
Table 5
Time Intervals and Observations Used for GX 13+1 Tracks
Interval Length Exp. Time Panel Time Interval(MJD) days(hr)a ObsIDs ks(hr)b
A 51278.745–51278.971 0.23(5.4) 40023-03-02-03 10.3(2.9) B 51276.746–51278.117 1.37(32.9) 40023-03-[01-00,01-02,02-(00:02),02-04] 26.0(7.2) C 50990.407–50990.711 0.30(7.3) 30051-01-09-[00:01] 9.8(2.7) 53767.006–53767.601 (R) 0.60(14.3) 91007-08-02-[00,000] 29.5(8.2) D 50981.074–50982.844 (R) 1.77(42.5) 30050-01-01-[04:08,050,080] 54.4(15.1) 50984.407–50984.576 0.17(4.1) 30050-01-02-03 8.1(2.3) 51390.995–51394.488 3.49(83.8) 40022-01-[01-(00:01),02-00,02-000] 39.0(10.8) 51447.322–51447.428 0.11(2.5) 40023-03-04-00 6.8(1.9) E 51007.409–51007.560 0.15(3.6) 30051-01-12-01 8.0(2.2) 53409.846–53409.949 (R) 0.10(2.5) 90173-01-01-00 6.1(1.7) 54740.627–54743.339 2.71(65.1) 93046-08-[02-00,03-(00:01)] 7.8(2.2) 55409.062–55413.805 4.74(113.8) 95338-01-[01-(00:07),03-00,03-05] 24.3(6.8) F 50997.607–51003.646 6.04(144.9) 30051-01-[11-(00:03),12-00] 17.5(4.8) Notes.Subsets colored in red in Figure12are denoted by(R) in the Time Interval column. In the ObsIDs column a colon denotes a range.
a
The interval length is shown in units of both days and hours.
b
point (in hard color), after which the intensity becomes approximately constant. (The same behavior is seen in panel B.) In panels D and E, the flat part of the FB in the CD forms a broad patch at the bottom of the track in the HID. The rising part of the FB extends from the left side of this patch, tilted slightly to the right from vertical, and overlaps with the broad NB(see, e.g., the red-colored data in panel E).
3.4.3. Comparison with XTE J1701–462, Cyg X-2, and Cir X-1
The tracks in the CD of GX 13+1 show many similarities to those of XTE J1701–462, Cyg X-2, and Cir X-1. The evolution of the FB in the CD is similar to that seen for XTE J1701–462 in selections A–H—with the FB rotating counterclockwise and growing longer (and more Sco-like)—and likewise similar to that of Cir X-1. There are strong similarities between the shape of the FB of GX 13+1 in panels D–F and, e.g., the FB of XTE J1701–462 in selections E–H, Cyg X-2 in panel J, and Cir X-1 in panels H and I. As in the other three sources, a lower vertex in the CD of GX 13+1 moves along a straight line with positive slope. The NB is also similar to the ones of the other three sources (being mostly straight and oriented up and to the right), and the possible HB and HB upturn segments in GX 13+1 have a similar appearance to those of the other sources as well.
Although less obvious at first sight, there are also similarities in the HID between GX 13+1 and the other three sources. The NB is oriented up and to the right, becoming gradually shorter and closer to vertical as the tracks move up in hard color—i.e., the intensity swings along the NB become smaller—and at the same time the maximum intensity observed on the NB gradually decreases (although for this to extend to panels A and B we need to assume they have incomplete NBs). This is also the case for the other three sources. What we interpret as traversals onto the HB and HB upturn in GX 13+1 are manifested as movement toward lower intensities and higher hard color; this is in general the case for Z sources, including the other three discussed in this paper. In the earlier panels in the GX 13+1 sequence the initial part of the FB is toward lower intensities(i.e., dipping FB behavior), as is seen in the other three sources. The GX 13+1 FB rotates slightly clockwise in the HID (similar to Cyg X-2) as the source moves up the vertex line in the CD, evolving into an FB that shows an intensity increase rather than decrease. A notable difference between GX 13+1 and the other three sources is the movement of the lower vertex in the HID. The
location of the lower vertex in the HID of GX 13+1 is in general rather poorly defined, and does not seem to follow a straight line. However, it seems clear that the lower vertices in panels A and B in Figure 12 are at a significantly lower intensity (∼550–600 counts s−1 PCU−1) than the ones in panels C–F (∼800–900 counts s−1PCU−1), in contrast to the
other three sources, where in general the intensity at the lower vertex decreases as it moves up the vertex line in the CD.
As is clear from the above GX 13+1 shows similarities to both Cyg-like and Sco-like Z sources. Overall, the earlier panels in the track sequence are more Cyg-like and the later ones more Sco-like, although the distinction between the two is less clear than for the other three sources.
4. DISCUSSION 4.1. Secular Evolution
The main goal of this paper is to study secular evolution in the CDs and HIDs of NS-LMXBs, using three sources historically known to show substantial changes in the shape and location of their CD/HID tracks: Cyg X-2, Cir X-1, and GX 13+1. In particular, we want to determine to what extent the secular evolution of these three sources is similar to that seen in XTE J1701–462, the first source found to evolve through all NS-LMXB subclasses.
In Figure14we provide an overview of the secular evolution of the CD/HID tracks of XTE J1701–462, Cyg X-2, Cir X-1, and GX 13+1. In each of the four panels we show all tracks from the sequences in Figures 2, 5, 9, and 12 in a single CD/HID.(For XTE J1701–462 we show only the red-colored subsets from Figure 2, where applicable.) Strong secular evolution is found in all four sources, consistent with reports in the literature. While for XTE J1701–462 all data come from the dense monitoring of a single 19 month outburst, the data for the other three sources were collected sporadically over a time span of ∼14–15 years. As a result, the secular evolution in these sources could not be followed in“real time,” as was possible for XTE J1701–462, but had to be reconstructed from multiple isolated(partial) tracks. To some extent this limited our ability to compare the secular evolution between sources, in particular for GX 13+1. Despite these issues, it is obvious from Figure14 that the secular evolution of the four sources has many common characteristics.
In the following we summarize our keyfindings, focusing on the similarities between the systems.
1. As part of their secular evolution, we see clear and continuous transitions between different NS-LMXB sub-classes in all four sources. While some of the behavior we report has been described in previous works, our work for thefirst time unambigously links strong secular evolution to transitions between various NS-LMXB subclasses in Cyg X-2, Cir X-1, and GX 13+1. Of the four sources XTE J1701–462 and Cir X-1 have shown the largest range in behavior; they have displayed Cyg-like and Sco-like Z tracks, atoll soft and hard states, and have both at some point entered quiescence or near-quiescence( 10∼ 35erg s−1
in the case of Cir X-1; Sell et al. 2010). Cyg X-2 and GX 13+1 have only shown Cyg-like and Sco-like Z tracks, with the secular changes in GX 13+1 being the most moderate of the four sources.
2. Cyg-like Z source behavior (with large variations in intensity along the NB and HB, and a“dipping” FB that
Figure 13. Color-coded version of the track in panel C in Figure12, illustrating the portions of the HID track corresponding to several segments along the track in the CD.
Figure 14. CDs/HIDs illustrating the overall secular evolution of XTE J1701–462, Cyg X-2, Cir X-1, and GX 13+1. In the panels we show (from top to bottom) all the tracks from Figures2,5,9, and12, respectively. Different colors are used to distinguish between the individual tracks in each panel.