HAL Id: hal-01812222
https://hal-univ-rennes1.archives-ouvertes.fr/hal-01812222
Submitted on 3 Jun 2021
HAL is a multi-disciplinary open access archive for the deposit and dissemination of sci-entific research documents, whether they are pub-lished or not. The documents may come from teaching and research institutions in France or abroad, or from public or private research centers.
L’archive ouverte pluridisciplinaire HAL, est destinée au dépôt et à la diffusion de documents scientifiques de niveau recherche, publiés ou non, émanant des établissements d’enseignement et de recherche français ou étrangers, des laboratoires publics ou privés.
Estimation of myocardial work from pressure-strain
loops analysis an experimental evaluation
Arnaud Hubert, Virginie Le Rolle, Christophe Leclercq, Elena Galli, Eigil
Samset, Cyrille Casset, Philippe Mabo, Alfredo Hernandez, Erwan Donal
To cite this version:
Arnaud Hubert, Virginie Le Rolle, Christophe Leclercq, Elena Galli, Eigil Samset, et al.. Estimation of myocardial work from pressure-strain loops analysis an experimental evaluation. European Heart Journal - Cardiovascular Imaging, Oxford UP, 2018, 19 (12), pp.1372-1379. �10.1093/ehjci/jey024�. �hal-01812222�
Estimation of myocardial work from pressure-strain loops analysis: an
experimental evaluation
Arnaud Hubert, M.D.1,2,3; Virginie Le Rolle, PhD. 2,3; Christophe Leclercq, M.D., PhD. 1,2,3;
Elena Galli, M.D., PhD. 1,2,3; Eigil SAMSET, PhD. 4;Cyrille CASSET, Eng.5; Philippe Mabo,
M.D. 1,2,3; Alfredo Hernandez, PhD. 2,3;Erwan Donal, M.D., PhD. 1,2,3
1 CHU Rennes, Service de Cardiologie et Maladies Vasculaires et CIC-IT 1414, Rennes, 35000, France
2 Université de Rennes 1, LTSI, Rennes, 35000, France 3 INSERM, U1099, Rennes, 35000, France
4 University of Oslo, Oslo – Norway
Corresponding Author:
Prof. Erwan Donal 2 Rue Henri Le Guilloux CHU Pontchaillou
35000 Rennes - FRANCE Tel: +33 2 99 28 25 07 Fax: +33 2 99 28 25 29
Abstract:
Purpose: The area of left ventricular (LV) pressure–strain loop (PSL) is used as an index of
regional myocardial work. The purpose of the present work is to compare the main segmental PSL markers and the derived global work indices, when they are calculated using an estimated pressure signal or an observed pressure signal.
Methods and results: In nine patients implanted with a bi-ventricular pace-maker (CRT), LV
pressure was invasively measured in five conditions: CRT-off, LV-pacing, right ventricular-pacing and two different CRT-ventricular-pacing. For each condition, systolic blood pressure was measured by brachial artery cuff-pressure and transthoracic echocardiography loops were recorded simultaneously. The error and relative root mean square error (rRMSE) between measured and estimated pressure were calculated for each patient and each configuration. Correlation coefficient (R2) and Bland–Altman (BA) analysis were performed for PSL area and
work indices. A total of 43 different haemodynamic conditions were compared (774 segmental PSL). The global rRMSE between estimated and measured LV-pressure was 12.3mmHg. The estimated and measured segmental LV-PSL were strongly correlated, with an R2 of 0.98. BA
analysis shows that the mean bias for the estimation of segmental LV-PSL area is 86.0mmHg.%. A significant bias effect with linearly increasing error with pressure values is observed. R2 ≥ 0.88 and a mean bias in BA analysis ≤ 41.4mmHg.% was observed for the
estimation of global myocardial work indices.
Conclusion: The non-invasive estimation for LV pressure–strain loop area and the global
myocardial work indices obtained from LV-PSL strongly correlates with invasive measurements.
INTRODUCTION
The evaluation of left ventricular (LV) function is challenging in cardiac imaging, particularly in echocardiography.1 This difficulty is mainly due to the lack of consideration for load conditions. Russell et al.,2–5 developed a new tool, based on LV pressure–strain loops (LV-PSL), to assess myocardial work, which explore LV function, balanced by afterload with an estimation of intraventricular pressure during a cardiac cycle. The originality of their study was to create a non-invasive estimation of LV pressure during a cardiac cycle allowing for analysis of LV-PSL. They interestingly demonstrate a strong correlation of LV-PSL area with cardiac metabolism, assessed by fluorine 18 fluorodeoxyglucose-positron emission tomography. Preliminary results about LV function in ischaemic cardiomyopathy4 and in cardiac resynchronization therapy6 (CRT) are encouraging. Two distinct methods were used to calculate cardiac work: pressure–strain loop area5 and segmental work.7 These two methods have same units (mmHg.%) and provide similar results because they both reflect a surrogate estimation of the power over the cardiac cycle, when the force cannot be measured. Indices of global and segmental cardiac work, calculated from LV-PSL, may thus provide a new opportunity to better predict CRT-response.8 However, the accuracy of this new tool, in different haemodynamic conditions, has not been verified. In this work, we analyse LV-PSL acquired from patients implanted with a CRT system, while studying different CRT stimulation
configurations, in order to induce reproducible and significant modifications of their cardiac electro-mechanical activity.
The purpose of the present work is to compare the main segmental PSL markers and the derived global work indices, when they are calculated using an estimated pressure signal or an observed pressure signal.
METHOD
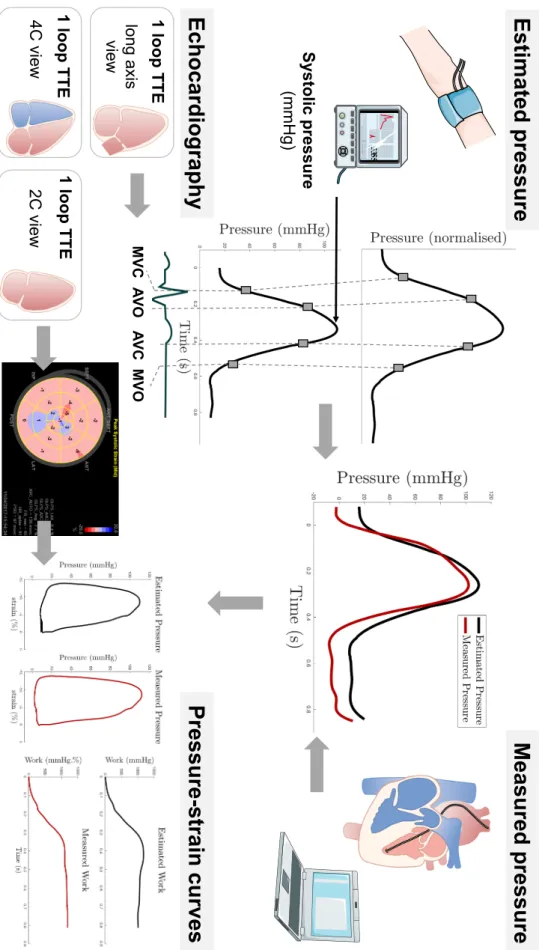
The first step was to obtain synchronous representations of the measured and estimated left-ventricular pressure curves (figure 1).
1- Data acquisition and calculation
1.1. Population and CRT configuration
In this work we included 12 patients ³ 18 years old recently (< 1 month) implanted with a CRT in accordance to current international recommendations. In order to induce different hemodynamic conditions, 5 CRT configurations were tested for each patient: CRT off, right ventricular (RV) pacing alone, LV pacing alone and two different biventricular (BIV) pacing: “standard BIV pacing” (BIV1) and “BIV with multipoint pacing” (BIV2). Patients with atrial fibrillation (AF), significant aortic stenosis or aortic prosthesis or absence of femoral and radial artery access were excluded. Patient echogenicity in supine position had to be satisfying. The study was approved by local ethic committee (validation number: 35RC14-9767). Patients were included from January 2016 to October 2017 with 9 patients (2 excluded for an absence of invasive pressure, 1 excluded due to significant artifacts on the invasive pressure signal) finally analyzed (61 ± 5 years, 4 males) for a total of 43 different hemodynamic profiles (2 patients had only 4 CRT configurations with satisfying TTE loops), 774 segmental PSL analyzed.
1.2. Invasive pressure measurement
The left heart catheterization (LHC) was performed via a retrograde access from the femoral artery with a PressureWire CertusVR catheter (Abbott, St Paul, Mi, USA) which permit pressure measures from -30 to fl300mmHg with an error ±1mmHg. It was linked with a RadiAnalyzer XpressVR (Abbott, St Paul, MI, USA). Pressure waves were recorded on a dedicated workstation for offline analysis. Pressures data were saved in an Excel file. During a procedure, five different CRT configurations were tested, as previously described. For each configuration, pressure data were acquired, at the same time as TTE.
1.3. Calculation of estimated left ventricular pressure curve
A complete TTE, with a frame rate> 60frames/s, was acquired with simultaneous invasive pressure recording. As previously described by Russel et al., the analysis of aortic and mitral valve events during a loop [mitral valve closure (MVC), aortic valve opening (AVO), aortic valve closure (AVC), mitral valve opening (MVO)] was performed in an APLAX view. As suggested by Russel et al.5,7,9; valvular timings obtained from TTE are used to estimate a normalized, patient specific LV pressure curve. The instantaneous systolic pressure value estimated by a brachial artery cuff was then used to scale the normalized pressure signal. This analysis was realized using an echocardiography work station (EchoPAC version 202, General Electric Healthcare, Horton, Norway). Data of the curve were exported to an ExcelVR file (Office Suite, Microsoft Corp., Redmond,WA, USA).
1.4. 2D-speckle tracking echocardiography
TTE recordings were processed using an acoustic-tracking dedicated software (EchoPAC) which allowed for an off-line analysis of speckle-based strain. To calculate the LV global and segmental longitudinal strain (GLS), a line was traced along the LV endocardium’s inner border in each of the three apical views (in the same loop than estimated curve) on an end-systolic
frame, and a region of interest was automatically defined between the endocardial and epicardial borders with GLS then automatically calculated from the strain in three apical views. All strain data (mean values, curves) were exported in Excel® file.
2. Data analysis
All data were processed using custom-made functions created with Octave ® (GNU Octave, version 4.2.1). Only loops in sinus rhythm in TTE were analyzed. Concerning invasive pressure, data were saved in about 10 successive cycles.Only cycles with correlation >0.99 were selected in order to avoid the effect of premature beats and the mean pressure from all selected cycles was calculated. Both the estimated and the measured pressure signals were extracted at a sampling rate of 250 Hz and were then resampled at 1000 Hz. Both signals were then synchronized to the maximum value of systolic pressure (Figure 2). Signals were oversampled to 1 kHz, using spline interpolation, in order to: (i) harmonize sampling frequencies and (ii) facilitate all processing steps (differentiation, comparison with valve timing, . . .) by manipulating a time vector expressed in millisecond.
2.1.Calculation of segmental work. (Figure 3)
Segmental myocardial work was calculated from strain and from measured and estimated LV pressure, as proposed by Russell et al.7 The instantaneous power was first obtained by multiplying the strain rate, obtained by differentiating the strain curve, and the instantaneous LV pressure. Then, segmental myocardial work was calculated by integrating the power over time, during the cardiac cycle from mitral valve closure until mitral valve opening (Figure 3).
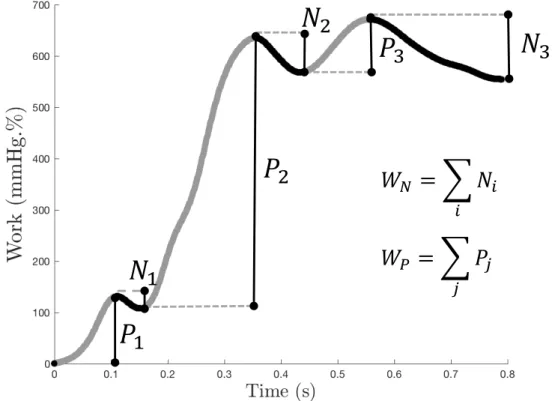
Myocardial work was then used to evaluate positive (Wp) and negative (Wn) segmental work. Positive and negative works were first determined as the ascending and descending parts
of the curves. Then, positive segmental work Wp (respectivelyWn) is finally defined as the sum of positive (respectively negative) variations for each segment:
𝑊$ = ∑ 𝑃( (, 𝑊) = ∑ 𝑁+ +,
where Pi (resp. Nj) is the variation associated with each ascending (resp. descending) parts i
(resp. j) of the segmental work (Figure 3). The indices i (resp. j) are comprised between 1 and the total number of ascending (resp. descending) parts. Finally, global (GW), positive (GWp)
and negative (GWn) work indices are defined as mean values over all segments:
𝐺𝑊$ = .-∑. 𝑊$,0
01- , 𝐺𝑊) = .-∑.01-𝑊),0, 𝐺𝑊 =23234
5
where N is the total number of segments. Positive work represents segmental shortening during the systole, i.e. effective energy for blood ejection. Negative work represents segmental lengthening during the systole, i.e energy loss for blood ejection. Figure 3 shows positive (grey) and negative (black) parts of segmental works during systole for a septal wall segment before CRT in a representative patient.
2.2. Pressure-strain loop area
Pressure-strain loops were determined for each segmental strain using both measured and estimated pressures. The area of each loop was calculated using rectangle method, considering small increments of ventricular pressure in order to insure a precise determination. The same method was used for the calculation of the loop area for measured and estimated pressures.
3. Evaluation of differences between estimated and measured data
3.1.Comparison of pressure waveforms
To compare pressure curves, the error is first calculated as the mean difference between measured and estimated pressures expressed as a percentage of the measured pressure:
𝐸% = 100 × 1 𝑁; < 𝑃=>?0@A>B(𝑘) − 𝑃>0G(=?G>B(𝑘) 𝑃=>?0@A>B(𝑘) < .
H1-where Pmeasured(k) and Pestimated(k) are respectively the measured and estimated pressures at the
sample k. Root mean square error (RMSE) is then evaluated as:
𝑅𝑀𝑆𝐸 = L1
𝑁;(𝑃=>?0@A>B(𝑘) − 𝑃>0G(=?G>B(𝑘))M
.
H1-Both errors and RMSE were calculated for the total cardiac cycle and for intervals between each valve events.
3.2.Comparison of myocardial work and pressure-strain loop area
Work indices (positive, negative, and global work) were evaluated for each patient and each configuration. Furthermore, segmental pressure–strain loop areas were calculated for each segment. All these invasive and measured indices were compared using linear regression method7 and Bland–Altman (BA) analysis.10,11 Linear regression is a linear approach for modelling the relationship between an index variable and another independent variable, using linear predictor functions to model relationships. It gives the intraclass correlation coefficient. BA analysis consists in a method of data plotting to assess a good agreement between two variables. Average value of the two variables is in x-axis and difference between the variables in y-axis. The mean difference with his double of standard deviation is used as limits to assess visually the good agreement.
4. Statistical analysis
Continuous data are presented as the mean ± standard deviation, and categorical data are presented as a number.
Results
Comparison of pressure waveforms
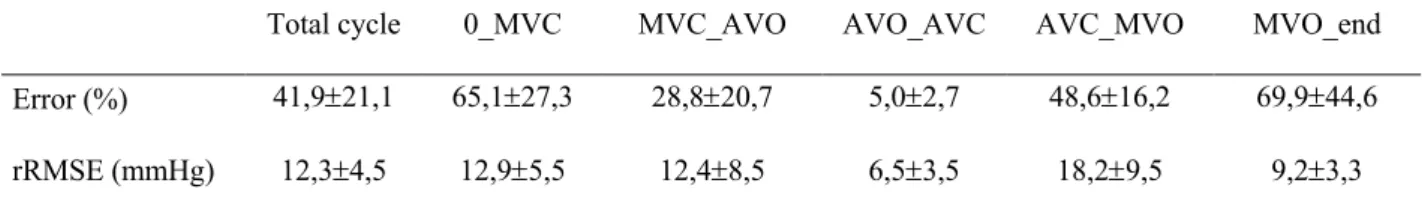
The error and the RMSE for invasive and measured LV pressure on an whole cycle were equal to 41.9 ±21.1% and 12.3±4.5 mmHg. Maximal error was found between AVC and MVC because the reference measured pressure is low, while the RMSE remains stable between 9,2±3,3 mmHg and 18,2±9,5 mmHg. As illustrated in figure 2, minimal error was evaluated around the systolic pic, between AVO and AVC, with an error of 5.0±2.7% for a RMSE of 6.5±3.5mmHg (Figure 2, Table 1).
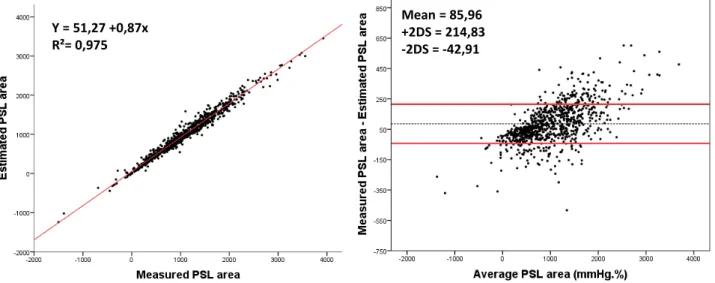
Comparison of segmental pressure-strain loops area
The global intraclass coefficient (ICC) was equal to 0.975 (p<0.0001). On Bland-Altman (BA) analysis, mean bias of segmental PSL area was 86mmHg.% (-42.9 to 214.8mmHg.%) (figure 2). Of note, bias increased with the size of PSL. In fact, majority of plot outside the interval -2DS to +-2DS are for LV-PSL greater than 1000. Visually proportion of plots outside versus inside increased with the size of PSL (Figure 4).
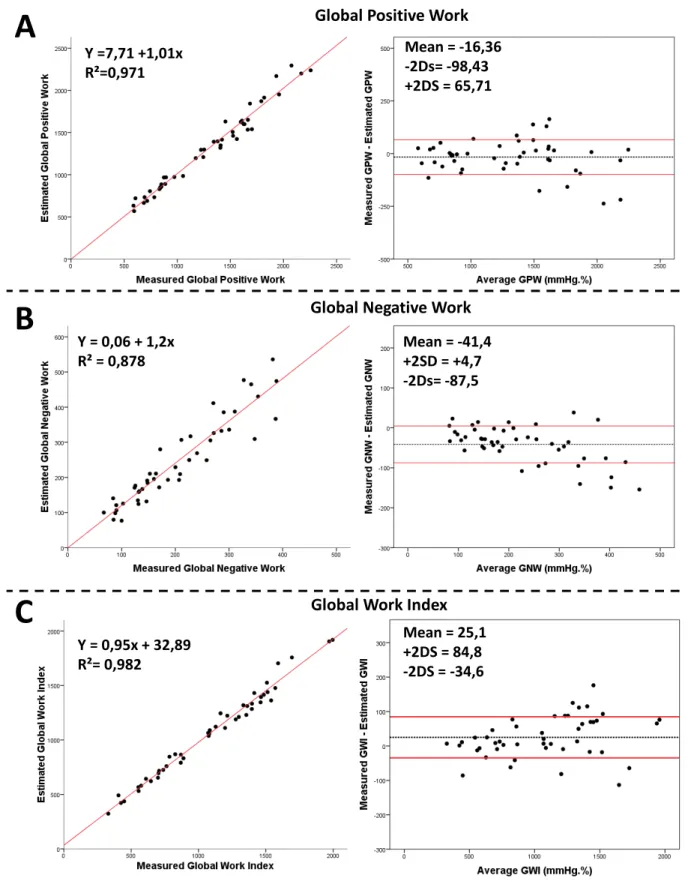
Comparison of global cardiac work indices (Figure 5)
For global work index, correlation between measures and estimations was 0.982 (p<0.0001). In BA analysis, mean bias was 25.1mmHg.% (-34.6 to 84.8mmHg.%). For global positive work, correlation between measures and estimations was 0.971 (p<0.0001). In BA analysis, mean bias was -16.4mmHg.% (-98.4 to 65.7mmHg.%). For global negative work, correlation
between measures and estimations was 0.878 (p<0.0001). In BA analysis, mean bias was -41.4 mmHg.%(-87.5 to 4.7mmHg.%) (Figure 5).
Variations between CRT configurations
There is no statistical difference in the accuracy of the estimated pressure between the 5 different CRT configurations with a total error between 40.2 and 50.6%, total RMSE between 11.5 and 13.3 mmHg. For global positive work and global work index, ICC between measured and estimated indices are all superior to 0.99. Only two configurations (LV pacing alone and BIV pacing 2) were found to be associated with a mean bias >100 mmHg.%:. These two configurations had also the lower ICC between estimated and measured global negative work (0.893 and 0.886, respectively) (Table 2).
Discussion
The main findings of this study were (i) the estimation of pressure curve and therefore of PSL area by the algorithm developed by Russel et al.2,4 is imperfect with an increased bias for greater area and (ii) Although this estimation is imperfect, consequences on global work indices are limited with good correlations between estimated and measured work, regardless of CRT configuration.
An imprecise pressure prediction…
The mean value for all patient of RMSE was found equal to 12.3mmHg for the estimated pressure wave curve. Differences were observed between maximum systolic values of measured and estimated pressures. This observation points to a flaw of this method: the arterial systolic pressure measure by a brachial cuff is imprecise and this imprecision grows when the arterial pressure is high. On top of it, arterial pressure could be false if the patient has brachial vascular disease.
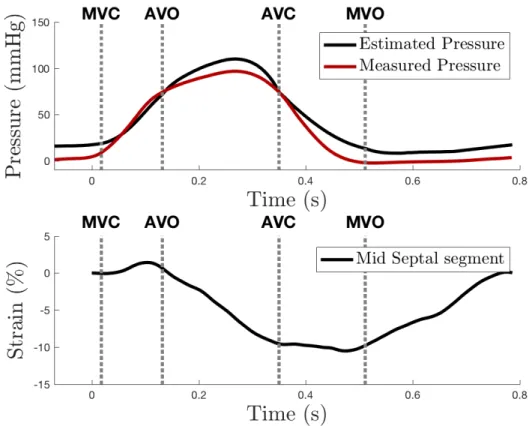
But the accuracy of the estimated curve is not equal along the cardiac cycle. In fact, the precision of the estimation of the pressure between AVO and AVC is quite excellent, with a RMSE of only 6.5mmHg. On the contrary, when we observe the pressure estimation away from the peak, its precision is worse and especially before MVC and after MVO (in diastole). However, although the error increases, the RMSE is stable. Indeed, pressure level is very low before MVC and after MVO so the absolute error, in mmHg is quite low. A possible explanation is that aortic exact timings are quite easy to determine visually in APLAX view so errors in this interval are low whereas the mitral valve had a visually lower kinetic so the determination of the exact timing of mitral opening and closure is more difficult. Another reason is the method of synchronization of pressure used. In fact, estimated and measured pressure curve were synchronized on the time of systolic peak, which was physiologically between AVO and AVC. The observed difference in magnitude of systolic pressure measured by blood pressure cuff and pressure catheter is not surprising since arterial peak pressure is augmented when the arterial waves travel towards the periphery. The method of Russell et al.5 does not provide a means to estimate LV diastolic pressure, and the marked difference between estimated and measured pressures during diastole reflects this limitation.
… for a precise work estimation
While our results about myocardial work are consistent with the study of Russel et al.2,4, a significant bias in BA analysis of PSL area estimation was found. It reveals a paradox: although the estimation of LV-pressure is imprecise, the deducted estimation of LV- work is accurate. The major reason is that the temporal integration induces a smoothing of the difference between measured and estimated works. Another reason is the relative precision of the estimation of the pressure between AVO and AVC (Table 2). This moment of the cardiac cycle is (i) the period when the pressure is maximal and (ii) the period when the LV strain is
maximal (Figure 2). As myocardial work value resulted in pressure and strain, his value provides from this interval (i.e. AVC–AVO), when the estimation of the pressure is the best.
This questions on the added value of LVP estimation on top of strain curves. In fact, other indices, based only on strain curves analysis,12 were developed to explore myocardial work, in particular for patients with mechanical dyssynchrony.13–15
Influence of CRT configuration
We didn’t really find any significant difference between the different hemodynamic conditions but there were two configurations with a lower accuracy of estimated PSL area and work: LV pacing and multipoint BIV pacing. These two configurations had the best strain (and probably the best synchronization of deformation of all the LVsegments) but with the same accuracy of the estimated wave curve than others. As PSL and work resulted in the multiplication of LV pressure and strain, a great strain increases the effect of the error in the pressure curve estimation. In the present study, we focused on the comparison the main segmental PSL markers and the derived global work indices, when they are calculated using an estimated pressure signal or an observed pressure signal, we did not have the power to look at the clinical value associated with all the measurement that have been done. It is the next step. The correlation being clinically relevant, it ismeaningful to consider the next step: a clinically driven study based on the optimization of the pacing modality using the iteration of the cardiac work indices.16–19
Because of the consistency between measured and estimated works over CRT configurations, global indices appear as a robust surrogate estimation for myocardial work. Of note, it has been demonstrated that despite few methodological imperfections, the estimation of myocardial work indices looks like to be extremely promising tools for estimating the response
to CRT.6,8 If septal flash and apical rocking are very probably a first step simple way to lookfor mechanical dyssynchrony, the patterns of septal strain and the myocardial work indices looks promising enough to encourage new large multicentre studies trying to rehabilitate the imaging approach in the field of CRT (selection and optimization of patients).1,8,12,20,21 For the clinical practice, one can assume that the visual assessment of rocking/septal flash could provide a good idea about the patients that could be suitable for CRT, but myocardial work analysis provides a way to quantify the wasted work in the septum this is expressed as apical rocking. It is a quite automatic measurement suitable for any machine learning approach and it could be use even by non-experts.
Limits
The number of patients included was limited but we explored 4 or 5 really different haemodynamic conditions for each patient, which permit to increase the number of situations observed.
We cannot exclude a discrete difference in the haemodynamic reflected by the invasive pressure extracted from the RadiAnalyzer and the haemodynamic of the cycle used using TTE for the estimation of the LV pressure. To limit this bias, we used a mathematical process for the invasive pressure analysis (cycle selected only if they had correlation of 0.99), and only cycles in stable sinus rhythm were analysed in TTE. It is also important to keep in mind that the approach tested here is considering myocardial work in the period from mitral valve closure to mitral valve opening, so inaccuracies before mitral valve closure and after mitral valve opening has no impact on the results. The estimates of diastolic pressure are not accurate, which is why no attempt is made to try to estimate (or use) the values in diastole.
Further works are required to quantify the influence of pressure morphology on segmental work and loop area. In addition, the proposed work indicators could be compared to integral-based
markers of regional mechanical activity such as in Bernard et al.,22 since the later markers do not rely on the estimation of a pressure waveform.
Conclusion
Although the estimation of the LV pressure is imperfect, the deducted estimation of LV myocardial work is accurate, which confirms previous studies. The added value of LV pressure estimation on top of strain curves, in regard of these results, could be debated but further works and prognostic data vs. simple strain information will have to be collected.
Acknowledgments
To the researches Nurses CIC-IT 1414: Valerie Le Moal and Brigitte Lelièvre, to the nurses in the cath lab of the Cardiology Department, to Christian Serot, (Abbott) for his assistance in organizing the study. The authors acknowledge financial support from the French National Research Agency (ANR) and the grant got from General Electric Healthcare.
Funding
French National Research Agency (ANR) (ANR-16-CE19-0008-01) (project MAESTRo); and the grant got from General Electric Healthcare.
Conflict of interest:
E.D. received a research grant from General
Electric Healthcare. E.S. is employed by General Electric Healthcare. C.C. is a research engineer employed by Abbott (Sylmar, CA, USA).
References
1. Galli E, Leclercq C, Donal E. Mechanical dyssynchrony in heart failure: still a valid concept for optimizing treatment? Arch Cardiovasc Dis 2017;110:60–8.
2. Russell K, Opdahl A, Remme EW, Gjesdal O, Skulstad H, Kongsgaard E et al. Evaluation of left ventricular dyssynchrony by onset of active myocardial force
generation: a novel method that differentiates between electrical and mechanical etiologies. Circ Cardiovasc Imaging 2010;3:405–14.
3. Gjesdal O, Remme EW, Opdahl A, Skulstad H, Russell K, Kongsgaard E et al. Mechanisms of abnormal systolic motion of the interventricular septum during left bundle-branch block. Circ Cardiovasc Imaging 2011;4:264–73. 4. Russell K, Smiseth OA, Gjesdal O, Qvigstad E, Norseng PA, Sjaastad I et al. Mechanism of prolonged electromechanical delay in late activated myocardium during left bundle branch block. Am J Physiol Heart Circ Physiol 2011;301:H2334–43.
5. Russell K, Eriksen M, Aaberge L, Wilhelmsen N, Skulstad H, Remme EW et al. A novel clinical method for quantification of regional left ventricular pressure-strain loop area: a non-invasive index of myocardial work. Eur Heart J 2012;33:724–33.
6. Vecera J, Penicka M, Eriksen M, Russell K, Bartunek J, Vanderheyden M et al. Wasted septal work in left ventricular dyssynchrony: a novel principle to predict response to cardiac resynchronization therapy. Eur Heart J Cardiovasc Imaging 2016;17:624–32.
7. Russell K, Eriksen M, Aaberge L, Wilhelmsen N, Skulstad H, Gjesdal O et al. Assessment of wasted myocardial work: a novel method to quantify energy loss
due to uncoordinated left ventricular contractions. Am J Physiol Heart Circ Physiol 2013;305:H996–1003. 8. Galli E, Leclercq C, Hubert A, Bernard A, Smiseth OA, Mabo P et al. Role of myocardial constructive work in the identification of responders to CRT. Eur
Heart J Cardiovasc Imaging 2017 Aug 7 [Epub ahead of print], doi:10.1093/ehjci/jex191.
9. Boe E, Russell K, Eek C, Eriksen M, Remme EW, Smiseth OA et al. Non-invasive myocardial work index identifies acute coronary occlusion in patients with non-ST-segment elevation-acute coronary syndrome. Eur Heart J Cardiovasc Imaging 2015;16:1247–55.
10. Bland JM, Altman DG. Statistical methods for assessing agreement between two methods of clinical measurement. Lancet 1986;327:307–10.
11. Bland JM, Altman DG. Comparing methods of measurement: why plotting difference against standard method is misleading. Lancet 1995;346:1085–7.
12. Menet A, Bernard A, Tribouilloy C, Leclercq C, Gevaert C, Guyomar Y et al. Clinical significance of septal deformation patterns in heart failure patients receiving cardiac resynchronization therapy. Eur Heart J Cardiovasc Imaging 2017;18:1388–97.
13. Stankovic I, Aarones M, Smith HJ, Voros G, Kongsgaard E, Neskovic AN et al. Dynamic relationship of left-ventricular dyssynchrony and contractile reserve in patients undergoing cardiac resynchronization therapy. Eur Heart J 2014;35: 48–55.
14. Mada RO, Lysyansky P, Duchenne J, Beyer R, Mada C, Muresan L et al. New automatic tools to identify responders to cardiac resynchronization therapy.
J Am Soc Echocardiogr 2016;29:966–72.
15. Stankovic I, Prinz C, Ciarka A, Daraban AM, Kotrc M, Aarones M et al. Relationship of visually assessed apical rocking and septal flash to response and
long-term survival following cardiac resynchronization therapy (PREDICT-CRT). Eur Heart J Cardiovasc Imaging 2016;17:262–9.
16. Auger D, Hoke U, Bax JJ, Boersma E, Delgado V. Effect of atrioventricular and ventriculo ventricular delay optimization on clinical and echocardiographic outcomes of patients treated with cardiac resynchronization therapy: a meta-analysis. Am Heart J 2013;166:20–9.
17. Brignole M, Auricchio A, Baron-Esquivias G, Bordachar P, Boriani G, Breithardt OA et al. 2013 ESC Guidelines on cardiac pacing and cardiac resynchronization therapy: the Task Force on cardiac pacing and
resynchronization therapy of the European Society of Cardiology (ESC). Developed in collaboration with the European Heart Rhythm Association (EHRA). Eur Heart J 2013;34: 2281–329.
18. Kosmala W, Marwick TH. Meta-analysis of effects of optimization of cardiac resynchronization therapy on left ventricular function, exercise capacity, and
quality of life in patients with heart failure. Am J Cardiol 2014;113:988–94.
19. Daubert C, Behar N, Martins RP, Mabo P, Leclercq C. Avoiding non-responders to cardiac resynchronization therapy: a practical guide. Eur Heart J 2017;38:1463–72.
20. Bernard A, Menet A, Marechaux S, Fournet M, Schnell F, Guyomar Y et al. Predicting clinical and echocardiographic response after cardiac resynchronization therapy with a score combining clinical, electrocardiographic, and echocardiographic parameters. Am J Cardiol 2017;119:1797–802.
21. Donal E, Delgado V, Magne J, Bucciarelli-Ducci C, Leclercq C, Cosyns B et al. Rational and design of EuroCRT: an international observational study on multimodality imaging and cardiac resynchronization therapy. Eur Heart J Cardiovasc Imaging 2017;18:1120–7.
22. Bernard A, Donal E, Leclercq C, Schnell F, Fournet M, Reynaud A et al. Impact of cardiac resynchronization therapy on left ventricular mechanics: understanding the response through a new quantitative approach based on longitudinal strain integrals. J Am Soc Echocardiogr 2015;28:700–8.
Table 1: Comparison of estimated vs measured left ventricular pressure curves
0: Beginning of the cycle; MVC: Mitral Valve Closure; AVO: Aortic Valve Opening; AVC: Aortic Valve Closure; MVO: Mitral Valve Opening; end: end of the cycle; rRMSE: relative root mean square error
Table 2: Comparison of estimated versus measured markers as a function of CRT configuration
LV Pressure Segmental Area Global Work indices ICC
Total error
(%) Total RMSE (mmHg) ICC (mmHg.%) Mean Bias GPW GNW GWI
CRT OFF 50,6±17,8 13,3±5,4 0,983 53,9±126,4 0,996 0,961 0,997
LV pacing 40,4±24,0 11,9±4,4 0,992 141,9±121,3 0,991 0,893 0,997
RV pacing 41,2±25,2 12,7±5,9 0,985 66,6±145,7 0,986 0,928 0,992
BIV pacing 1 40,2 ±17,7 11,5±4,6 0,988 86,8±114,1 0,992 0,991 0,993
BIV pacing 2 43,6±19,8 12,0±3,6 0,991 108,9±127,0 0,993 0,886 0,994
Total cycle 0_MVC MVC_AVO AVO_AVC AVC_MVO MVO_end Error (%) 41,9±21,1 65,1±27,3 28,8±20,7 5,0±2,7 48,6±16,2 69,9±44,6 rRMSE (mmHg) 12,3±4,5 12,9±5,5 12,4±8,5 6,5±3,5 18,2±9,5 9,2±3,3
Figure 1: Schema of the global method 1 lo o p T T E lo ng a xi s vi ew 1 lo o p T T E 1 lo o p T T E 4C vi ew 2C vi ew MV C AV O AV C MV O Syst olic pressure (mmHg )
Es
tim
at
ed
p
re
ss
u
re
Me
as
u
re
d
p
re
ss
u
re
Ec
h
o
ca
rd
io
g
ra
p
h
y
Pr
es
su
re
-st
rai
n
cu
rves
53 55Figure 2: Example of a comparison of pressure curves (upper panel) and the corresponding observed strain trace (lower panel).
Figure 3: Myocardial work curves and method of calculation. Positive (Pi) and negative (Nj)
work are marked respectively as grey and black. Subscripts i (resp. j) corresponds to the ascending (resp. descending) parts of the curve.
!
"
!
#
!
$
%
"
%
#
%
$
&
'= ) %
* *&
,= ) !
-Figure 4: Results of segmental pressure-strain loops comparison, included all patients and all CRT configurations PSL: Pressure-strain loops Mean = 85,96 +2DS = 214,83 -2DS = -42,91 Y = 51,27 +0,87x R²= 0,975
Segmental PSL Area
Figure 5: Results of global work indices comparison, on all patients and all CRT configurations
Panel A: Intraclass correlation and Bland-Altman analysis of global positive work (GPW); Panel B: Intraclass correlation and Bland-Altman analysis of global negative work (GNW); Panel C: Intraclass correlation and Bland-Altman analysis of global work index (GWI).
Y = 0,95x + 32,89 R²= 0,982 Mean = 25,1 +2DS = 84,8 -2DS = -34,6 Y = 0,06 + 1,2x R² = 0,878 Mean = -41,4 +2SD = +4,7 -2Ds= -87,5
Global Work Index Y =7,71 +1,01x
R²=0,971
Mean = -16,36 -2Ds= -98,43 +2DS = 65,71
Global Negative Work Global Positive Work