HAL Id: hal-00295965
https://hal.archives-ouvertes.fr/hal-00295965
Submitted on 4 Jul 2006
HAL is a multi-disciplinary open access
archive for the deposit and dissemination of
sci-entific research documents, whether they are
pub-lished or not. The documents may come from
teaching and research institutions in France or
abroad, or from public or private research centers.
L’archive ouverte pluridisciplinaire HAL, est
destinée au dépôt et à la diffusion de documents
scientifiques de niveau recherche, publiés ou non,
émanant des établissements d’enseignement et de
recherche français ou étrangers, des laboratoires
publics ou privés.
vapor: vibrational assignments and potential for
atmospheric monitoring
T. J. Johnson, T. Masiello, S. W. Sharpe
To cite this version:
T. J. Johnson, T. Masiello, S. W. Sharpe. The quantitative infrared and NIR spectrum of CH2I2
vapor: vibrational assignments and potential for atmospheric monitoring. Atmospheric Chemistry
and Physics, European Geosciences Union, 2006, 6 (9), pp.2581-2591. �hal-00295965�
www.atmos-chem-phys.net/6/2581/2006/ © Author(s) 2006. This work is licensed under a Creative Commons License.
Chemistry
and Physics
The quantitative infrared and NIR spectrum of CH
2
I
2
vapor:
vibrational assignments and potential for atmospheric monitoring
T. J. Johnson, T. Masiello, and S. W. Sharpe
Pacific Northwest National Laboratory, Richland, WA 99354, USA
Received: 15 November 2005 – Published in Atmos. Chem. Phys. Discuss.: 17 February 2006 Revised: 16 May 2006 – Accepted: 16 May 2006 – Published: 4 July 2006
Abstract. Diiodomethane (CH2I2) has recently become a molecule of significant atmospheric interest as it can con-tribute to coastal IO formation. As part of the PNNL database of gas-phase infrared spectra, the quantitative absorption spectrum of CH2I2 has been acquired at 0.1 cm−1 resolu-tion. Two strong b2 symmetry A-type bands at 584 and 1114 cm−1 are observed, but are not resolved when broad-ened to 760 Torr with nitrogen and appear as B-type. In contrast, the b1 symmetry C-type bands near 5953, 4426 and 3073 cm−1 are resolved with rotational structure, in-cluding Q-branches with widths ≤1 cm−1. The quantita-tive infrared and near-infrared vapor-phase spectra (600– 10 000 cm−1) are reported for the first time. Some bands are discussed in terms of their potential for atmospheric mon-itoring and theoretical detection limits on a selected basis. FT-Raman spectra and ab initio calculations are used to com-plete vibrational assignments in the C2vpoint group.
1 Introduction
Twenty-five years ago Chameides and Davis (1980) sug-gested the potential importance of iodine in tropospheric chemistry. They recognized that certain species such as methyl iodide, CH3I, are easily photolyzed to liberate atomic iodine, which can react with O3 and then NOx or HOx to form other inorganic species such as IO, HOI or IONO2. The analogous reactions for diiodomethane, CH2I2, are:
CH2I2+hν →CH2I + I (1)
I + O3→IO + O2 (2)
IO + HO2→HOI + O2 (3)
IO + NO2→IONO2 (4)
Correspondence to: T. J. Johnson (timothy.johnson@pnl.gov)
Similar to the ClOx and BrOx systems, the various iodine species can be cycled back to a radical I atom with catalytic O3destruction and an increase in the NO2/NO ratio. Subse-quent works continue to emphasize the importance of iodine in atmospheric chemistry (Solomon et al., 1994). Although typical concentrations are low (sub-ppbv), most organic io-dides are readily photolyzed in the visible and near-UV and the ensuing kinetics are typically fast, thus leading to the im-portance of the iodine cycles.
In addition to CH3I, the photolysis of CH2I2was also in-vestigated some years ago where it was suggested that I2can appear as an end photoproduct and at high concentrations there is regeneration of the parent compound (Schmitt and Comes, 1980; Kasper et al., 1964, 1965). More recently and more importantly, the photolysis of CH2I2has had renewed interest since laboratory experiments have shown that the photolysis of certain iodine-containing species in the pres-ence of ozone (O3) plays a direct role in the formation of aerosols (Jimenez et al., 2003; Kolb, 2002; Burkholder et al., 2004). It has been shown that the photolysis of CH2I2in the presence of ozone results (via Reaction 2) in IO, and CH2I2 is thus a major contributor to coastal IO formation. Field experiments have subsequently shown that the seas are a di-rect source of several gas-phase halogenated species, (Mc-Figgans et al., 2004; Carpenter et al., 1999) including CH2I2. Diiodomethane and other alkyl iodides have been identified with maritime biogenic sources, (Carpenter et al., 1999) in particular Laminaria Macroalgae (McFiggans et al., 2004) or the brown algae Fucus (M¨akel¨a et al., 2002). The existence of the iodine dioxide molecule, OIO, was first observed in the laboratory by Himmelmann et al. (1996). Ravishankara and co-workers (Harwood et al., 1997; Gilles et al., 1997) first investigated the kinetics of the IO radical reacting either with BrO or with itself, while Cox and colleagues (Bloss et al., 2001; Rowley et al., 2001; Cox et al., 1999) first observed OIO as a primary reaction product:
IO + XO → OIO + X X=Br, I. (5) Tucceri et al. (2006) have recently measured the OIO absorp-tion cross-secabsorp-tions using pulsed laser photolysis. O’Dowd and co-workers have also shown that nucleation was ob-served over several orders of magnitude in CH2I2and sug-gested that the gas-phase OIO is responsible for the new particle growth (Jimenez et al., 2003; M¨akel¨a et al., 2002). CH2I2photolysis in the presence of ozone thus plays a role in marine boundary layer ozone loss (Vogt et al., 1999).
In terms of spectroscopy, relatively little has been reported regarding gas-phase CH2I2. The early photolysis work of Pi-mentel and co-workers, as well as Kroger et al. (1976) and Schmitt and Comes (1980) showed that photolysis liberates an I atom and an internally excited CH2I radical. Vibrational spectra of CH2I2 liquid have been reported previously by both Ford (1975) and Voelz et al. (1953), with the fundamen-tals being assigned in the C2v point group, as well as a few combination and overtone bands. Although both the liquid-and vapor-phase spectra have been recorded in the IR, (Ford, 1975; Voelz et al., 1953), it appears the resolution was not sufficient to resolve any ro-vibronic structure in the vapor. There have also been assignments made of the 1νCH=3, 4, 5 and 6 overtones in the near-infrared spectrum, (Henry and Hung, 1978) but these were also in the liquid phase. The an-harmonicity was used to extrapolate a fundamental frequency of 3059 cm−1for the liquid, which would correspond to the C-H stretch ν6fundamental (vide infra). While Marshall et al. (2005) have calculated frequencies, but not intensities, of CH2I2 using ab initio methods, to date there have been no quantitative vapor spectra of this moderately volatile species (1.2 Torr at 298 K).
The Pacific Northwest National Laboratory (PNNL) con-tinues to construct a reference library of quantitative high-resolution infrared spectra designed for tropospheric mon-itoring (Sharpe et al., 2004). This Northwest Infrared (NWIR) database, is optimized for best signal-to-noise ratio (SNR) in the long-wave infrared (LWIR), 800–1300 cm−1, but each spectrum has a minimal spectral range of ≤600 to
≥6500 cm−1. When certain bands are recognized as hav-ing sufficient SNR outside this minimal spectral range, these data are also included. The reference spectra are intended primarily for open path monitoring; each laboratory mea-surement has the analyte back-pressurized with ultra-high purity (UHP) nitrogen to 760±5 Torr. The data are neverthe-less recorded at 0.112 cm−1resolution in the desire to bring out all possible spectral features, not only the resolved ro-vibronic lines of lighter species, but also the Q-branches of many polyatomics that display halfwidths of 1 cm−1or less. Recognizing that most species have typical pressure broaden-ing coefficients of ∼0.1 cm−1/atm, additional resolution was deemed unnecessary for these reference data.
While constructing the NWIR database, it was recognized that CH2I2has recently garnered great interest among the at-mospheric community, and it would be beneficial to point
out alternate method for monitoring this trace gas. While GC/MS offers excellent sensitivity for CH2I2analysis, it is limited to point measurements (Wevill and Carpenter, 2004). Since estimated maritime boundary layer concentrations are at most 100’s of pptv, it was recognized that the only opti-cal methods with sufficient sensitivity to see CH2I2 would be, for example, long path DOAS (Platt, 1994) or narrow-band IR laser techniques (Johnson et al., 1991a; Sharpe et al., 1998): Special attention was thus paid to narrow spectral fea-tures: e.g., transitions over which a probing laser frequency can easily be tuned.
2 Experimental
Using the methods of Chu et al. (1999) and Sharpe et al. (2004) a series of measurements is made, each corre-sponding to a different concentration-path length burden. Each fitted spectrum, in fact, represents a series of (typically
>10) individual measurements at 298.1 K, with the differ-ent measuremdiffer-ents covering a large range (often >2 orders of magnitude) of analyte burdens, each burden pressurized with UHP N2to one atmosphere. The fitted spectrum is derived by fitting a Beer’s law plot at each wavelength channel to each of the individual burdens. In order to account for any of several different nonlinearity phenomena in the A=f(P) fit, the individual burdens are in addition weighted according to T2(where T=I/Io). All values with T<0.025 (i.e. decadic ab-sorbance A>1.6) are weighted with zero. This multiple bur-den with weighted data approach retains several advantages over any single measurement or few measurements: First, multiple measurements greatly enhance the SNR ratio. Sec-ond, the high burden measurements enhance the SNR for the weak bands that might not exceed the noise floor in any mea-surement designed to keep the strong bands on scale. Third, for the strong bands, the weighting mechanism brings out a better fidelity to account for Beer’s law saturation effects, photoconductive detector nonlinearity effects or other phe-nomena that cause the absorbance values to not scale with burden. Finally, analyzing the residual vector has proven helpful at recognizing chemical impurities as their signatures typically do not scale with the fit.
Allen et al. (2005) have also recently published the ad-vantages of fitting the absorbance as a function of partial pressure in order to calculate A(λ), as first discussed by Chu et al. (1999). The Chu et al. methods go further, how-ever, that in addition to the absorbance data linear fit at each wavelength bin, the raw data also have a weighting factor to account for nonlinearity mechanisms. In this method the residual fit vector is, moreover, carefully analyzed since any chemical impurities, including the uncommon ones, readily manifest themselves in the residual. The PNNL method typ-ically measures twelve to fifteen separate burdens ranging over two orders of magnitude. The resulting error analy-sis (Sharpe et al., 2003) shows that the maximal expected
systematic errors in absorbance are 3% for the PNNL static system measurements and 7% for flow system measure-ments, including the CH2I2values reported here. The mea-sured random values are less than this, and these results have been vetted against NIST for a host of different molecules as described by Sharpe (2003, 2004), which contain further de-tails of the error analysis. The above discussion is valid for each of the 400+ molecules in the PNNL database. In addi-tion, for CH2I2and a handful of other species, high resolu-tion (0.0015 cm−1)studies have assigned all observed bands to the analyte, increasing confidence as to chemical purity. (Maki et al., 2001; Masiello et al., 2005).
The CH2I2sample itself was from Aldrich Chemicals and its purity was monitored by comparing to known infrared spectra. A Bruker IFS 66v/S vacuum spectrometer (John-son et al., 2005) was used over the 600 to 6500 cm−1range. The spectrometer hardware characteristics have been previ-ously documented (Johnson et al., 2002) according to IUPAC guidelines, (Bertie et al., 1998) taking care to avoid ghosting, “warm aperture” (Johnson et al., 2002) and detector nonlin-earity (Chase, 1984; Birk et al., 1996) artifacts. Due to the modest vapor pressure of CH2I2 (1.2 Torr at 298 K, Yaws, 1999) these measurements were made on a long path flowed system whereby the liquid analyte is quantitatively deliv-ered into a heated stream of ultra-high purity N2carrier gas, (Sharpe et al., 2003) using a specially constructed vapor dis-semination system (Johnson et al., 20061). The measurement at 298.1 K is made in a specially designed White cell with a circulating liquid jacket which can provide more precise tem-perature control (Ballard et al., 1994) with the optical path set to 7.96 m (±0.5%). The temperature is measured by placing a NIST-traceable temperature probe directly into the gas in the White cell; the stated accuracy is ±0.2 K. For each of the 12 burdens, 256 interferograms were averaged to reduce noise. Gain ranging improved the signal-to-noise by ampli-fying the wings of the interferogram before digitization. The single-sided interferograms were zerofilled 2× and phase corrected using Mertz’s method (Mertz, 1967). Decadic ab-sorbance spectra were calculated in the usual manner [−log (I/Io)] using the spectrum of the cell with just N2carrier gas for Io. The final data product is a spectrum that corresponds to an optical path of 1 m through a mixing ratio of 1 ppmvof analyte at 296 K.
For this particular molecule, several bands of interest were noted in the near-infrared (NIR) range, so seventeen addi-tional burdens were measured with alternate hardware opti-mized to improve the NIR signal/noise. These included a tungsten halide source, a Si/CaF2beamsplitter, and a photo-voltaic InSb detector. The mirror scan speed was adjusted to 20 kHz, but all other collection parameters were as for the mid-infrared measurements (Sharpe et al., 2004). The
1Johnson, T. J., Sharpe, S. W., and Covert, M. A.: A Method for
Quantitative Dissemination of Vapors, Review of Scientific Instru-ments, in review, 2006.
NIR spectra covered the 1900 to 10 000 cm−1 range, for a total range of 550–10 000 cm−1. Data are only plotted to 6500 cm−1 as the few bands at higher frequencies are rela-tively weak. The FT-Raman spectra were collected over the range from 50 to 3600 cm−1Stokes shift and from −100 to
−1000 cm−1 anti-Stokes shift using a previously described instrument (Williams et al., 2006). Raman frequencies are calibrated using the interferometer HeNe laser and the Ra-man Nd:YAG laser. For a given FT-RaRa-man spectrum the fre-quency accuracy has been shown to be better than 1 cm−1. Data collection parameters and methods for the low pres-sure, high resolution IR spectra (0.0015 cm−1on a Bruker IFS 125), including for peaks reported in the far-IR, have al-ready been reported by Maki et al. (2001). Theoretical ab initio calculations were performed using the NWChem soft-ware algorithm. The vibrational frequencies and infrared line intensities (peak maxima) were calculated at the MP2 level with the largest basis set (6–311 g**) possible that delivers both frequencies and intensities; the frequencies are typically too large, and are customarily scaled by a factor of 0.955 (Marshall et al., 2005).
3 Results
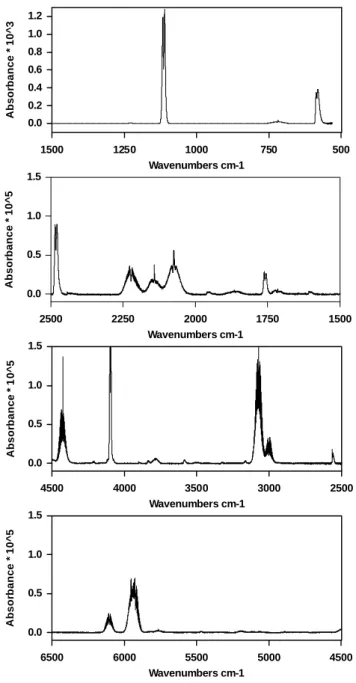
Figure 1 reports the quantitative gas-phase infrared spec-trum2 of methylene iodide (diiodomethane) from 550 to 6500 cm−1. The y-axis is quantitative such that the ab-sorbance values correspond to an optical path of 1 m through a concentration of 1 ppmvof analyte at 296 K and 1 atm to-tal pressure. The reported spectrum represents the weighted average of 12 individual measurements for the mid-infrared and 17 measurements for the near-infrared. The concate-nated spectrum has been broken into four separate plots for visual clarity. Note that the plot in Fig. 1a has a different or-dinate scale as the ν9band at 584.21 cm−1and the ν8band at 1113.87 cm−1are both IR-allowed fundamentals and are very intense bands. Plots 1b, 1c and 1d are all on the same scale, and all plots represent an average from multiple bur-dens of CH2I2, each burden pressure-broadened to 760 Torr. The peak positions and band types of the fundamentals for the present vapor-phase data are given in Table 1. Also in Table 1 are the corresponding liquid-phase values, both in-frared and Raman, as well as the vibrational assignments. Table 2 presents the integrated vapor-phase band strengths (in units of cm−1cm2molecule−1, or cm molecule−1) for the fundamentals. While the data in the NWIR database use base 10 logarithms, the band integrals in Table 2 use Naperian (natural) logarithms at 296 K for the peak height as this is the more common unit for S. Also in Table 2 are the frequencies and intensities as calculated by the ab initio program NWChem. As these are the first Fourier-transform measurements of vapor-phase CH2I2the accuracy along the
2The CH
2I2 spectrum and other NWIR data can be found at
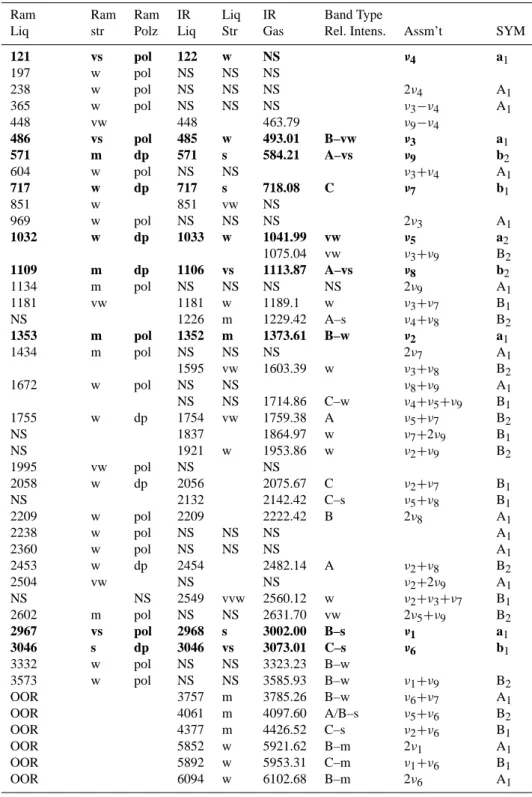
Table 1. Observed Raman (liquid), Infrared (liquid and gas) vibrational frequencies, Raman polarizations and (for vapor measurements)
band types of CH2I2, together with symmetries and vibrational assignments. Frequencies are in cm−1. Fundamental frequencies are printed
in bold. Details can be found in text. NS = not seen, OOR = out of range.
Ram Ram Ram IR Liq IR Band Type
Liq str Polz Liq Str Gas Rel. Intens. Assm’t SYM
121 vs pol 122 w NS ν4 a1 197 w pol NS NS NS 238 w pol NS NS NS 2ν4 A1 365 w pol NS NS NS ν3−ν4 A1 448 vw 448 463.79 ν9−ν4 486 vs pol 485 w 493.01 B–vw ν3 a1 571 m dp 571 s 584.21 A–vs ν9 b2 604 w pol NS NS ν3+ν4 A1 717 w dp 717 s 718.08 C ν7 b1 851 w 851 vw NS 969 w pol NS NS NS 2ν3 A1 1032 w dp 1033 w 1041.99 vw ν5 a2 1075.04 vw ν3+ν9 B2 1109 m dp 1106 vs 1113.87 A–vs ν8 b2 1134 m pol NS NS NS NS 2ν9 A1 1181 vw 1181 w 1189.1 w ν3+ν7 B1 NS 1226 m 1229.42 A–s ν4+ν8 B2 1353 m pol 1352 m 1373.61 B–w ν2 a1 1434 m pol NS NS NS 2ν7 A1 1595 vw 1603.39 w ν3+ν8 B2 1672 w pol NS NS ν8+ν9 A1 NS NS 1714.86 C–w ν4+ν5+ν9 B1 1755 w dp 1754 vw 1759.38 A ν5+ν7 B2 NS 1837 1864.97 w ν7+2ν9 B1 NS 1921 w 1953.86 w ν2+ν9 B2 1995 vw pol NS NS 2058 w dp 2056 2075.67 C ν2+ν7 B1 NS 2132 2142.42 C–s ν5+ν8 B1 2209 w pol 2209 2222.42 B 2ν8 A1 2238 w pol NS NS NS A1 2360 w pol NS NS NS A1 2453 w dp 2454 2482.14 A ν2+ν8 B2 2504 vw NS NS ν2+2ν9 A1 NS NS 2549 vvw 2560.12 w ν2+ν3+ν7 B1 2602 m pol NS NS 2631.70 vw 2ν5+ν9 B2 2967 vs pol 2968 s 3002.00 B–s ν1 a1 3046 s dp 3046 vs 3073.01 C–s ν6 b1 3332 w pol NS NS 3323.23 B–w 3573 w pol NS NS 3585.93 B–w ν1+ν9 B2 OOR 3757 m 3785.26 B–w ν6+ν7 A1 OOR 4061 m 4097.60 A/B–s ν5+ν6 B2 OOR 4377 m 4426.52 C–s ν2+ν6 B1 OOR 5852 w 5921.62 B–m 2ν1 A1 OOR 5892 w 5953.31 C–m ν1+ν6 B1 OOR 6094 w 6102.68 B–m 2ν6 A1
wavelength axis is much higher (Sharpe et al., 2004; Maki and Wells, 1991). High resolution vapor-phase infrared spec-tra confirm our low resolution estimates for many of the band
origins given in Table 1. However, precise determination of the band origins can only be achieved through analysis of the high resolution data. Consequently, an error of ±0.1 cm−1
should be assumed for all values given in Table 1 for the vapor-phase spectra.
The vibrational assignments largely agree with those of Voelz and co-workers (1953) as well as Ford (1975). The nine fundamentals in the C2v point group are printed in bold in Table 1. The long path gas cell and greater instrumen-tal sensitivity allow for observation of even very weak fun-damentals including ν3(a1symmetry, 493.01 cm−1) ν7(b1, 718.08 cm−1)and ν2(a1, 1373.61 cm−1). The Raman spec-tra aided in the assignment and confirmation of many vibra-tional bands, especially the polarized Raman spectra which helped to confirm assignment of vibrational modes with a1 symmetry. The symmetric ν1 (3002.00), ν2 (1373.61), ν3 (493.01) and ν4 (122 cm−1) a1 modes are easily assigned due to their medium to very strong Raman signals which are all strongly polarized (i.e. a1modes). We note that the
ν4(122 cm−1)fundamental was not observed in any of the IR gas-phase spectra, including path lengths >35 m. This diminished intensity does agree with that predicted by the ab initio calculations (Table 2). The ν8 (1113.87) and ν9 (584.21) IR bands are both b2 modes and dominate the IR spectrum. Although both appear to be B-type bands in the pressure-broadened 0.1 cm−1gas-phase measurements, high resolution (0.0015 cm−1)measurements at low pressure do show A-type contours, and centralized Q-branch features as expected.
The ν5 (a2) fundamental is seen in both the liquid Ra-man and liquid IR spectra at 1033 cm−1. As an a2 mode, it is IR forbidden in the C2v point group, but we can tenta-tively assign the very weak 1041.99 cm−1band as the cor-responding gas phase fundamental which has modest inten-sity in the liquid due to condensed phase interactions. The depolarized Raman signal helps assign the symmetry. The
ν3+ν9 combination band is seen only in the gas phase at 1075.04 cm−1, while the band at 2075.67 is the ν2+ν7 com-bination. Many of the overtone, combination and differ-ence bands are assigned for the first time. In particular, we assign for the first time many of the bands at frequencies
>3500 cm−1. Although these frequencies are outside the Ra-man spectrum, the vapor-phase band profiles (Fig. 2), along with the NWChem ab initio calculations make the assign-ments straightforward in most cases.
In terms of band strengths, the b2ν9(584.21 cm−1)and ν8 (1113.87 cm−1)bands are clearly the most intense IR bands and dominate the spectrum. Both are pressure broadened at 760 Torr (Nitrogen) to form unresolved bands that are B-type in appearance, but in fact are A-type. Of the two, ν8is the more intense with a width (FWHM) of 11.8 cm−1and a peak amplitude 1.2×10⁻³absorbance for 1 ppm-m. The spacing of the CH2I2rotational lines in the ν8and ν9bands is quite small and these do not resolve at atmospheric pressure. They do resolve at low pressure, however, and a high resolution study assigning both these bands is currently under way in our laboratory using previously described high resolution in-strumentation (Maki et al., 2001).
4500 5000 5500 6000 6500 Wavenumbers cm-1 0.0 0.5 1.0 1.5 Absor bance * 10^ 5 500 750 1000 1250 1500 0.0 0.2 0.4 0.6 0.8 1.0 1.2 Wavenumbers cm-1 Absor bance * 10^ 3 0.0 0.5 1.0 1.5 2500 3000 3500 4000 4500 Wavenumbers cm-1 Ab sor bance * 1 0 ^ 5 1500 1750 2000 2250 2500 Wavenumbers cm-1 0.0 0.5 1.0 1.5 A b sor b ance * 10^ 5
Fig. 1. Mid- and near-infrared quantitative spectrum of
di-iodomethane (CH2I2) from 6500 to 550 cm−1, recorded at
0.1 cm−1resolution. The spectrum is actually a composite derived
from multiple spectra that corresponds to 1 ppm-m of gas at 296 K pressure-broadened to 760 Torr. Note that due to the strong bands
at 584 and 1114 cm−1panel (a) has been multiplied by 103, while
panels (b–d) have been multiplied by 105on the y-axis. See text for
details.
For the remaining pressure-broadened bands shown in Fig. 1, many are of approximately the same band strength, and of these several are C-type bands that exhibit resolved Q-branches. We focus on these in particular, since the re-solved structure better lends itself to open path monitor-ing, either via methods such as DOAS (Platt, 1994; Volka-mer et al., 2005) or laser-based techniques. Three of these
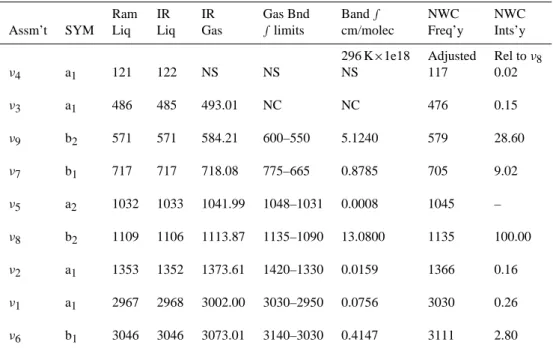
Table 2. Observed Raman (liquid) and infrared (liquid and gas) vibrational frequencies along with gas-phase band integrals for the
funda-mental vibrations of CH2I2. Frequencies are in cm−1and band integrals are in units of cm-molecule−1, using Naperian (natural) logarithms
at 296 K for the peak heights, and have been multiplied by 1018. Also listed are the frequencies (scaled by 0.955) and IR intensities relative
to ν8as predicted by NWChem. Details in text.
Ram IR IR Gas Bnd Band ∫ NWC NWC
Assm’t SYM Liq Liq Gas ∫limits cm/molec Freq’y Ints’y
296 K×1e18 Adjusted Rel to ν8
ν4 a1 121 122 NS NS NS 117 0.02 ν3 a1 486 485 493.01 NC NC 476 0.15 ν9 b2 571 571 584.21 600–550 5.1240 579 28.60 ν7 b1 717 717 718.08 775–665 0.8785 705 9.02 ν5 a2 1032 1033 1041.99 1048–1031 0.0008 1045 – ν8 b2 1109 1106 1113.87 1135–1090 13.0800 1135 100.00 ν2 a1 1353 1352 1373.61 1420–1330 0.0159 1366 0.16 ν1 a1 2967 2968 3002.00 3030–2950 0.0756 3030 0.26 ν6 b1 3046 3046 3073.01 3140–3030 0.4147 3111 2.80
bands with the C-type profile will be considered in more detail for pressure-broadened (ambient) monitoring. Fig-ure 2’s top trace displays the ν1fundamental at 3002.00 cm−1 along with the C-type ν6band at 3073.01 cm−1, where the plot again represents an optical depth of 1 ppm-m. For the
ν6band the Q-branch has a peak height of 2.65×10⁻⁵ OD with a Q-branch differential peak height of 1.98×10⁻⁵. The middle trace of Fig. 2 plots the ν2+ν6combination band at 4426.52 cm−1, and the lower trace shows the 2 ν
1overtone at 5921.62 cm−1along with the (ν1+ν6)combination C-type band at 5953.31 cm−1. Note that the y-axis has been held the same in the three plots to show the relative line strengths, most of which are comparable, though all these bands are approximately two orders of magnitude weaker than ν8or ν9 bands in the long-wave infrared.
4 Discussion
Both the intense IR fundamentals, ν9at 584.21 cm−1and ν8 at 1113.87 cm−1, shown in Fig. 1 are in fact unresolved A-type bands and fall in an “atmospheric window”. For low res-olution monitoring, the ν8band at 1113.87 cm−1is the most promising as it lies in the center of the LWIR window. We note that both the ν8and ν9fundamentals are of b2symmetry in the C2vpoint group. At 0.1 cm−1resolution and pressure broadened by N2, both appear as B-type bands, but very high resolution spectra recorded at low pressure have shown the
expected A-type structure. The ν8band has a width (FWHM) of 11.8 cm−1, and a peak amplitude of 1.2×10⁻³ OD for 1 ppm-m. At lower resolution, typically 4 or 8 cm−1, used in most ambient monitoring situations with an active or semi-active FTIR system (Johnson et al., 2004), the one minute detection limits are of the order 10−4OD (Griffith and Jamie, 2000). This suggests that for a 500 m (open) path, an opti-mistic detection limit for CH2I2 is 500 pptv. Consequently, current FT-methods would be challenged to observe the an-ticipated <100 pptv biogenic levels of CH2I2(Carpenter et al., 1999). Although they are the strongest bands, the ν8and
ν9bands are unresolved at 760 Torr and may not be useful for open-path laser monitoring. As mentioned above, however, these bands do resolve at low pressure, and their assignments and potential for monitoring will be discussed in a separate work. We are optimistic that the line strengths are sufficient to be useful for extractive monitoring, using e.g. Pb-salt or QC-laser systems.
Of the laser methods, Pb-salt systems have been widely used in the mid-IR (λ=3 to 20 µm), primarily as point sen-sors using long path cells at low pressure (Werle et al., 2004). Several near-IR laser systems have been deployed using tech-niques such as FM modulation (Johnson et al., 1991b) or cavity ring-down methods (Bitter et al., 2005). Until re-cently, the greatest limitations appear to be the tunability and wavelength availability of the lasers, predominantly limited to the wavelengths used by the telecommunications industry
5860 5880 5900 5920 5940 5960 5980 6000 Wavenumbers cm-1 0.0 0.5 1.0 1.5 2.0 A b so rb an ce* 10^ 5 4380 4400 4420 4440 4460 Wavenumbers cm-1 0.0 0.5 1.0 1.5 2.0 A b so rb an ce * 10^ 5 2950 3000 3050 3100 0.0 0.5 1.0 1.5 2.0 Wavenumbers cm-1 A b so rb an ce * 10^ 5 ν6 ν1 ν2+ν6 2ν1 ν1+ν6
Fig. 2. Details of three spectral regions of interest for monitoring. The spectra are all pressure broadened to 760 Torr and are compos-ite spectra that correspond to 1 ppm-m optical depth. The y-axis is
on the same scale in all three panels. Panel (a) shows the ν1band
(3002 cm−1)along with the ν6band (3073 cm−1), panel (b) shows
the (ν2+ν6)combination band at 4427 cm−1, while panel (c) shows
the 2 ν1overtone band (5921 cm−1)along with the (ν1+ν6)
com-bination band at 5953 cm−1.
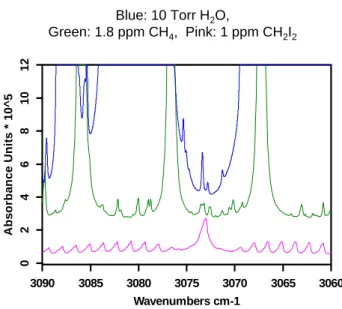
(e.g. 1.3 or 1.55 µm). The recent advent of quantum cascade (QC) lasers shows excellent promise as these are available from the near-IR to the terahertz (THz) wavelengths. These lasers have also demonstrated an important feature in that they have significant tuning ranges, typically >0.5% or more of the central wavelength, depending on the nature of the de-vice fabrication. This allows, for example, tuning across a 1 cm−1wide Q-branch for atmospheric monitoring purposes. Figure 3 demonstrates one possibility for monitoring us-ing the Q-branch of the 760 Torr ν6 band at 3073.01 cm−1; this CH2I2spectrum (1 ppm-m) is plotted in pink. Although 1 ppm is far greater than expected ambient concentrations, this may simulate a chamber experiment. Also plotted in Fig. 3 are 1 m paths for typical ambient concentrations (War-neck, 1988) of 1.8 ppm for methane (green) and the optical density corresponding to 10 Torr of H2O (blue). The water data are from the HITRAN database (Rothman et al., 2005) since the HITRAN calculated data have no noise that can ob-fuscate the signal when expanded thousands of times. The database was examined for other potential interferents with high background concentrations (e.g. N2O, CO2, CO), but
Blue: 10 Torr H2O, Green: 1.8 ppm CH4, Pink: 1 ppm CH2I2 3060 3065 3070 3075 3080 3085 3090 Wavenumbers cm-1 0 2 4 6 8 10 12 A b so rb an ce U n it s * 10^ 5
Fig. 3. Comparison plot (all at 0.1 cm−1resolution) showing
poten-tial interferents to the CH2I2ν6band at 3073.01 cm−1. The traces
correspond to 1 ppm-m of CH2I2(lower trace – pink), 1.8 ppm-m
of CH4(middle trace – green), and 10 Torr of H2O (upper trace –
blue). The H2O data are from the HITRAN data base. The spectra
have been vertically offset for clarity. See text for details.
these did not show any interfering absorptions at these wave-lengths. The Q-branch at 3073 cm−1corresponds to a differ-ential peak height of 1.98×10⁻⁵OD for 1 ppm-m, which is also equivalent to 1.98×10⁻⁵ for 1 ppb-km. The 3.25 µm wavelength can be accessed by both Pb-salt and quantum cascade diode lasers. Assuming an open path laser-based system with a 10 km path length, in order to achieve a 50 pptv detection limit, a spectrometer would need a detection sen-sitivity corresponding to ∼1×10⁻⁵OD or better. For an ex-tractive laser-based system with a 200 m path length, in or-der to achieve a 50 pptvdetection limit, a spectrometer would need a detection sensitivity corresponding to ∼2×10⁻⁷OD or better at these wavelengths Although such a ment would pose a challenge, the best extractive measure-ments at these wavelengths are now achieving such detection limits using difference frequency generation (Richter et al., 2002) or improved Pb-salt diode laser systems (Wert et al., 2003; Schiller et al., 2001). The weak methane lines near 3073 cm−1pose a concern, but the CH
4mixing ratios can be expected to be low and constant in marine atmospheres. It is also possible that using an extractive system with a near-infrared detector (e.g. InSb) and a long path cell that some of the lines in the Q-branch resolve and separate from those of methane, also possibly increasing the depth of any one of the CH2I2lines. Orphal and Ibrahim (2005) have announced re-cent results showing that the ν1and ν6bands near 3.3 µm do resolve at low pressure and thus may be useful for extractive monitoring.
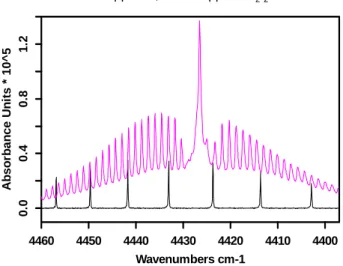
Black: 1 ppm HI; Pink: 1 ppm CH2I2 4400 4410 4420 4430 4440 4450 4460 Wavenumbers cm-1 0. 0 0. 4 0. 8 1. 2 A b so rb an ce U n it s * 10^ 5
Fig. 4. Comparison plot (all at 0.1 cm−1resolution) showing
po-tential laser combination measurements using the CH2I2(ν2+ν6)
combination band at 4426.52 cm−1. The traces correspond to
1 ppm-m of CH2I2(upper trace – pink), and 1 ppm-m of hydrogen
iodide, HI (lower trace – black). The spectra have been vertically offset for clarity.
Figure 4 plots the (ν2+ν6) combination band at 4426.52 cm−1which we report for the first time. Figure 4’s bottom trace also shows some of the sharp lines of the 2ν1 overtone band of hydrogen iodide gas, HI. It was hoped that using a single laser it may be possible to simultaneously monitor both HI and CH2I2 by slight tuning of the wave-length. However, closer inspection of the database imme-diately showed that expected concentrations of 1.8 ppmv of CH4or 316 ppbv of nitrous oxide (Evans and Puckrin, 1997) would interfere with such a measurement, particularly the N2O. However, extractive measurements may still afford a practical separation of the HI/CH2I2pair from the interfering signals, particularly at wavenumbers >4440 cm−1, although wall adhesion mechanisms are of concern for species such as HI, HCl, or HNO3 (Chackerian et al., 2003; Johnson et al., 2003). Nevertheless, such bands could be of use in e.g. a chamber kinetics study without CH4or N2O.
The traces in Fig. 5 display two new bands of CH2I2, namely the 2ν1 overtone (A1 symmetry, B-type) at 5921.62 cm−1, as well as the (ν1+ν6)combination C-type band at 5953.31 cm−1. Both have resolved rotational struc-ture even when pressure broadened to one atmosphere. The structure in these bands suggests the possibility of remote sensing as the Q-branch at 5953 cm−1as well as several of the individual rotational lines, e.g. in the 2ν1R branch near 5930 cm−1have differential absorbances of ∼3×10⁻⁶. Such structure is very helpful not only for laser monitoring, but also for DOAS methods, which have been used to monitor trace gases such as HONO at the (sub-) ppbv levels (Platt et al., 1980). Detection limits of 10−4are achievable, and path lengths of >10 km are now common. In a much related work
Green: 1.8 ppm CH4, Pink: 1 ppm CH2I2 5880 5900 5920 5940 5960 5980 Wavenumbers cm-1 0. 0 0. 2 0. 4 0. 6 0. 8 1. 0 1. 2 A b so rb an ce U n it s * 10^ 5 CH2I2 CH4
Fig. 5. Comparison plot (0.1 cm−1 resolution) showing
poten-tial laser combination measurements using the CH2I22 ν1
over-tone band (5921 cm−1)along with the ν1+ν6 combination band
at 5953 cm−1along with the potential interference from CH4. The
traces correspond to 1 ppm-m of CH2I2(upper trace – pink), and
1.8 ppm-m of methane, CH4(lower trace – green). The spectra have
been vertically offset for clarity. See text for details.
Alicke and co-workers (1999) have used such a set-up in the UV-visible with a 14.6 km path to measure IO at levels of
<10 pptv. For the case of CH2I2, if one assumes a 15 km (e.g. estuary) path and a differential cross section of 3×10⁻⁶ ppm-m (equivalent to 2.8×10⁻²¹cm2/molecule base-e) in order to observe 100 pptvof CH2I2it would be necessary to detect an absorbance of 4.5×10⁻⁶ at these wavelengths. This is certainly a challenging detection limit, but DOAS detection for methane has recently been reported at these wavelengths (Frankenberg et al., 2005).
Of the CH2I2 near-infrared bands discussed above, sev-eral fortuitously display resolved structure, even when broad-ened to 1 atmosphere. Although the telecommunications diode lasers are limited in wavelength selection, several re-cent technologies offer methods for sensitive trace gas de-tection using such lines. These include tunable optical para-metric oscillators, difference frequency generation (Richter et al., 2002) and, recently, red-shifting the emission wave-length of near-IR lasers via high pressures (Adamiec et al., 2004). In terms of the CH2I2photochemistry in the presence of ozone, it may be possible to monitor the CH2I2, HI and IO simultaneously in a chamber type experiment as suggested by M¨akel¨a et al. (2002). The ν6 3073 cm−1 band may be useful in laboratory experiments where CH4and H2O con-centrations are reduced. Also, monitoring at 3 µm offers the advantage of less light scattering compared to visible or NIR regions.
5 Summary
The quantitative infrared and near-infrared vapor-phase spec-tra of diiodomethane, CH2I2, have been reported for the first time. Using FT-IR and FT-Raman spectroscopy as well as ab initio computational methods we have completed a vi-brational assignment. The atmospherically broadened spec-tra exhibit C-type bands near 5953, 4426 and 3073 cm−1 all have resolved rotational structure, including Q-branches with widths of ∼1 cm−1. While GC-MS currently offers bet-ter sensitivity for point monitoring, some of the quantitative bands discussed here could be potentially useful for (remote) monitoring of this important species. The ν6 Q-branch at 3073 cm−1shows promise for extractive monitoring by Pb-salt or QC diode laser systems and the band strengths sug-gest estimated CH2I2mixing ratios are near (or close to) the detection limit of current technology’s best systems. The two very strong b2 A-type bands (appearing as B-type, ν9 at 584.21 cm−1and ν8at 1113.87 cm−1)do not resolve at at-mospheric pressure, but show great promise for low pressure extractive laser studies. However, high resolution studies will first be needed.
The ν1+ν6band shows a resolved Q-branch at 4426 cm−1. While this band would be of little use for field measure-ments due to N2O interferences, it could be used e.g. in smog chambers (synthetic air) with FTIR/laser spectrome-ters. As Fig. 4 depicts, it has the added benefit of being able to simultaneously measure the adjacent HI lines in a kinetics study. The two bands shown in Fig. 5 with strong structure near 5950 cm−1may be of interest to e.g. the satellite-based DOAS systems as the long optical paths increase the burden for greater optical depth, and the wavelengths are just acces-sible on the red end of many current spectrometers.
Acknowledgements. We thank the referees for suggestions,
partic-ularly regarding the atmospheric chemistry. PNNL is operated for the U.S. Department of Energy by the Battelle Memorial Institute under contract DE-AC06-76RLO 1830. This work was supported under the DOE NA-22 program and we gratefully acknowledge that support. The experiment and calculations were performed at the W. R. Wiley Environmental Molecular Sciences Laboratory, a national scientific user facility sponsored by DOE’s Office of Biological and Environmental Research and located at Pacific Northwest National Laboratory.
Edited by: J. N. Crowley
References
Adamiec, P., Salhi, A., Bohdan, R., Bercha, A., Dybala, F., Trze-ciakowski, W., Rouillard Y., and Joulli´e, A.: Pressure-tuned InGaAsSb/AlGaAsSb Diode Laser with 700 nm Tuning Range, Appl. Phys. Lett., 85(19), 4292–4294, 2004.
Alicke, B., Hebestreit, K., Stutz J., and Platt, U.: Iodine Oxide in the Marine Boundary Layer, Nature, 397, 572–573, 1999.
Allen, G., Remedios, J. J., Newnham, D. A., Smith, K. M., and Monks, P. S.: Improved Mid-Infrared Cross-Sections for Perox-yacetyl nitrate (PAN) Vapour, Atmos. Chem. Phys., 5, 47–56, 2005,
http://www.atmos-chem-phys.net/5/47/2005/.
Ballard, J., Strong, K., Remedios, J. J., Page, M., and Johnston, W. B.: A Coolable Long Path Absorption Cell for Laboratory Spectroscopic Study of Gases, J. Quant. Spec. Rad. Trans., 52, 677–691, 1994.
Bertie, J. E.: Specification of Components, Methods and Parameters in Fourier Transform Spectroscopy by Michelson and Related Interferometers, Pure Appl. Chem., 70(10), 2039, 1998. Birk, M., Hausamann, D., Wagner G., and Johns, J. W.:
Determina-tion of Line Strengths by Fourier-transform Spectroscopy, Appl. Opt., 35, 2971–2985, 1996.
Bitter, M., Ball, S. M., Povey, I. M., and Jones, R. L.: A Broad-band Cavity Ringdown Spectrometer for in situ Measurement of Atmospheric Trace Gases, Atmos. Chem. Phys., 5, 2547–2560, 2005,
http://www.atmos-chem-phys.net/5/2547/2005/.
Bloss, W. J., Rowley, D. M., Cox, R. A., and Jones, R. L.: Kinetics and Products of the IO Self-reaction, J. Phys. Chem. A., 105, 7840–7854, 2001.
Burkholder, J. B., Curtius, J., Ravishankara A. R., and Lovejoy, E. R.: Laboratory Studies of the Homogeneous Nucleation of Iodine Oxide, Atmos. Chem. Phys., 4, 19–34, 2004,
http://www.atmos-chem-phys.net/4/19/2004/.
Carpenter, L. J., Sturges, W. T., Penkett, S. A., Liss, P. S., Alicke, B., Hebestreit, K., and Platt, U.: Short-lived Alkyl Iodides and Bromides at Mace Head, Ireland: Links to Biogenic Sources and Halogen Oxide Production, J. Geophys. Res., 104(D1), 1679– 1689, 1999.
Chackerian, C., Sharpe, S. W., and Blake, T. A.: Anhydrous
Ni-tric Acid Integrated Cross Sections: 820–5300 cm−1, J. Quant.
Spectr. Rad. Transf., 82(1–4), 429–441, 2003.
Chameides, W. L. and Davis, D. D.: Iodine: Its Possible Role in Tropospheric Photochemistry, J. Geophys. Res., C, 85, 7383– 7398, 1980.
Chase, D. B.: Nonlinear Detector Response and FT-IR, Appl. Spec., 38(4), 491–494, 1984.
Chu, P. M., Guenther, F. R., Rhoderick, G. C., and Lafferty, W. J.: The NIST Quantitative Infrared Database, J. Res. Natl. Inst. Stand. Technol., 104, 59, 1999.
Cox, R. A., Bloss, W. J., Jones, R. L., and Rowley, D. M.: OIO and the Atmospheric Cycle of Iodine, Geophys. Res. Lett., 26(13), 1857–1860, 1999.
Evans, W. F. J. and Puckrin, E.: A Wintertime Measurement of the Greenhouse Radiation from Nitrous Oxide, Can. J. Atmos. Sciences and Spectr., 42(5), 141–145, 1997.
Ford, T. A.: Infrared and Raman Spectra and Vibrational Assign-ments of Diiodomethane and Its Deuterated Analogs, J. Mol. Spec., 58, 185–193, 1975.
Frankenberg, C., Meirink, J. F., van Weele, M., Platt, U., and Wag-ner, T.: Assessing Methane Emissions from Global Space-Borne Observations, Science, 308, 1010–1014, 2005.
Gilles, M. K., Turnipseed, A. A., Burkholder, J. B., Ravishankara, A. R., and Solomon, S.: Kinetics of the IO radical: 2. Reaction of IO with BrO, J. Phys. Chem. A, 101, 5526–5534, 1997. Griffith, D. W. T. and Jamie, I. M.: Fourier Transform Infrared
Spectrometry in Atmospheric and Trace Gas Analysis, in: En-cyclopedia of Analytical Chemistry, edited by: Meyers, R. A., 1979–2000, 2000.
Harwood, M. H., Burkholder, J. B., Hunter, M., Fox, R. W., and Ravishankara, A. R.: Absorption Cross Sections and Self-reaction Kinetics of the IO radical, J. Phys. Chem. A, 101, 853– 863, 1997.
Henry, B. R. and Hung, I.-F.: Mass Effects on the Applicability of local Mode Description of the High Energy Overtone Spectra of Difluoro-, Dichloro-, Dibromo- and Diiodomethane, Chem. Phys., 29, 465–475, 1978.
Himmelmann, S., Orphal, J., Bovensmann, H., Richter, A., Ladst¨atter-Weissenmayer, A., and Burrows, J. P.: First Observa-tion of the OIO Molecule by Time-resolved Flash Photolysis Ab-sorption Spectroscopy, Chem. Phys. Lett., 251, 330–334, 1996. Hoffmann, T., O’Dowd, C. D., and Seinfeld, J. H.: Iodine oxide
homogeneous Nucleation: An Explanation for Coastal New Par-ticle Production, Geophys. Res. Lett., 28(10), 1949–1952, 2001. Jimenez, J. L., Bahreini, R., Cocker III, D. R., Zhuang, H., Varut-bangkul, V., Flagan, R. C., Seinfeld, J. H., O’Dowd, C. D., and Hoffman, T.: New Particle Formation from Photooxidation of Diiodomethane, J. Geophys. Res. D, 108(D10), 4318–4343, 2003.
Johnson, T. J., Roberts, B. A., and Kelly, J. F.: Semiactive Infrared Remote Sensing: A Practical Prototype and Field Comparison, Appl. Opt., 43(3), 638–650, 2004.
Johnson, T. J., Wienhold, F. G., Burrows, J. P., and Harris, G. W.: Frequency Modulation Spectroscopy at 1.3 µm Using InGaAsP Lasers: A Prototype Field Instrument for Atmospheric Chem-istry Research, Appl. Opt., 30, 407–413, 1991a.
Johnson, T. J., Wienhold, F. G., Burrows, J. P., Harris, G. W., and
Burkhard, H.: Measurements of Line Strengths in the HO2ν1
Overtone Band at 1.5 µm Using an InGaAsP Laser, J. Phys. Chem., 95, 6499–6502, 1991b.
Johnson, T. J., Valentine, N. B., and Sharpe, S. W.:
Mid-infrared versus Far-Mid-infrared (THz) Relative Intensities of Room-temperature Bacillus spores, Chem. Phys. Lett., 403, 152–157, 2005.
Johnson, T. J., Sams, R. L., Blake, T. A., Sharpe, S. W., and Chu, P. M.: Removing Aperture-Induced Artifacts from FTIR Intensity Values, Appl. Opt., 41, 2831–2839, 2002.
Johnson, T. J., Disselkamp, R. S., Su, Y.-F., Fellows, R. J.,
Alexan-der, M. L. and Driver, C. L.: Gas-phase Hydrolysis of SOCl2:
Implications for Its Atmospheric Fate, J. Phys. Chem. A, 107, 6183–6190, 2003.
Kasper, J. V. V., Parker, J. H., and Pimentel, G. C.: Atomic Io-dine Photodissociation Laser, Appl. Phys. Lett., 5(11), 231–233, 1964.
Kasper, J. V. V., Parker J. H., and Pimentel, G. C.: Iodine-Atom Laser Emission in Alkyl Iodine Photolysis, J. Chem. Phys., 43, 1827–1828, 1965.
Kendall, R. A., Apra, E., Bernholdt, D. E., Bylaska, E. J., Dupuis, M., Fann, G. I., Harrison, R. J., Ju, J., Nichols, J. A., Nieplocha, J., Straatsma, T. P., Windus, T. L., and Wong, A. T.: High Perfor-mance Computational Chemistry: An Overview of NWChem, a Distributed Parallel Application, Computer Phys. Comm., 128, 260–283, 2000.
Kolb, C. E.: Iodine’s Air of Importance, Nature, 417, 597–598, 2002.
Kroger, P. M., Demou, P. C., and Riley, S. J.: Polyhalide Photofrag-ment Spectra. I. Two-photon Two-step Photodissociation of Methylene Iodide, J. Chem. Phys., 65(5), 1823–1834, 1976. M¨akel¨a, J. M., Hoffmann, T., Holzke, C., V¨akev¨a, M., Suni, T.,
Mat-tila, T., Aalto, P. P., Tapper, U., Kauppinen, E. I., and O’Dowd, C. D.: Biogenic Iodine Emissions and Identification of End-products in Coastal Ultrafine Particles during Nucleation Bursts, J. Geophys. Res., 107(D19), 8110–8124, 2002.
Maki, A., Blake, T. A., Sams, R. L., Vulpanovici, N., Barber, J., Chrysostom, E. T. H., Masiello, T., Nibler, J. W., and Weber, A.:
High Resolution Infrared Spectra of the ν2, ν3, ν4, and 2ν3bands
of32S16O3, J. Mol. Spectrosc., 210, 240–249, 2001.
Maki, A. G. and Wells, J. S.: Wavenumber Calibration Tables from Heterodyne Frequency Measurements, NIST Special Publication 821, National Institute of Standards and Technology, U.S. Gov-ernment Printing Office, Washington, D.C., 1991.
Marshall, P., Srinivas, G. N., and Schwartz, M.: A Computa-tional Study of the Thermochemistry of Bromine- and Iodine-Containing Methanes and Methyl Radicals, J. Phys. Chem. A, 109, 6371, 2005.
Masiello, T., Maki, A., and Blake, T. A.: The High-resolution
In-frared Spectrum of11BF3from 400 to 1650 cm−1, J. Mol.
Spec-trosc., 234, 122–136, 2005.
McFiggans, G., Coe, H., Burgess, R., Allen, J., Cubison, M., Al-farra, M. R., Saunders, R., Saiz-Lopez, A., Plane, J. M. C., Wevill, D. J., Carpenter, L. J., Rickard, A. R., and Monks, P. S.: Direct Evidence for Coastal Iodine Particles from Laminaria Macroalgae – Linkage to Emissions of Molecular Iodine, Atmos. Chem. Phys. 4, 701–713, 2004.
Mertz, L.: Auxiliary Computation for Fourier Spectrometry, Infr. Phys., 7, 17, 1967.
Orphal, J. and Ibrahim, N.: The ν1 and ν6 Bands of
Di-iodomethane, CH2I2, around 3.3. Microns Studied by
High-Resolution Fourier-Transform Spectroscopy, in: 19th Collo-quium on High Resolution Molecular Spectroscopy, Salamanca, Spain, 11–16 September 2005.
Platt, U.: Differential Optical Absorption Spectroscopy, in: Mon-itoring by Spectroscopic Techniques, edited by: Sigrist, M. W., chapter 2, 27–84, Wiley & Sons, New York, 1994.
Platt, U., Perner, D., Harris, G. W., Winer, A. M., and Pitts, J. N.: Observations of Nitrous Acid in an Urban Atmosphere by Dif-ferential Optical-Absorption, Nature, 285, 312–314, 1980. Richter, D., Fried, A., Wert, B. P., Walega, J. G., and Tittel, F. K.:
Development of a Tunable mid-IR Difference Frequency Laser Source for Highly Sensitive Airborne Trace Gas Detection, Appl. Phys. B, 75, 281–288, 2002.
Rothman, L. S., Jacquemart, D., Barbe, A., Brenner, D. C., et al.: The HITRAN 2004 Molecular Spectroscopic Database, J. Quant. Spectrosc. Rad. Transf., 96, 139–204, 2005.
Rowley, D. M., Bloss, W. J., Cox, R. A., and Jones, R. L.: Kinetics and Products of the IO+BrO Reaction, J. Phys. Chem. A, 105, 7855–7864, 2001.
Schiller, C. L., Locquiao, S., Johnson, T. J., and Harris, G. W.: At-mospheric Measurements of HONO by Tunable Diode Laser Ab-sorption Spectroscopy, J. Atmos. Chem., 40, 275–293, 2001. Schmitt, G. and Comes, F. J.: Spectroscopic Investigations of the
Photolysis of Diiodomethane, J. Mol. Struct., 61, 51–54, 1980. Sharpe, S. W., Kelly, J. F., Hartman, J. S., Gmachl, C., Capasso,
High-resolution (Doppler-limited) Spectroscopy Using Quantum-cascade Distributed-feedback Lasers, Opt. Lett., 23(17), 1396– 1398, 1998.
Sharpe, S. W., Johnson, T. J., Chu, P. M., Kleimeyer, J., and Row-land, B.: Quantitative Infrared Spectra of Vapor Phase Chemical Agents, SPIE Proceedings, 5058, 19–27, 2003.
Sharpe, S. W., Johnson, T. J., Sams, R. L., Chu, P. M., Rhoderick, G. C., and Johnson, P. A.: Gas-phase Databases for Quantitative Infrared Spectroscopy, Appl. Spectr., 58(12), 1452–1461, 2004. Solomon, S., Garcia, R. R., and Ravishankara, A. R.: On the Role of
Iodine in Ozone Depletion, J. Geophys. Res., 99(D10), 20 491– 20 499, 1994.
Tucceri, M. E., H¨olscher, D., Rodriguez, A., Dillon, T. J., and Crow-ley, J. N.: Absorption cross section and photolysis of OIO, Phys. Chem. Chem. Phys., 8, 834–846, 2006.
Voelz, F. L., Cleveland, F., Meister, A. G., and Bernstein, R. B.: Substituted Methanes. XVII: Vibrational Spectra, Poten-tial Constants, and Calculated Thermodynamic Properties of Di-iodomethane, J. Opt. Soc. Am., 43, 1061–1064, 1953.
Vogt, R., Sander, R., von Glasow, R., and Crutzen, P. J.: Iodine Chemistry and Its Role in Halogen Activation and Ozone Loss in the Marine Boundary Layer, J. Atmos. Chem., 32, 375–395, 1999.
Volkamer, R., Molina, L. T., Molina, M. J., Shirley, T., and Brune, W. H.: DOAS Measurement of Glyoxal as an Indicator for Fast VOC Chemistry in Urban Air, Geophys. Res. Lett., 32, L08806, doi:10.1029/2005GL022616, 2005.
Warneck, P.: Chemistry of the Natural Atmosphere, p. 146 ff. Aca-demic Press, San Diego, 1988.
Werle, P. W., Mazzinghi, P., D’Amato, F., De Rosa, M., Maurer, K., and Slemr, F.: Signal Processing and Calibration Procedures for in situ Diode-laser Absorption Spectroscopy, Spectrochimica Acta A, 60, 1685–1705, 2004.
Wert, B. P., Fried, A., Rauenbuehler, S., Walega, J., and Henry, B.: Design and Performance of a Tunable Diode Laser Absorp-tion Spectrometer for Airborne Formaldehyde Measurements, J. Geophys. Res., 108(D12), 4350–4362, 2003.
Wevill, D. J. and Carpenter, L. J.: Automated Measurement and Calibration of Reactive Volatile Halogenated Organic Com-pounds in the Atmosphere, Analyst, 129, 634–638, 2004. Williams, S. D., Johnson, T. J., Gibbons, T. P., and Kitchens, C.
L.: Relative Raman Intensities in C6H6, C6D6, and C6F6: a
Comparison of Different Computational Methods, Theo. Chem. Acc., in press, 2006.
Yaws, C. L.: Chemical Properties Handbook, McGraw-Hill, New York, 1999.