HAL Id: hal-02489788
https://hal.archives-ouvertes.fr/hal-02489788
Submitted on 25 Feb 2020
HAL is a multi-disciplinary open access
archive for the deposit and dissemination of
sci-entific research documents, whether they are
pub-lished or not. The documents may come from
teaching and research institutions in France or
abroad, or from public or private research centers.
L’archive ouverte pluridisciplinaire HAL, est
destinée au dépôt et à la diffusion de documents
scientifiques de niveau recherche, publiés ou non,
émanant des établissements d’enseignement et de
recherche français ou étrangers, des laboratoires
publics ou privés.
triple negative breast cancer
Elodie Jouberton, Sébastien Schmitt, Emmanuel Chautard, Aurélie
Maisonial-Besset, Marie Roy, Nina Radosevic-Robin, Jean-Michel Chezal,
Elisabeth Miot-Noirault, Yann Bouvet, Florent Cachin
To cite this version:
Elodie Jouberton, Sébastien Schmitt, Emmanuel Chautard, Aurélie Maisonial-Besset, Marie Roy,
et al.. [18F]ML-10 PET imaging fails to assess early response to neoadjuvant chemotherapy in a
preclinical model of triple negative breast cancer. EJNMMI Research, SpringerOpen, 2020, 10 (1),
pp.2. �10.1186/s13550-019-0587-5�. �hal-02489788�
O R I G I N A L R E S E A R C H
Open Access
[
18
F]ML-10 PET imaging fails to assess early
response to neoadjuvant chemotherapy in
a preclinical model of triple negative breast
cancer
Elodie Jouberton
1,3,4, Sébastien Schmitt
3, Emmanuel Chautard
2,3, Aurélie Maisonial-Besset
3, Marie Roy
3,
Nina Radosevic-Robin
2,3, Jean-Michel Chezal
3, Elisabeth Miot-Noirault
3, Yann Bouvet
4and Florent Cachin
1,3,5*Abstract
Purpose: Pathological complete response to the neoadjuvant therapy (NAT) for triple negative breast cancer (TNBC) is predictive of prolonged patient survival. Methods for early evaluation of NAT efficiency are still needed, in order to rapidly adjust the therapeutic strategy in case of initial non-response. One option for this is molecular imaging of apoptosis induced by chemotherapy. Therefore, we investigated the capacity of [18F]ML-10 PET imaging, an apoptosis radiotracer, to detect tumor cell apoptosis and early predict the therapeutic response of human TNBC. Results: Initially, the induction of apoptosis by different therapies was quantified. We confirmed, in vitro, that paclitaxel or epirubicin, the fundamental cytotoxic drugs for breast cancer, induce apoptosis in TNBC cell lines. Exposure of TNBC models MDA-MB-231 and MDA-MB-468 to these drugs induced a significant increase (p < 0.01) of the apoptotic hallmarks: DNA fragmentation, membrane phospholipid scrambling, and PARP activation. Secondarily, apoptotic fraction was compared to the intracellular accumulation of the radiotracer. [18F]ML-10 accumulated in the apoptotic cells after 72 h of treatment by paclitaxel in vitro; this accumulation positively correlated with the apoptotic fraction. In vivo, [18F]ML-10 was rapidly cleared from the nontarget organs and mainly eliminated by the kidneys. Comparison of the in vivo [18F]FDG, [18F]FMISO, and [18F]ML-10 uptakes revealed that the tumor accumulation of [18F]ML-10 was directly related to the tumor hypoxia level. Finally, after the in vivo
treatment of TNBC murine xenografts by paclitaxel, apoptosis was well induced, as demonstrated by the cleaved caspase-3 levels; however, no significant increase of [18F]ML-10 accumulation in the tumors was observed, either on day 3 or day 6 after the end of the treatment.
Conclusions: These results highlighted that PET imaging using [18F]ML-10 allows the visualization of apoptotic cells in TNBC models. Nevertheless, the increase of the chemotherapy-induced apoptotic response when using paclitaxel could not be assessed using this radiotracer in our mouse model.
Keywords: [18F]ML-10, apoptosis, PET imaging, triple negative breast cancer, in vivo, chemotherapy
© The Author(s). 2020 Open Access This article is distributed under the terms of the Creative Commons Attribution 4.0 International License (http://creativecommons.org/licenses/by/4.0/), which permits unrestricted use, distribution, and reproduction in any medium, provided you give appropriate credit to the original author(s) and the source, provide a link to the Creative Commons license, and indicate if changes were made.
* Correspondence:florent.cachin@clermont.unicancer.fr
1
Service de Médecine Nucléaire, Centre Jean Perrin, Clermont-Ferrand, France
3Université Clermont Auvergne, INSERM, Imagerie Moléculaire et Stratégies
Théranostiques, UMR1240, Clermont-Ferrand, France
Background
Triple negative breast cancer (TNBC) is an aggressive dis-ease that accounts for 15–20% of breast cancers and af-fects mainly young women [1]. This pathology is called “triple negative” due to the absence or very low expression of hormone receptors (for estrogen and for progesterone) by tumor cells, associated with a lack of amplification of the HER2 gene (ERBB2), all three biomarkers being the cornerstones of breast cancer therapy. Standard treatment of TNBC is currently based on neoadjuvant chemotherapy (NAT) using the FEC-taxane regimens. Pathological complete response (pCR) to NAT is associated with better overall survival [2]. One of the most important challenges in TNBC management is to develop more effective NAT, to allow for stronger early reduction of tumor mass, which prevents the appearance of sub-resistant clones respon-sible for metastatic disease [3,4].
In such context, molecular imaging using 2-deoxy-2-[18F]fluoro-D-glucose ([18F]FDG) has been recently pro-posed for early assessment of the final TNBC response to NAT. Groheux et al. have demonstrated, in 78 TNBC pa-tients, that the reduction of the [18F]FDG uptake (ΔSUV-max), assessed by positron emission tomography (PET) performed after only two cycles of NAT, highly correlates to pCR. However, in a recent meta-analysis which included 920 patients with breast cancers from 19 studies, the sensi-tivity and specificity of [18F]FDG PET/CT in predicting pCR were respectively of 84% and 66% [5, 6]. In around 20% of metastatic breast cancer patients, early recurrences have been reported in spite of treatment-induced total re-duction of [18F]FDG uptake in the metastatic deposits. Nu-merous reasons for the [18F]FDG false negativity (FN) or positivity (FP) have been described, like incapacity to detect cancer cells in low number or with low glucose metabolism (FN), turn-off of glycolysis without subsequent cell death (FN) or presence of intense inflammatory infiltrate with high metabolism (FP) [7,8]. Consequently, combination of the data collected by two different types of PET imaging tools, those that allow metabolic activity profiling and those that allow therapy-induced cell death assessment, would be of interest for predicting early response to NAT.
Apoptosis, known as the main type of chemotherapy-induced cell death, has been studied mainly over the past two decades using various microscopic and macro-scopic imaging modalities [9,10]. Monitoring apoptosis during treatment in the whole tumor is nowadays possible with the emergence of new nuclear imaging techniques. Several radiotracers have been developed to measure apoptosis in vivo such as phosphatidylserine (PS) exposure (annexin V radiolabeled with technetium-99m or fluorine-18), activation of caspases (isatins derivatives radiolabeled with fluorine-18) or mitochondrial outer membrane permeabilization ([18F]fluorobenzyl triphenyl-phosphonium cation) [11–13]. Among these radiolabeled
compounds, [99mTc]hydrazinonicotinamide-annexin V ([99mTc]HYNIC-annexin V) has been used for clinical sin-gle photon emission computed tomography (SPECT) im-aging of response to treatment of many solid tumors [14,
15]. The results of these clinical trials have revealed a strong affinity of the radiotracer for PS, and a correl-ation between the tumor radiotracer uptake and the number of dying cells. In another study, patients with malignant lymphoma, leukemia, non-small cell lung carcinoma, or head and neck squamous cell carcin-oma were enrolled in a clinical trial to follow their therapeutic response with [99mTc]HYNIC-annexin V [16]. An increase of [99mTc]HYNIC-annexin V tumor uptake after therapy correlated with clinical outcome. However, even if this radiotracer holds promise for future nuclear imaging of apoptosis, it is currently not used in clinical routine due the difficulty to dis-criminate apoptotic from necrotic cells [17].
Recently, pre-clinical experiments and clinical trials have been conducted using the 2-(5-[18 F]fluoropentyl)-2-methylmalonic acid ([18F]ML-10), an apoptosis pH-sensitive radiotracer developed by ApoSense Ltd. (Petach-Tikva, Israel). These studies have demonstrated the ability of this small molecule (206 Da) to specifically target apoptotic cells, while being excluded from viable or necrotic cells [18].
The [18F]ML-10 radiotracer is highly stable in vivo and presents a rapid clearance from non-targeted organs and a favorable dosimetry profile [19]. Several clinical trials have recently evaluated [18F]ML-10 for early detection of response to radiation therapy in patients with brain me-tastases [20, 21]. In those studies, early treatment-induced changes in the [18F]ML-10 tumor accumulation were measured by voxel-based analysis and correlated with changes in anatomical dimensions, as visualized with magnetic resonance imaging (MRI). The authors confirmed the value of PET imaging with [18F]ML-10 for early assessment of tumor response to therapy as well as the potential of this radiotracer to visualize apop-tosis. In addition, studies in two types of solid tumors (nasopharyngeal carcinoma and head/neck carcinoma) have also highlighted the capacity of the [18F]ML-10 ra-diotracer to target apoptotic cells following cancer chemotherapy [22,23]. However, no pre-clinical or clin-ical studies have been conducted in TNBC models.
In this study, we first investigated the induction of apoptosis by drugs currently used in NAT (paclitaxel, epirubicin) on in vitro and in vivo TNBC models. Apop-tosis was evaluated by multiple strategies including west-ern blotting and flow cytometry. We then explored the capacity of [18F]ML-10 to target apoptosis in TNBC models. We applied longitudinal PET imaging to moni-tor the dynamics of apoptotis induced by paclitaxel. The input of [18F]ML-10 imaging to classical [18F]FDG and
[18F]FMISO PET imaging was also assessed. As [18F]ML-10 is a pH-sensitive molecule, the impact of extracellular pH variation on radiotracer uptake was fi-nally evaluated.
Methods
TNBC cell lines and culture
Human epithelial breast cancer cell lines, MDA-MB-231 (ATCC® HTB-126) and MDA-MB-468 (ATCC® HTB-132™), were purchased from American Type Culture Collection (ATCC, Manassas, USA) and cultured in Eagle’s MEM medium (Gibco®) supplemented with 1 mML-glutamine, 1 mM sodium pyruvate, 1 mM non-essential amino acids, 4 μg/mL gentamycin and 10% fetal calf serum (Dutscher, Brumath, France). Cells were maintained at 37 °C in a hu-midified atmosphere containing 5% CO2.
[18F]ML-10 uptake assay of TNBC cell lines treated by paclitaxel
After induction of apoptosis by paclitaxel treatment, cells were incubated with 0.37 MBq of [18F]ML-10 for 15 min in Hank’s Balanced Salt Solution (HBSS, Gibco®) supplemented with 10 mM HEPES buffer at 37 °C. The [18F]ML-10 uptake was terminated by three cycles of washing with the HBSS-HEPES mixture, followed by centrifugation. Cell pellets were recovered, and radio-activity was measured using a gamma counter (Wizard 1480, Perkin Elmer). The cellular uptake was presented as the radioactivity amount per 106cells (MBq/106cells). [18F]ML-10 uptake was correlated with the apoptotic hallmarks of annexin-V binding.
To induce pH variations, cells treated and untreated were centrifuged and re-suspended in HBSS-HEPES, buffered at different pH values, ranging from 5.9 to 8.0.
Animal model
All animal studies were conducted in accordance with the Guide for the Care and Use of Laboratory Animals published by the US National Institutes of Health (NIH Publication n°85–23, revised 1996) and with the relevant guidelines and regulations approved by both the local Ethic Committee of Clermont-Ferrand (France) and the French Ministry of Education and Research (approval n°18284-2018122716575316). One hundred and ten fe-male NMRI Nude (Crl: NMRI-Foxn1nu) mice of 6–7 weeks old were purchased from Janvier Laboratory (Le Genest-Saint-Isle, France) and housed under environ-mentally controlled conditions with free access to stand-ard food and water. Tumor xenografts were induced by subcutaneous injection, into the right front leg of the mice, of 106cells suspended in 75μL of PBS. Orthotopic implantation was performed by inoculating 105cells sus-pended in 25 μL of PBS into the second thoracic mam-mary fat pad. Tumor volumes were determined by using
the following formula: TV (mm3) = [length × (width)2]/ 2. Variation change in tumor volume was calculated by using the following formula: Δ tumor volume (%) = [(TVdx− TVd0)/TVd0] × 100 with dx representing day of
acquisition PET and d0 representing acquisition before treatment.
PET imaging experiments with [18F]ML-10, [18F]FMISO, and [18F]FDG
Images focused on the tumor were performed using a small-animal PET device (eXplore VISTA; GE Health-care). Mice were anesthetized with 1.5–2% isoflurane/ oxygen (1 L/min) and maintained during image acquisi-tion. Dynamic PET imaging was performed immediately (0–1 min) after i.v. injection of 22–30 MBq of [18
F]ML-10. List mode data were collected for 45 min and per-formed 4 weeks after tumor implantation for MDA-MB-468 xenografts and 3 weeks for MDA-MB-231 xeno-grafts. Static PET imaging, focused on the tumor, was performed at 30 min ([18F]ML-10), 1 h ([18F]FDG), and 4 h ([18F]FMISO) after i.v. injection of 11–18 MBq of the corresponding radiotracers. Each acquisition lasted 15 min. In addition, mice receiving [18F]FDG were fasted 12 h before radiotracer injection. The energy window used was 250–700 keV and the spatial resolution of this system was 1.4 mm. Images were reconstructed according to the OSEM 2D algorithm including corrections for scan-ner dead time, scattered radiations, and randoms but no correction of attenuation. Regions of interest were drawn on images of the tumor and the kidneys, liver, heart, and muscle of the contralateral paw, at each imaging time. Time-activity curves were presented as a mean of standard uptake value (%DI/g). For tumor analysis, the max and mean of standard uptake value (SUVmax and SUVmean) were measured and tumor/muscle ratios were calculated. For studies concerning the correlation between radio-tracer accumulations, the same mice were imaged with the three radiotracers at 1-day intervals.
After PET imaging protocols, at 60 min post-injection of [18F]ML10, urine was collected and the percentage of unchanged [18F]ML-10 radiotracer was determined by analytical radio-HPLC and radio-TLC as described in Additional file1.
Study design for assessment of early therapeutic response to NAT
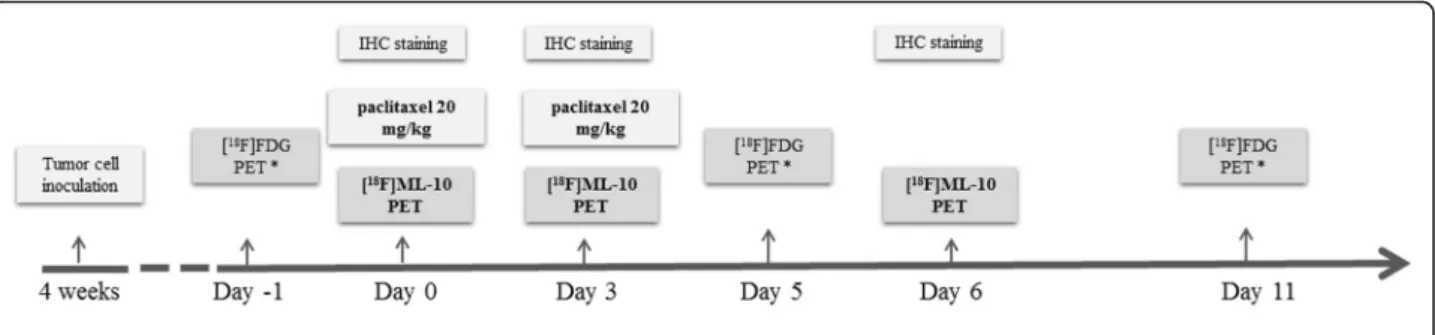
When tumors have reached an average volume of 50 ± 16 mm3, the mice were randomized in two groups. One group was injected of 0.9% NaCl (control group), and another group was given a therapeutic protocol that consisted of two paclitaxel doses (20 mg/kg), at a 72-h interval, injected via the tail vein. Treatment was per-formed at day 0 (d0), after baseline [18F]ML-10 PET (Fig.1). Subsequent [18F]ML-10 PETs were performed at
d0, d3, and d6 post-treatment. Sequential [18F]FDG PETs were performed 1 day before treatment (d-1) and after treatment (d5 and d11) only for the MDA-MB-468 subcutaneous model. In a parallel experiment, two groups of 18 mice were considered for apoptosis evalu-ation by immunofluorescence for cleaved caspase-3.
Statistical analysis
All values were presented as the mean ± standard devi-ation (SD) and were statistically analyzed with GraphPad Prism (version 5.0 GraphPad Software, Inc., San Diego, CA). Each parameter in vitro was compared between un-treated and un-treated groups by the Mann-Whitney test. Pearson correlation analyses were performed to assess the correlation between the [18F]ML-10 uptake and the percentage of apoptotic cells or extracellular pH. Each parameter in vivo was compared between control and paclitaxel groups by the Mann-Whitney test. Pearson correlation analyses were performed to assess the correl-ation between the [18F]ML-10 SUVmean and tumor vol-ume or to compare radiotracers SUVmean. For each radiotracer, Pearson correlation analyses were performed to assess the correlation between the SUVmean and SUVmax.p was considered statistically significant, when < 0.05 (*p < 0.05, **p < 0.01, ***p < 0.001).
For more details about assessment of apoptosis and radiosyntheses of [18F]ML-10, [18F]FDG, and [18F]FMISO, see Additional file1.
Results
Epirubicin and paclitaxel induce apoptosis in TNBC cell lines
Cytotoxic activity of epirubicin and paclitaxel was first evaluated in two TNBC cell lines. IC50 values of
pacli-taxel and epirubicin were, respectively 3.5, ± 0.5, and 25 ± 0.02 nM for MDA-MB-468 cells, and 0.02 ± 0.01μM and 1.54 ± 0.02μM for MDA-MB-231 cells (Table1).
Apoptosis was induced in the two human TNBC cell lines by treatment with paclitaxel or epirubicin at a 10-fold IC50 dose. Under treatments, blended
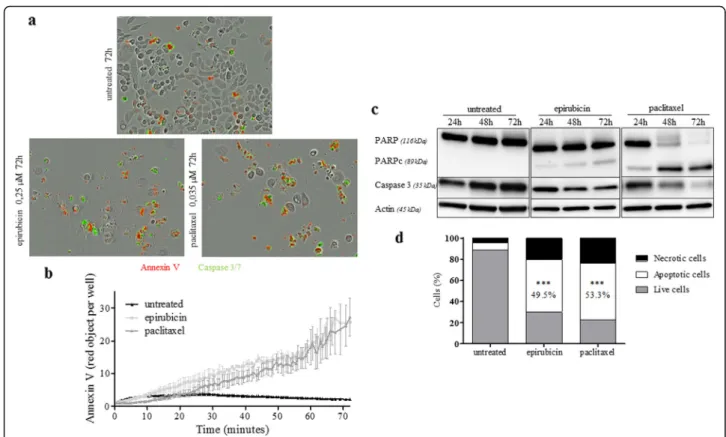
phase-contrast and red/green images showed an increase of annexin V and cleaved caspase 3/7 expression in the treated cells compared to the untreated cells (Fig. 2). Real-time quantification of the annexin V revealed an in-crease of apoptosis in the treated cells compared to the untreated cells at 72 h post-treatment: 2.8 ± 3.1 red ob-jects per well for control, and 23.8 ± 2.4 and 21.4 ± 3.7 red objects per well for epirubicin and paclitaxel-treated cells respectively. Western blotting analysis performed at 24, 48, and 72 h post-treatment showed a decrease of caspase 3 and an increase of cleaved PARP expression at the end of each post-treatment interval, with a peak at 72 h. An increase of apoptotic cell number was con-firmed by flow cytometry, 72 h after treatment by epiru-bicin (32.9 ± 1.2%) or paclitaxel (28.6 ± 7.9%) compared to untreated cells (3.3 ± 1.9%) (Table2and3).
MDA-MB-468 cells presented more staining in un-treated cells compared to MDA-MB-231, as seen on the real-time image (Fig.3). These findings were confirmed by western blotting analysis performed at 24, 48, and 72 h. We also observed a decrease of caspase 3 and an in-crease of cleaved PARP abundance, with a peak at 72 h post-treatment. Moreover, flow cytometry studies showed a higher percentage of apoptotic cells after 72 h of treatment (49.5 ± 1.2% for epirubicin, 53.3% ± 4.2% for paclitaxel) than in the untreated cells (6.8 ± 1.1%) (Table2and3).
Thus, these two cell lines showed different response to treatments, with the biggest apoptotic fraction induced in the MDA-MB-468 cells treated by paclitaxel. There-fore, those cells were used in the radiotracer uptake studies.
Fig. 1 Study design with small-animal PET imaging of a murine breast tumor model by subcutaneous or orthotopic implantation. IHC indicates immunohistochemical and PET indicates positron emission tomography acquisition
Table 1 IC50(μM) values for MDA-MB-468 and MDA-MB-231 cell culture. Results are shown as mean ± SD. (n = 3 independent experiments)
Cell lines MDA-MB-231 MDA-MB-468 Epirubicin 1.54 ± 0.02 0.025 ± 0.0002 Paclitaxel 0.02 ± 0.007 0.0035 ± 0.0005
Paclitaxel induces apoptosis in murine xenografts of TNBC cell lines
First, we characterized the induction of apoptosis in a MDA-MB-468 subcutaneously xenograft model at 24, 48, and 72 h after the injection of one dose of paclitaxel at 20 mg/kg. Western blotting analysis evidenced a decrease of caspase 3 and an increase of cleaved PARP from 24 h with a maximum at 72 h (p = 0.1 at 72 h; Fig.4a–b). Then, we characterized
apoptosis after two doses of 20 mg/kg paclitaxel at a 72-h
interval and observed a decrease of caspase 3 as well as a sig-nificant increase of cleaved PARP to control (p = 0.028) and to the one dose group (p = 0.028; Fig.4c, d).
To confirm the specificity of labeling of apoptotic cells, we analyzed the percentage of cleaved caspase 3 cells by flow cytometry. As shown in Fig.4e, f, cleaved caspase 3 in the paclitaxel-treated tumors (72.4% ± 6.7%) was sig-nificantly higher than in the control group (27.0% ± 10.0%;p = 0.019).
Table 2 Apoptosis analysis of 231(a) and MDA-MB-468(b) cells after incubation with treatment at 10xIC50for 24 h, 48 h, and 72 h by flow cytometry using Annexin V/PI apoptosis assay. Results are shown as mean ± SD (n = 3 independent experiments)
MDA-MB-231
Untreated Epirubicin Paclitaxel
24 h 48 h 72 h 72 h 24 h 48 h 72 h Live cells (%) 93.8 ± 2.5 94.5 ± 1.7 94.7 ± 2.2 2.6 ± 1.3 71.8 ± 6.8 59.9 ± 8.0 50.7 ± 13.3 Apoptotic cells (%) 3.3 ± 1.9 3.4 ± 0.4 2.0 ± 0.9 32.9 ± 1.2 10.5 ± 2.0 18.6 ± 2.5 28.6 ± 7.9 Necrotic cells (%) 2.9 ± 0.9 5.1 ± 1.4 3.2 ± 1.3 64.4 ± 1.7 23.7 ± 1.6 21.5 ± 6.6 20.7 ± 6.2
Table 3 Apoptosis analysis of 231(a) and MDA-MB-468(b) cells after incubation with treatment at 10xIC50for 24 h, 48 h, and 72 h by flow cytometry using Annexin V/PI apoptosis assay. Results are shown as mean ± SD (n = 3 independent experiments)
MDA-MB-468
Untreated Epirubicin Paclitaxel
24 h 48 h 72 h 72 h 24 h 48 h 72 h Live cells (%) 88.7 ± 1.4 83.3 ± 2.4 83.8 ± 2.3 30.1 ± 0.9 67.6 ± 2.5 45.3 ± 3.2 23.0 ± 1.6 Apoptotic cells (%) 6.8 ± 1.1 8.6 ± 2.3 8.8 ±0.7 49.5 ± 1.2 23.6 ± 1.5 38.8 ± 2.8 53.3 ± 4.2 Necrotic cells (%) 4.5 ± 1.6 8.1 ± 3.0 7.3 ± 2.7 20.4 ± 0.3 8.8 ± 2.0 15.9 ± 3.7 23.8 ± 4.3
Fig. 2 Apoptotic induction after treatment by epirubicin or paclitaxel in MB-231 cells. a Time-lapse images detection of apoptosis in MDA-MB-231 cells in the presence of Caspase-3/7 Green Apoptosis reagent and Annexin V Red Reagent. b Percent of apoptotic cells with high annexin V reagent was assessed in time-lapse imaging (IncuCyte) over 72 h. c Western blot analysis showing the cleavage of PARP and Caspase 3 decrease. Actin was used as a loading control. d Quantitative analysis of apoptotic cells measured by flow cytometry in untreated, epirubicin-treated, or paclitaxel-treated MDA-MB-231 cells for 72 h. (n = 3 independent experiments; mean ± SD). Compared to untreated, ***p < 0.001 (Mann-Whitney test)
[18F]ML-10 accumulates in the apoptotic TNBC cells in vitro
Experiments were carried out in adherent cells (which contain the apoptotic cells and viable cells), after 72 h of treatment by 0.035 μM of paclitaxel only. [18F]ML-10 uptake increased from 0.8 ± 0.4% and 0.8 ± 0.3% at the baseline to 2.9 ± 0.8% and 4.1 ± 1.5% at 72-h post-treatment, respectively for MB-231 and MDA-MB-468 cells. [18F]ML-10 uptake was 3.6 and 5.2 times higher in the treated cells compared to the untreated cells, in MDA-MB-231 and MDA-MB-468 respectively (p < 0.001; Fig.5a).
Furthermore, the sensitivity of the radiotracer [18F]ML-10 to detect apoptotic cells was evaluated by comparing the radiotracer uptake with the percentage of cells in apoptosis post-treatment (Fig. 5b). [18F]ML-10 uptake was 1.9 ± 0.4% at 24-h post-treatment (23.6% of apoptotic cells) and 2.9 ± 0.2% at 48-h post-treatment (38.8% of apoptotic cells) for MDA-MB-468 cells. [18F]ML-10 uptake increased with the apoptotic fraction (p = 0.006).
All together, these results demonstrated that [18 F]ML-10 detects cells in early apoptosis after paclitaxel-treatment in the TNBC cell lines investigated.
[18F]ML-10 is sensitive to extracellular pH variations
Scrambling processes in early apoptosis reduce the pH of the external membrane leaflet and cytoplasm (acidification). To reproduce this effect in vitro, the pH of the culture medium was modified to evaluate the impact of extracellular pH on the ability of [18F]ML-10 to bind the apoptotic cells. Studies were conducted only on MDA-MB-468 cells after 72 h of treatment at a 10-fold IC50 dose of paclitaxel and
in-cubation with [18F]ML-10 at pH 5.9 to 8.0. As shown in Fig. 5c, acidification of the medium increased the [18F]ML-10 uptake. At pH 8.0, the radiotracer uptake was only 60% of the uptake at neutral pH (7.0), whereas it was 100% higher at pH 6.0 than at the neutral pH. Consequently, the high dependence of the radiotracer uptake on the extracellular pH, in the physiological pH range, was confirmed.
Imaging biokinetics and high in vivo stability of [18 F]ML-10
For in vivo studies, we first evaluated the biokinetics of [18F]ML-10 in tumor-bearing mice with dynamic PET imaging. Average time-activity curves, for each xenograft models, revealed a rapid clearance of the
Fig. 3 Apoptotic induction after treatment by paclitaxel or epirubicin in 468 cells. a Time-lapse images detection of apoptosis in MDA-MB-468 cells in the presence of Caspase-3/7 Green Apoptosis reagent and Annexin V Red Reagent. b Percent of apoptotic cells with high annexin V reagent was assessed in time-lapse imaging (IncuCyte) over 72 h. c Western blot analysis showing the cleavage of PARP and Caspase 3. Actin was used as a loading control. d Quantitative analysis of apoptotic cells measured by flow cytometry in untreated, epirubicin-treated, or paclitaxel-treated MDA-MB-468 cells for 72 h. (n = 3 independent experiments; mean ± SD). Compared to untreated, ***p < 0.001 (Mann-Whitney test)
radiotracer from the nontarget organs, through renal excretion (29.2 ± 3.5 %IA/g at 3 min, 12.2 ± 3.7 %IA/g at 15 min, and 7.3 ± 0.3 %IA/g at 30 min) (Fig.6a). Analysis of urine samples, at 60 min after i.v. injection of [18 F]ML-10, did not reveal any radioactive metabolites as shown by radio-HPLC and radio-TLC analyses ( Additional file 1: Figure S1). These results suggested a high in vivo stability of this radiotracer.
After evaluation of the whole-body biokinetics, the potential of [18F]ML-10 for the assessment of tumor apoptosis in TNBC xenografts (Fig. 6b) was explored. As expected, the distribution of the radiotracer in muscle decreased over time and was 0.76 ± 0.3 %IA/g at 30 min. In both MDA-MB-468 xenograft models, the radiotracer uptake in tumor reached a plateau from 1 to 12 min post-injection (p.i.) and was then eliminated from the tumor. This plateau was not ob-served in the muscle or in the MDA-MB-231 xeno-graft model, which showed tumor accumulation of the radiotracer was similar to the muscle and vascular background activity, demonstrating that the accumula-tion in the tumor was non-specific.
[18F]ML-10 tumor accumulation correlates with the apoptotic fraction in TNBC xenografts
Among the three investigated models (Fig. 7a and Additional file 1: Table S1), significantly lower [18F]ML-10 uptake was detected in the MDA-MB-231 xenografts (SUVmean = 0.06 ± 0.03), compared to the MDA-MB-468 subcutaneous model (SUVmean = 0.12 ± 0.03; p < 0.001) and orthotopic model (SUV-mean = 0.15 ± 0.04; p < 0.001). The SUVmean of [18F]ML-10 positively correlated to the apoptotic tumor fraction determined by flow cytometry (Fig. 7b; p < 0.001). Interestingly, an increased [18
F]ML-10 up-take also positively correlated with tumor volume in the subcutaneous MDA-MB-231 (p = 0.002) and MDA-MB-468 (p = 0.02) models but not in the MDA-MB-468 orthotopic model (p = 0.987; Additional file 1: Figure S2). Compared to the MDA-MB-231, a basal apoptotic fraction of 27 ± 10 % was detected by [18F]ML-10 PET imaging in the MDA-MB-468 model. In view of these results, [18F]ML-10 was only compared with [18F]FMISO and [18F]FDG on MDA-MB-468 xenograft models.
Fig. 4 Characterization of apoptotic tumor after treatment by paclitaxel in MDA-MB-468 subcutaneously xenograft model. a–c Western blot analysis showing the cleavage of PARP and Caspase 3 on tumors samples. Actin was used as a loading control. Individual bands (M1, M2, M3) correspond to 2–3 independent tumor samples per group of treatment. b–d Quantification of cleaved PARP as a ratio to PARP. Data are presented as the mean ± SD. Mann-Whitney test was performed (*p < 0.05). Significant difference versus control group. e Increase of cleaved caspase 3-positive tumor cells was observed after paclitaxel treatment. f Quantitative analysis of apoptotic cells measured by flow cytometry in control or paclitaxel treated. Data are presented as the mean ± SD. Compared to control, ***p < 0.001 (Mann-Whitney test)
Comparison of in vivo [18F]FDG, [18F]FMISO, and [18 F]ML-10 uptake in a MDA-MB-468 model
Regarding the accumulation of the [18F]FDG, no differ-ence between the orthotopic and the subcutaneous MDA-MB-468 model was observed (p = 0.54; Fig. 7c and Additional file 1: Table S2). On the other side, the orthotopic model showed a greater [18F]FMISO uptake (SUVmean = 0.81 ± 0.26) than the subcutaneous model (SUVmean = 0.60 ± 0.18; p = 0.04). A correlation be-tween the [18F]ML-10 uptake and the level of hypoxia in the tumor, assessed by [18F]FMISO, was clearly evi-denced in both the subcutaneous (r = 0.88, p = 0.02) and orthotopic (r = 0.82, p = 0.01) MDA-MB-468 xeno-graft models (Fig.7d). No correlation was found between the accumulation of [18F]ML-10 and [18F]FDG in both xenograft models (Fig.7e).
[18F]ML-10 uptake, detected by PET imaging, doses not correlate with TNBC xenograft response to paclitaxel in subcutaneous model
After two doses at a 72-h interval of 20 mg/kg paclitaxel, the volume of tumor was measured at days 0, 6, 10, 14, and 18, to evaluate the evolution of the tumor volume (Fig. 8a). Tumors got significantly reduced after pacli-taxel treatment, from day 6 to the end of the study.
[18F]ML-10 PET images were acquired at days 0, 3, and 6. At the baseline, we showed the radiotracer accumula-tion in the untreated tumor cells was higher compared to the muscle with a significant difference (p < 0.001; Additional file 1: Table S3). At the three time points of PET imaging, muscle uptake remained stable. At day 3, PET imaging data in the mice treated with paclitaxel demonstrated that tumor uptake was stable compared to the control mice (Fig. 8b–d). At day 6, [18F]ML-10 up-take decreased in the treated tumors (0.07 ± 0.02) com-pared to the control group (0.16 ± 0.02; p = 0.003), while increased binding was expected since the ex vivo analyses confirmed increased level of cleaved caspase 3 in the treated tumors, at d6 (Fig.8c). However, [18 F]ML-10 tumor uptake in both groups was always higher than the vascular background. Nevertheless, we showed that the radiotracer uptake in untreated tumors increased over time with a significant difference between day 0 (0.10 ± 0.03) and day 6 (0.16 ± 0.02;p = 0.005). The cor-relation analysis revealed a strong link between SUV-mean and SUVmax ( Additional file1: Figure S3a).
[18F]FDG PET images were acquired 1 day before treatment induction and then at day 5 and day 11 after treatment. Paclitaxel treatment induced a decrease of the [18F]FDG uptake at day 5 and day 11 (Fig. 9a).
Fig. 5 [18F]ML-10 uptake. a [18F]ML-10 was added to the cell suspension containing adherent cells 72 h after paclitaxel and incubation for 15 min and its uptake was determined. Results are shown as mean ± SD (n = 3 independent experiments). Mann-Whitney test was performed (***p < 0.001). b Correlation between the percentage of apoptotic cells and [18F]ML-10 binding amount in paclitaxel-treated MDA-MB-468 cells. The percentage of cells in apoptosis was determined using Annexin V/PI staining and expressed as the proportion of Annexin V-positive cell counts in total counts. Pearson correlation was performed (**p < 0.01). c Effect of acidification on [18F]ML-10 uptake. pH dependence of [18F]ML-10 uptake, with an extracellular pH ranging from of 5.9 to 8.0.
[18F]FDG SUVmean were respectively 0.86 ± 0.04; 1.04 ± 0.03 in the treated group compared to controls 1.19 ± 0.12; 1.48 ± 0.13 (p = 0.036 at day 5 and day 11; Fig.9b; Additional file 1: Table S4). As expected, [18F]FDG tu-moral SUVmean increased overtime in the control group (1.3 ± 0.1 at 5 day and 1.5 ± 0.1 at day 11 ; p = 0.008). SUVmean and SUVmax were strongly correlated (p < 0.001; Fig.9c).
Orthotopic model does not improve the predictive value of the [18F]ML-10 for early assessment of therapeutic response
The MDA-MB-468 orthotopic xenografts and the sub-cutaneous model responded to paclitaxel by a significant decrease of tumor volume from day 3 to the end of the study. Nevertheless, in the control groups, a difference in tumor growth was observed (Fig. 10a). The doubling
Fig. 7 In vivo imaging analysis of baseline PET imaging. a SUVmean showing uptake of [18F]ML-10 in MDA-MB-231 subcutaneous xenograft
tumor, MDA-MB-468 subcutaneous xenograft tumor, and MDA-MB-468 orthotopic xenograft tumor and muscle. The Mann-Whitney test was performed (***p < 0.001). b Flow cytometric quantitation of cell apoptosis was compared with cell-associated radioactivity for [18F]ML-10. Pearson
correlation was performed (***p < 0.001). c SUVmean showing uptake of [18F]FDG, [18F]FMISO, and [18F]ML-10 in MDA-MB-468 subcutaneous or
orthotopic xenograft tumor. The Mann-Whitney test was performed (*p < 0.05, **p < 0.01, ***p < 0.001). Correlation SUVmean of [18F]FDG d or
[18F]FMISO e uptake in tumor with SUVmean of [18F]ML-10. Pearson correlation was performed (*p < 0.05)
Fig. 6 Time activity curves after bolus injection of 29.5 ± 4.1 MBq [18F]ML-10 of triple negative breast cancer models. a Time activity
curves showing uptake of [18F]ML-10 in the kidneys, liver, heart, and muscle over 45 min (n = 6). b Time-activity curves showing uptake
of [18F]ML-10 in muscle, MDA-MB-231 xenograft tumor (n = 3), MDA-MB-468 xenograft tumor (n = 3), and MDA-MB-468 orthotopic tumor
(n = 3) over 45 min. Radioactivity was expressed as a percentage of the injected activity per gram of tissue (%IA/g). Data are presented as mean ± SD
time of the subcutaneous model was 16.4 days com-pared to 9.55 days for control tumors implanted in the mammary fat pad. In the non-treated models, [18F]ML-10 PET imaging demonstrated similar tu-moral radiotracer accumulation irrespectively of the tumor location (Fig.10b–d). In spite of apoptosis
induc-tion by paclitaxel, as demonstrated by increased cleaved
caspase 3 expression in the treated tumors (Fig. 10c), no change in the radiotracer uptake was detected over the treatment time ( Additional file 1: Table S3). The SUV-mean and SUVmax values highly positively correlated (p < 0.0001; Additional file1: Figure S3b).
PET images generated from a dynamic PET experiment 45 min post injection confirmed a similar elimination of
Fig. 9. Evaluation of early response by [18F]FDG PET imaging on MDA-MB-468 subcutaneous model. a Images of [18F]FDG PET of representative
MDA-MB-468 subcutaneous xenograft model performed and day 5 and day 11 post-treatment. T represented Tumor. b [18F]FDG uptake expressed as
SUVmean in tumor control, tumor treated, and muscle before treatment and days 5 and 11 after treatment. Mann-Whitney test was performed (*p < 0.05). c Correlation between [18F]FDG uptake expressed by SUVmean and SUVmax. Pearson correlation was performed (***p < 0.001)
Fig. 8 Evaluation of early response by [18F]ML-10 PET imaging on subcutaneously model. a Evaluation of tumor volume after two i.v. injections of
paclitaxel (20 mg/kg) at a 72-h interval. Data are represented as mean ± SD. Compared to control, ***p < 0.001 (Mann-Whitney test). b Images of [18F]ML-10 PET of representative MDA-MB-468 subcutaneous xenograft model performed and 72-h post-treatment. T represented tumor and H
represented heart. c Representative image of cleaved caspase of tumor tissues. d [18F]ML-10 uptake expressed as SUVmean in tumor control,
the radiotracer in non-target organs and tumor through-out the course of treatment ( Additional file1: Figure S4).
Discussion
Therapeutic strategies for TNBC need new methods of assessment of the tumor response to therapy, which could be combined with the currently used [18F]FDG PET imaging. The ultimate aim of such approaches is to achieve early evaluation of TNBC response to NAT (after only one or two therapy cycles), and a rapid change of the therapeutic protocols in case of tumor re-sistance. To our knowledge, the present report is the first to show the results of the evaluation of18[F]ML-10, a proposed apoptosis radiotracer, as a tool for assess-ment of TNBC response to cytotoxic treatassess-ment in vitro and in vivo.
Following validation that paclitaxel induced apoptosis of TNBC cells in vitro, we showed that [18F]ML-10 up-take was increased, 72 h after treatment of MDA-MB-468 cells, and was associated with an increase of the apoptotic fraction. Furthermore, the high uptake was demonstrated in the adherent cells only (viable and early apoptotic) suggesting that the radiotracer is specific of early apoptosis, as previously proposed [18]. We did not confirm the absence of fixation of [18F]ML-10 to the
necrotic cells. However, this was largely demonstrated by several teams [18, 19, 22]. Our results show, for the first time, that [18F]ML-10 indeed targets TNBC cells in early apoptosis after paclitaxel treatment in vitro.
In vivo, [18F]ML-10 distribution results were compar-able to those obtained in humans with a very rapid clearance from non-target organs and a urinary elimin-ation [19, 24]. Compared to other radiotracers targeting apoptosis (radiolabeled annexin V and Caspase3 radiola-beled), [18F]ML-10 PET presented a rapid distribution due to its low molecular weight, which allowed early tumor imaging after intravenous administration. In addition, its urinary elimination favored a better visualization of peritoneal tumors [17, 25]. Selective [18F]ML-10 uptake into specific tumor cells was ob-served and was more important in the MDA-MB-468 xenograft models compared to the MDA-MB-231 model. This accumulation was correlated with the basal apoptotic fraction determined by flow cytometry. It is in-teresting to note that a relation between tumor volume and radiotracer uptake was demonstrated in subcutane-ous xenograft models but not in the orthotopic model. As already reported by several studies, the microenviron-ment of orthotopic implantation may be more favorable to tumor development [26].
Fig. 10 Evaluation of early response by [18F]ML-10 PET imaging on an orthotopic model. a Evaluation of tumor volume after two i.v. injections of paclitaxel (20 mg/kg) at a 72-h interval. Data are represented as mean ± SD. Compared to control, ***p < 0.001 (Mann-Whitney test). b Images of [18F]ML-10 PET of representative MDA-MB-468 orthotopic xenograft model performed and 72-h post-treatment. T represented tumor. c Representative image of cleaved caspase of tumor tissues. d [18F]ML-10 uptake expressed as SUVmean in tumor control, tumor treated and muscle at day 0, day 3, and day 6. Mann-Whitney test was performed (*p < 0.05)
In a second time, we performed the evaluation of early response to paclitaxel by [18F]ML-10 and [18F]FDG PET imaging on MDA-MB-468 xenograft models. The induc-tion of apoptosis did not significantly correlate with the increase in [18F]-ML-10 uptake in the tumors. However, the [18F]FDG uptake reflected the decrease of tumor me-tabolism during the treatment. Similar findings were re-ported by other teams evaluating the early response with [18F]ML-10 in lymphoma model treated by cyclophos-phamide [27].
Several hypotheses can explain the absence of cor-relation between [18F]ML-10 PET imaging and the early TNBC apoptosis, after exposure to chemother-apy. First, the delay between [18F]ML-10 imaging and the chemotherapy completion could have been non-optimal for visualization of apoptosis. However, we performed the PET imaging 72 h after treatment in accordance with the literature. In addition, the ex vivo analyses confirmed the increase of the apop-totic fraction at this time point. Secondly, the ques-tion of the impact of paclitaxel treatment on the in vivo distribution of the radiotracer was raised. However, dynamic PET images during treatment, on treated mice, did not show any difference in distribu-tion of radiotracer in non-target organs. Thirdly, the sensitivity of the radiotracer must also be questioned. In our models, we were unable to detect, by PET im-aging, the doubling of the apoptotic fraction after treatment. Nevertheless, before treatment, i.e., at the baseline, a positive correlation between the percentage of apoptotic cells and tumoral uptake of [18F]ML-10 before treatment was clearly evicence (p = 0.0008). Another important concern could be raised with re-gard to the method used for quantitative analysis of PET images, which we did not carry out. In clinical situations, a methodology based on voxel analysis has been developed [20]. It performs voxel-by-voxel sub-traction of signal of pre-treatment from post-treatment and classifies voxels into three categories: those with positive accumulation, unchanged uptake or negative value to classify patients as responders or non-responders. This methodology has never been used in preclinical studies since it would require a highly reproducible registration of PET images and CT images. Finally, we assume that the most probable hypothesis that could explain the failure of [18 F]ML-10 could be related to the pH variations of the tumor microenvironment during the chemotherapy. As shown in the literature, [18F]ML-10 is also a pH-sensitive radiotracer. Indeed, the malonic acid moi-eties of this radiotracer have pKa values of 3.07 and 5.78. At physiological pH, the di-anionic form of mal-onate predominates [20, 26, 28–30]. According to pKa values cited, a decrease of extracellular pH will
favor the apparition of the mono-protonated carbox-ylic acid form of [18F]ML-10 and facilitate its inter-action with the membrane of the apoptotic cells [30]. Hypoxia and apoptosis in solid tumors can lead to acidification of the intracellular milieu. In addition, some authors have demonstrated the ability of cancer cells to reverse the pH gradient across the membrane cell which could decrease the extracellular pH (acid-ification) and facilitate the [18F]ML-10 uptake [29,
31–33]. This hypothesis is supported by the correl-ation observed in our model between the fixcorrel-ation of [18F]ML-10 and [18F]FMISO. The in vitro results of radiotracer uptake reported herein and conducted with extracellular pH variations are consistent with such mechanism. Our hypothesis, confirmed by the literature, is that paclitaxel treatment of MDA-MB-468 xenograft models results in an increase of tu-moral pH (basification) that will lead to a decrease of [18F]ML-10 cellular uptake. Nevertheless, this phenomenon was not observed in the orthotopic model. Zhang’s team was able to show that an ortho-topic implantation revealed a more favorable and homogeneous growth of tumors as well as an in-creased microvessel density [26]. A better tumor vascularization then allows a better elimination of necrotic cells and therefore a less important variation in pH. However, even in this model, no significant in-crease in [18F]ML-10 tumor uptake was observed dur-ing apoptosis induced by treatment.
Our results demonstrated that [18F]ML-10 was not accurate to assess therapeutic response in chemother-apy setting probably due to the modification of extra-cellular pH conditions. However, the capacity of [18F]ML10 to predict the therapeutic response was confirmed in radiotherapy setting. The explanation is that radiotherapy treatment is known to induce, in addition to the “cell death” effect, inflammation at the tumor level that consequently modifies extracellular pH. Indeed, this inflammation leads to two phenom-ena: an activation of the immune system which will induce an increase in blood flow and an acidification of the microenvironment due to the release of im-mune cells and cytokines [34]. As a consequence, pre-cedent clinical trials used [18F]ML-10 for PET imaging of apoptosis following radiotherapy treat-ments [21, 35].
Conclusions
Our results in vitro confirmed that [18F]ML-10 specific-ally targets the cells in early apoptosis, after exposure of TNBC cell lines to paclitaxel for 72 h. In addition, favor-able pharmacokinetic properties and high metabolic sta-bility of this radiotracer were confirmed in basal apoptotic in vivo models. Nevertheless, we evidence that
[18F]ML-10 did not allow imaging of in vivo apoptosis after paclitaxel treatment in a subcutaneous or orthoto-pic xenograft model of TNBC. Nevertheless, based on the several important issues highlighted in our study and taking into accounts the advantageous stability of [18F]ML-10 in basal conditions, this radiotracer may warrant further investigations in other preclinical cancer models than TNBC.
Supplementary information
Supplementary information accompanies this paper athttps://doi.org/10. 1186/s13550-019-0587-5.
Additional file 1. Details about assessment of apoptosis and radiosyntheses of [18F]ML-10, [18F]FDG, and [18F]FMISO.
Abbreviations
[18F]FDG:2-Deoxy-2-[18
F]fluoro-D-glucose;
[18F]FMISO: [18F]Fluoromisonidazole, 1-(2′-nitro-1′-imidazolyl)-3-[18 F]fluoro-2-propranol; [18F]ML-10: 2-(5-[18F]fluoropentyl)-2-methyl-malonic acid; %IA/
g: Percentage of injected activity per gram; CT: Computerized tomography; FEC: 5′-Fluorouracil + epirubicin + cyclophosphamide; FN: False negativity; FP: False positivity; IC50: Drug concentration that inhibited cell growth by
50%; i.v.: Intravenous injection; NAT: Neoadjuvant chemotherapy; pCR: Pathological complete response; PET: Positron emission tomography; PS: Phosphatidylserine; SD: Standard deviation; SPECT: Single photon emission computed tomography; SUV: Standard uptake value; TNBC: Triple negative breast cancer; TV: Tumor volume; HER2: Human epidermal growth factor receptor 2
Acknowledgements
We thank Christelle Soubeyrand-Damon (ANIPATH, GReD, Clermont-Ferrand) and Ludivine Furtado (Service d’anatomopathologie, Centre Jean Perrin, Clermont-Ferrand) for technical help in immunohistochemical studies as well as Jean-Luc Dubost (Unité de préparation des chimiothérapies, Centre Jean Perrin, Clermont-Ferrand). We would like to thank Dr. Aurélien Voissière (Centre de Recherche en Cancérologie de Lyon, Lyon) for his advice on the implementation of the orthotopic model and Sophie Besse (UMR1240, Clermont-Ferrand) for her technical assistance.
Authors’ contributions
EJ and MR have done in vitro and in vivo experiments. SS, AMB, and JMC have done (radio)chemical synthesis. EJ, SS, AMB, EC, and FC designed the study, analyzed the data, and wrote the manuscript. YB, EMN, and NRR contributed to data interpretation, gave important intellectual input, and carefully revised the manuscript. FC designed and supervised the study. All authors approved the final manuscript for submission.
Funding
This research was supported by grants from the Ligue contre le cancer comité de l’Allier et du Puy-de-Dôme.
Availability of data and materials Not applicable
Ethics approval and consent to participate Not applicable
Consent for publication Not applicable Competing interests
The authors declare that they have no competing interests. Author details
1Service de Médecine Nucléaire, Centre Jean Perrin, Clermont-Ferrand,
France.2Département de Pathologie, Centre Jean Perrin, Clermont-Ferrand,
France.3Université Clermont Auvergne, INSERM, Imagerie Moléculaire et
Stratégies Théranostiques, UMR1240, Clermont-Ferrand, France.4Zionexa,
Aubière, France.5Centre de Lutte Contre le Cancer, Centre Jean Perrin, 58
rue Montalembert, 63011 Clermont-Ferrand, France.
Received: 4 October 2019 Accepted: 12 December 2019
References
1. Gonçalves A, Sabatier R, Charafe-Jauffret E, Gilabert M, Provansal M, Tarpin C, et al. Cancer du sein triple-négatif : caractéristiques histocliniques et moléculaires, prise en charge et perspectives thérapeutiques. Bull Cancer (Paris). 2013;100:453–64.
2. Cortazar P, Zhang L, Untch M, Mehta K, Costantino JP, Wolmark N, et al. Pathological complete response and long-term clinical benefit in breast cancer: the CTNeoBC pooled analysis. Lancet Lond Engl. 2014;384:164–72. 3. Morris PG, Murphy CG, Mallam D, Accordino M, Patil S, Howard J, et al.
Limited overall survival in patients with brain metastases from triple negative breast cancer. Breast J. 2012;18:345–50.
4. von Minckwitz G, Kaufmann M, Kümmel S, Fasching P, Eiermann W, Blohmer J, et al. Integrated meta-analysis on 6402 patients with early breast cancer receiving neoadjuvant anthracycline-taxane +/- trastuzumab containing chemotherapy. Cancer Res. 2009.
5. Wang Y, Zhang C, Liu J, Huang G. Is 18F-FDG PET accurate to predict neoadjuvant therapy response in breast cancer? Breast Cancer Res Treat: A meta-analysis; 2012.
6. Cheng X, Li Y, Liu B, Xu Z, Bao L, Wang J. 18F-FDG PET/CT and PET for evaluation of pathological response to neoadjuvant chemotherapy in breast cancer: a meta-analysis. Acta Radiologica. 2012;53(6):615–27.https://doi.org/ 10.1258/ar.2012
7. Spence AM, Muzi M, Graham MM, O’Sullivan F, Link JM, Lewellen TK, et al. 2-[18F]Fluoro-2-deoxyglucose and glucose uptake in malignant gliomas before and after radiotherapy: correlation with outcome. Clin Cancer Res. 2002.
8. Wahl RL, Jacene H, Kasamon Y, Lodge MA. From RECIST to PERCIST: Evolving considerations for pet response criteria in solid tumors. J Nucl Med. 2009.
9. Huschtscha LI, Bartier WA, Ross CE, Tattersall MH. Characteristics of cancer cell death after exposure to cytotoxic drugs in vitro. Br J Cancer. 1996;73: 54–60.
10. Meyn RE, Stephens LC, Hunter NR, Milas L. Apoptosis in murine tumors treated with chemotherapy agents. Anticancer Drugs. 1995;6:443. 11. Smith BA, Smith BD. Biomarkers and molecular probes for cell death
imaging and targeted therapeutics. Bioconjug Chem. 2012;23:1989–2006. 12. Nguyen Q-D, Smith G, Glaser M, Perumal M, Arstad E, Aboagye EO. Positron
emission tomography imaging of drug-induced tumor apoptosis with a caspase-3/7 specific [18F]-labeled isatin sulfonamide. Proc Natl Acad Sci U S A. 2009;106:16375–80.
13. Madar I, Huang Y, Ravert H, Dalrymple SL, Davidson NE, Isaacs JT, et al. Detection and quantification of the evolution dynamics of apoptosis using the PET voltage sensor 18F-fluorobenzyl triphenyl phosphonium. J Nucl Med Off Publ Soc Nucl Med. 2009;50:774–80.
14. Kuge Y, Zhao S, Takei T, Tamaki N. Molecular imaging of apoptosis with radio-labeled Annexin A5 focused on the evaluation of tumor response to chemotherapy. Anticancer Agents Med Chem. 2009;9:1003–11.
15. Loose D, Vermeersch H, De Vos F, Deron P, Slegers G, Van de Wiele C. Prognostic value of 99mTc-HYNIC annexin-V imaging in squamous cell carcinoma of the head and neck. Eur J Nucl Med Mol Imaging. 2008;35:47–52. 16. Kartachova M, Haas RLM, Olmos RAV, Hoebers FJP, van Zandwijk N, Verheij M. In vivo imaging of apoptosis by 99mTc-Annexin V scintigraphy: visual analysis in relation to treatment response. Radiother Oncol J Eur Soc Ther Radiol Oncol. 2004;72:333–9.
17. Kartachova MS, Verheij M, van Eck BL, Hoefnagel CA, Olmos RAV. Radionuclide imaging of apoptosis in malignancies: promise and pitfalls of 99mTc-Hynic-rh-Annexin V imaging. Clin Med Oncol. 2008;2:319–25. 18. Cohen A, Shirvan A, Levin G, Grimberg H, Reshef A, Ziv I. From the Gla
domain to a novel small-molecule detector of apoptosis. Cell Res. 2009;19: 625–37.
19. Höglund J, Shirvan A, Antoni G, Gustavsson S-Å, Långström B, Ringheim A, et al. 18F-ML-10, a PET tracer for apoptosis: first human study. J Nucl Med Off Publ Soc Nucl Med. 2011;52:720–5.
20. Allen AM, Ben-Ami M, Reshef A, Steinmetz A, Kundel Y, Inbar E, et al. Assessment of response of brain metastases to radiotherapy by PET imaging of apoptosis with18F-ML-10. Eur J Nucl Med Mol Imaging. 2012;39:1400–8.
21. Sun L, Zhou K, Wang W, Zhang X, Ju Z, Qu B, et al. [18F]ML-10 Imaging for assessment of apoptosis response of intracranial tumor early after radiosurgery by PET/CT. Contrast Media Mol Imaging. 2018;2018:9365174.
https://doi.org/10.1155/2018/9365174
22. Demirci E, Ahmed R, Ocak M, Latoche J, Radelet A, DeBlasio N, et al. Preclinical evaluation of 18F-ML-10 to determine timing of apoptotic response to chemotherapy in solid tumors. Mol Imaging. 2017;16: 1536012116685941.
23. Gu B, Liu S, Sun Y, Zhang J, Zhang Y, Xu X, et al. Predictive Value of [18F]ML-10 PET/CT in early response evaluation of combination radiotherapy with cetuximab on nasopharyngeal carcinoma. Mol Imaging Biol MIB Off Publ Acad Mol Imaging. 2019.
24. Kadirvel M, Fairclough M, Cawthorne C, Rowling EJ, Babur M, McMahon A, et al. Detection of apoptosis by PET/CT with the diethyl ester of [18F]ML-10
and fluorescence imaging with a dansyl analogue. Bioorg Med Chem. 2014; 22:341–9.
25. Yang TJ, Haimovitz-Friedman A. Verheij M. Exp Oncol: Anticancer therapy and apoptosis imaging; 2012.
26. Zhang Y, Zhang G-L, Sun X, Cao K-X, Ma C, Nan N, et al. Establishment of a murine breast tumor model by subcutaneous or orthotopic implantation. Oncol Lett. 2018.
27. Witney TH, Hoehne A, Reeves RE, Ilovich O, Namavari M, Shen B, et al. A systematic comparison of 18F-C-SNAT to established radiotracer imaging agents for the detection of tumor response to treatment. Clin Cancer Res. 2015.
28. Reshef A, Shirvan A, Akselrod-Ballin A, Wall A, Ziv I. Small-molecule biomarkers for clinical PET imaging of apoptosis. J Nucl Med Off Publ Soc Nucl Med. 2010.
29. Bauwens M, De Saint-Hubert M, Cleynhens J, Brams L, Devos E, Mottaghy FM, et al. Radioiodinated phenylalkyl malonic acid derivatives as pH-sensitive SPECT tracers. PLoS ONE. 2012.
30. Haines TH. Anionic lipid headgroups as a proton-conducting pathway along the surface of membranes: a hypothesis. Proc Natl Acad Sci U S A. 1983. 31. Zhang X, Lin Y, Gillies RJ. Tumor pH and its measurement. J Nucl Med Off
Publ Soc Nucl Med. 2010.
32. Webb BA, Chimenti M, Jacobson MP, Barber DL. Dysregulated pH: a perfect storm for cancer progression. Nat Rev Cancer. 2011.
33. Lagadic-Gossmann D, Huc L, Lecureur V. Alterations of intracellular pH homeostasis in apoptosis: origins and roles. Cell Death Differ. 2004. 34. Jeong H, Bok S, Hong B-J, Choi H-S, Ahn G-O. Radiation-induced immune
responses: mechanisms and therapeutic perspectives. Blood Res. 2016. 35. Oborski MJ, Laymon CM, Lieberman FS, Drappatz J, Hamilton RL, Mountz
JM. First use of 18F-labeled ML-10 PET to assess apoptosis change in a newly diagnosed glioblastoma multiforme patient before and early after therapy. Brain Behav. 2014.
Publisher’s Note
Springer Nature remains neutral with regard to jurisdictional claims in published maps and institutional affiliations.


![Fig. 5 [ 18 F]ML-10 uptake. a [ 18 F]ML-10 was added to the cell suspension containing adherent cells 72 h after paclitaxel and incubation for 15 min and its uptake was determined](https://thumb-eu.123doks.com/thumbv2/123doknet/14547795.536544/9.892.83.808.133.495/uptake-suspension-containing-adherent-paclitaxel-incubation-uptake-determined.webp)
![Fig. 6 Time activity curves after bolus injection of 29.5 ± 4.1 MBq [ 18 F]ML-10 of triple negative breast cancer models](https://thumb-eu.123doks.com/thumbv2/123doknet/14547795.536544/10.892.87.807.602.993/activity-curves-injection-triple-negative-breast-cancer-models.webp)
![Fig. 8 Evaluation of early response by [ 18 F]ML-10 PET imaging on subcutaneously model](https://thumb-eu.123doks.com/thumbv2/123doknet/14547795.536544/11.892.87.809.675.1024/fig-evaluation-early-response-pet-imaging-subcutaneously-model.webp)
![Fig. 10 Evaluation of early response by [ 18 F]ML-10 PET imaging on an orthotopic model](https://thumb-eu.123doks.com/thumbv2/123doknet/14547795.536544/12.892.85.808.129.547/fig-evaluation-early-response-pet-imaging-orthotopic-model.webp)
