HAL Id: inserm-01983245
https://www.hal.inserm.fr/inserm-01983245
Submitted on 28 Jan 2019
HAL is a multi-disciplinary open access
archive for the deposit and dissemination of
sci-entific research documents, whether they are
pub-lished or not. The documents may come from
teaching and research institutions in France or
abroad, or from public or private research centers.
L’archive ouverte pluridisciplinaire HAL, est
destinée au dépôt et à la diffusion de documents
scientifiques de niveau recherche, publiés ou non,
émanant des établissements d’enseignement et de
recherche français ou étrangers, des laboratoires
publics ou privés.
the 3C cohort study
Virginie Nael, Karine Peres, Jean-François Dartigues, Luc Letenneur, Helene
Amieva, Angelo Arleo, Anne-Catherine Scherlen, Christophe Tzourio,
Claudine Berr, Isabelle Carrière, et al.
To cite this version:
Virginie Nael, Karine Peres, Jean-François Dartigues, Luc Letenneur, Helene Amieva, et al.. Vision
loss and 12-year risk of dementia in older adults: the 3C cohort study. European Journal of
Epidemi-ology, Springer Verlag, 2019, 34 (2), pp.141-152. �10.1007/s10654-018-00478-y�. �inserm-01983245�
Vision loss and 12-year risk of dementia in older adults: the 3C cohort study
Authors: Virginie Naëla,b,c; Karine Pérèsa; Jean-François Dartiguesa,d; Luc Letenneura, Hélène Amievaa; Angelo Arleob; Anne-Catherine Scherlenc; Christophe Tzourioa; Claudine Berre; Isabelle Carrièree; Cécile Delcourta; Catherine Helmera andthe Sense-Cog consortium’.
a Univ. Bordeaux, Inserm, Bordeaux Population Health Research Center, UMR 1219, F-33000 Bordeaux, France b Sorbonne University, UPMC University of Paris 06, INSERM, CNRS, Vision Institute, F-75012 Paris, France c R&D Life and Vision Science, Essilor International, F-75012 Paris, France
d Bordeaux University Hospital, memory consultation, CMRR, Bordeaux, F-33076 France e University of Montpellier, Inserm U1061, F-34093 Montpellier, France
‘List of Sense-Cog Consortium:
Geir Bertelsen1,2, Suzanne Cosh3, Audrey Cougnard-Grégoire3, Piers Dawes4, Cécile Delcourt3, Fofi Constantinidou5, Catherine Helmer3, M. Arfan Ikram 6,7, Caroline CW Klaver 6,8, Iracema Leroi 9, Asri Maharani 9,10, Magda Meester-Smor 6,8, Unal Mutlu 6,8, Virginie Nael3,11,12, Neil Pendleton 9,10, Henrik Schirmer 13, Gindo Tampubolon 14, Henning Tiemeier 6,15, Therese von Hanno 16,17.
1: UiT The Arctic University of Norway, Department of Community Medicine, Faculty of Health Sciences, N-9037 Tromsø, Norway
2: University Hospital of North Norway, Department of Ophthalmology, N-9038 Tromsø, Norway
3: Univ. Bordeaux, Inserm, Bordeaux Population Health Research Center, team LEHA, UMR 1219, F-33000 Bordeaux, France
4: University of Manchester, Manchester Centre for Audiology and Deafness, School of Health Sciences, Manchester, UK
5: University of Cyprus, Department of Psychology & Center for Applied Neuroscience, Nicosia, Cyprus 6: Erasmus Medical Centre, Department of Epidemiology, Rotterdam, The Netherlands
7: Erasmus Medical Centre, Departments of Neurology and Radiology, Rotterdam, The Netherlands 8: Erasmus Medical Centre, Department of Ophthalmology, Rotterdam, The Netherlands
9: University of Manchester, Division of Neuroscience and Experimental Psychology, School of Biological Sciences, Manchester, UK
10: University of Manchester, Academic Health Science Centre, Manchester, UK
11: Sorbonne University, UMPC University of Paris 06, INSERM, CNRS, Vision Institute, F-75012 Paris, France 12: R&D Life and Vision Science, Essilor International, F-75012 Paris, France
13: UiT-The Arctic University of Norway, Department of Clinical Medicine, Cardiovascular research Group-UNN, N-9037 Tromsø, Norway
14: University of Manchester, Global Development Institute, Manchester, UK 15: Erasmus Medical Centre, Department of Psychiatry, Rotterdam, The Netherlands
16: UiT-The Arctic University of Norway, Department of Clinical Medicine, Faculty of Health Sciences, N-9037 Tromsø, Norway
17: Nordland Hospital, Department of Ophthalmology, N-8092 Bodø, Norway
Corresponding author:
Virginie Naël
Université de Bordeaux, ISPED Case 11, 146 rue Léo Saignat, CS61292,
F-33076 BORDEAUX Cedex – France Phone: (33) 5 57 57 12 99
Email address: virginie.nael@gmail.com
ACKNOWLEDGMENTS
Study funding: The Three-City study is conducted under a partnership agreement between the Institut National de la
Santé et de la Recherche Médicale (INSERM), the University Bordeaux 2 Victor Segalen and Sanofi-Aventis. The Fondation pour la Recherche Médicale funded the preparation and initiation of the study. The Three-City study is also supported by the Caisse Nationale Maladie des Travailleurs Salariés, Direction Générale de la Santé, MGEN, Institut de la Longévité, Conseils Régionaux d’Aquitaine et Bourgogne, Fondation de France, Ministry of Research-INSERM Programme “Cohortes et collections de données biologiques”, Agence Nationale de la Recherche ANR PNRA 2006 and LongVie 2007, the "Fondation Plan Alzheimer" (FCS 2009-2012) and the Caisse Nationale de Solidarité pour
l'Autonomie (CNSA). None of the sponsors participated in the collection, management, statistical analysis and interpretation of the data, nor in the preparation, review or approval of the present manuscript. SENSE-Cog has received funding from the European Union's Horizon 2020 research and innovation program under grant agreement No 668648.
ABSTRACT
1
To analyze the longitudinal relationships between vision loss and the risk of dementia in the first 2 years, from 2 to 4
2
years and beyond 4 years) after inclusion and to determine the roles of depressive symptomatology and engagement in
3
cognitively stimulating activities in these associations. This study is based on the Three-City (3C) study, a
population-4
based cohort of 7736 initially dementia-free participants aged 65 years and over with 12 years of follow-up. Near visual
5
impairment (VI) was measured and distance visual function (VF) loss was self-reported. Dementia was diagnosed and
6
screened over the 12-year period. At baseline, 8.7% had mild near VI, 4.2% had moderate to severe near VI, and 5.3%
7
had distance VF loss. Among the 882 dementia cases diagnosed over the 12-year follow-up period, 140 cases occurred
8
in the first 2 years, 149 from 2 to 4 years and 593 beyond 4 years after inclusion. In Cox multivariate analysis, moderate
9
to severe near VI was associated with an increased risk of dementia in the first 2 years (HR= 2.0, 95%CI: 1.2 to 3.3)
10
and from 2 to 4 years (HR=1.8, 95%CI: 1.1 to 3.1) but the association was not significant beyond 4 years after inclusion
11
even if pointing in similar direction (HR=1.3, 95%CI: 0.95 to 1.9). Mild near VI was associated with an increased risk
12
of dementia only in the first 2 years (HR=1.6, 95%CI: 1.1 to 2.5). Moreover, self-reported distance VF loss was
13
associated with an increased risk beyond 4 years after inclusion (HR= 1.5, 95%CI: 1.1 to 2.0) but the association was no
14
longer significant after taking into account baseline cognitive performances. Further adjustment for engagement in
15
cognitively stimulating activities only slightly decreased these associations. However, there was an interaction between
16
vision loss and depressive symptomatology, with vision loss associated with dementia only among participants with
17
depressive symptomatology. These results suggest that poor vision, in particular near vision loss, may represent an
18
indicator of dementia risk at short and middle-term, mostly in depressed elderly people.
19
INTRODUCTION
21
Vision loss (VL) is common in older adults and increases with age. The leading cause of VL is uncorrected refractive
22
error [1], easily avoidable with corrective eyeglasses, lenses or refractive surgery. VL has been associated with
23
cognitive impairment, but mainly in cross-sectional studies [2–10], whereas longitudinal studies have shown conflicting
24
results [11–16]. Furthermore, little is known about the longitudinal association between VL and dementia, with only
25
one previous study among participants aged 71 and older, showing that those who perceived that their vision was good
26
or excellent had a lower risk of developing dementia [17].
27
Several hypotheses have been proposed to explain the association between VL and cognitive impairment: 1) VL may
28
act through factors known to be associated with cognitive decline and dementia, in particular engagement in activities
29
and depression [18–20]. Thus, VL may decrease the engagement in cognitively stimulating activities or participation in
30
social life or increase the risk of depression, which may subsequently increase the risk of dementia [21–26]. 2) A lack
31
of adequate sensory input could lead to neuronal atrophy and thus cognitive impairment [27]. 3) Visually impaired
32
people may need to allocate more resources to perceive and interpret sensory information and thus have fewer resources
33
for other cognitive tasks [28]. 4) Alternatively, VL and dementia may share common risk factors as aging [27]. 5)
34
Finally, vision loss may be one of the early symptoms of dementia as, Alzheimer’s disease (AD), the major cause of
35
dementia, can affect the visual pathway and result in visual deficits [29].
36
In the present study, we aimed to investigate the longitudinal association between vision loss and the incidence of
37
dementia. In particular, thanks to a 12-year follow-up period within a large population-based cohort we aimed to study
38
the associations for several periods of time after inclusion. Moreover, we aimed to explore the roles of depressive
39
symptomatology and engagement in cognitively stimulating activities in these associations.
40
41
METHODS
42
This study forms part of the SENSE-Cog multi-phase research program, funded by the European Union Horizon 2020
43
program. SENSE-Cog aims to promote mental well-being in older adults with sensory and cognitive impairments
44
(http://www.sense-cog.eu/). The first part of this project aims to better understand the links between sensory, cognitive
45
and mental health in older Europeans.
46
Study population
47
This study was based on the Three-City study (3C), a French population-based cohort of 9294 community-dwelling
48
older adults aged 65 years and over who enrolled between 1999 and 2001. The aim of 3C is to assess the risk of
49
dementia and cognitive decline due to vascular risk factors. The methodology of the 3C study has been described
50
elsewhere [30]. Briefly, participants were recruited from the electoral rolls of three French cities: Bordeaux (n=2104),
51
Dijon (n=4931) and Montpellier (n=2259). Data were collected during face-to-face interviews; trained
52
neuropsychologists administered standardized questionnaires and performed clinical examinations at baseline and 2, 4,
53
7, 10 and 12 years later. Sociodemographic characteristics, lifestyle, cardiovascular risk factors, vision, and depressive
54
symptomatology were assessed at each interview. A complete functional and cognitive evaluation with systematic
55
screening for dementia was also conducted. Moreover, blood samples and participation in leisure activities were
56
collected at baseline.
57
Among the 8250 participants who were without prevalent dementia at baseline and were followed up at least once
58
during the 12-year follow-up period, 7736 had baseline data for both distance and near vision loss and were thus,
59
included in this study (Figure 1).
60
Diagnosis of dementia
61
Dementia was actively diagnosed at baseline and at each follow-up visit using a 3-step procedure. The first step
62
consisted of a cognitive evaluation made by the neuropsychologist through a series of psychometric tests including at a
63
minimum the MMSE [31], the Isaacs set test and the Benton Visual Retention Test [32,33]. Participants suspected of
64
having dementia, based on either their neuropsychological performance or decline relative to a previous examination,
65
were then examined by a senior neurologist to establish a clinical diagnosis. Finally, an independent committee of
66
neurologists and geriatricians reviewed all potential cases of dementia with all available information in order to obtain a
67
consensus on the diagnosis and etiology, according to the DSM-IV and the NINCDS-ADRDA criteria [34,35].
68
Vision loss
69
Binocular near visual acuity was assessed using the Parinaud scale (a Jaeger-like reading test commonly used in
70
France). Assessments were carried out using presenting vision with usual optical correction (i.e., their personal
71
spectacles) where applicable, with a standardized reading distance of 33 cm. Mild near visual impairment (VI) was
72
classified by Parinaud 3 or 4 (Snellen equivalent 20/30-20/60) and moderate to severe near VI by Parinaud > 4 (Snellen
73
equivalent < 20/60). Distance visual function (VF) loss was self-reported, defined as an inability or difficulty in
74
recognizing a familiar face at 4 meters, using presenting optical correction if any.
75
Leisure activities
76
Leisure activities were assessed at baseline using two different self-administered questionnaires. In Bordeaux, 28
77
activities were assessed, 12 of which were considered cognitively stimulating activities: going to the cinema, painting,
78
sculpting, going to the theater, reading literature, reading newspapers, acting as a director of an association (sporting,
79
cultural or political), playing board games, doing crossword puzzles, and travelling. One point was awarded for each
80
activity performed [36]. In Dijon and Montpellier, 6 cognitively stimulating activities were considered among 19
81
activities assessed: reading, doing crossword puzzles, playing cards, going to the cinema/theater, practicing an artistic
82
activity and managing an association (sporting, cultural or political). Participants were asked about the monthly
83
frequency (0= never or rarely; 1= 1-3 per month; 2= 1 per week; 3= ≥2 per week) that they engaged in each activity,
84
except for reading, for which participants were asked about the daily frequency (0= <1 hour per day; 1= 1-2 hours per
85
day; 2= >2 hours per day). Cognitively stimulating activities scores were calculated by summing the item scores [37].
86
Due to the difference in assessments between the centers, cognitively stimulating activities scores were standardized
(Z-87
score) for the analyses.
88
Depressive symptomatology
89
Depressive symptomatology at baseline was evaluated using the Center for Epidemiologic Studies Depression Scale
90
(CESD) questionnaire, a 20-item self-report rating scale designed to evaluate the frequency of depressive symptoms
91
experienced over the past week. Each item is scored from 0 (rarely) to 3 (most of the time). Thus, the total CESD score
92
ranges from 0 to 60, increasing with the level of severity of depressive symptomatology. As previously validated,
93
scored of ≥17 for men and ≥23 for women were used to define depressive symptomatology [38,39].
94
Potential confounders
95
The following sociodemographic factors were considered: age, gender, educational level (elementary school without
96
diploma, short secondary school and higher levels), living alone and monthly income (<1500€, 1500-2300€, >€2300,
97
refusal to answer). As other sensory impairments may also have an impact on dementia risk [40], self-reported hearing
98
loss, classified in three categories (no, mild and moderate to severe) was also considered. Other potential confounders
99
included cardiovascular risk factors: hypertension (systolic blood pressure ≥140 mmHg and/or diastolic blood pressure
100
≥90 mmHg using the mean of two measures and/or antihypertensive medication), history of cardiovascular ischemic
101
disease, history of stroke, hypercholesterolemia (cholesterol ≥6.20 mmol/L and/or hypolipemiant treatment),
102
hypertriglyceridemia (triglycerides ≥1.7 mmol/L), diabetes (normal,hyperglycemia (fasting glycemia [6.1-7.0[ mmol/L,
103
diabetes (fasting glycemia ≥7.0 mmol/L and/or antidiabetic treatment)), smoking habits (never, former, current), and
104
body mass index (BMI) (weight/height2) in four categories (<21, 27–29.9, ≥30 vs 21–26.9). Additionally,APOE
105
genotype (at least one ɛ4 allele vs no ɛ4) was also taken into account.
106
Statistical analysis
107
Cox proportional hazards models with delayed entry (using age as time-scale) were used to compare the baseline
108
characteristics of participants according to incident dementia and to estimate the risk of dementia associated with vision
109
loss, providing hazard ratios (HR) and 95% confidence intervals (CI). For participants who developed dementia, time of
110
event was determined at the middle of the interval between the visit when dementia was diagnosed and the last visit
111
prior to dementia diagnosis. Participants who did not develop dementia were censored at the last follow-up visit. Near
112
and distance vision loss were analyzed in separate models. In order to assess whether vision loss had a constant effect
113
over time, vision loss was modelled by a time-dependent variable represented by a step function. The effects of vision
114
loss on the risk of dementia were estimated in the first 2 years, from 2 to 4 years and beyond 4 years after inclusion.
115
Supplementary analysis using other periods of time (the first 4 years, from 4 to 7 years and beyond 7 years after
116
inclusion) was also performed. The multivariate model included the following covariates: center, gender, educational
117
level, self-reported hearing loss, living alone, income, cardiovascular risk factors and ApoE4 genotype. A total of 276
118
participants had missing data for at least one covariate. To avoid excluding these participants and limit thus selection
119
bias we performed multiple imputation for missing values [41].
120
To further assess the robustness of our analyses to potential reverse causation, we carried out a sensitivity analysis
121
additionally adjusted for baseline cognitive status. A z-score of global cognition at baseline was computed, including
122
performances on the MMSE, Isaacs Set Test and Benton Visual Retention Test.
123
We further studied the effects of engagement in cognitively stimulating activities and depressive symptomatology on
124
the relationships between vision and dementia, these two factors being potentially associated with both vision and
125
dementia. We first searched for a potential interaction between these two factors and vision loss on the risk of dementia
126
and then presented accordingly either adjusted or stratified analyses. The analyses were performed using SAS software
127
(version 9.3; SAS Institute Inc., Cary, NC, USA).
128
RESULTS
129
Study sample
130
At baseline, the mean age of the 7736 participants was 73.9 years; 61.3% were women, 39.5% had a high educational
131
level, and 12.6% had depressive symptomatology (Table 1). The mean MMSE score was 27.4 (SD 1.9). A total of 882
132
participants developed dementia over the 12-year follow-up period (median= 9.1 years, range= 0.6 – 13.5) with an
133
incidence of 14.5 cases per 1000 person-years. Participants who ultimately developed dementia were older, less
134
educated, had lower income, more self-reported hearing loss, more vascular risk factors, more depressive
135
symptomatology, reported less engagement in cognitively stimulating activities, were more often APOE4 carriers and
136
had lower MMSE scores at baseline. They had also more often near VI and distance VF loss.
137
Vision loss and risk of incident dementia
138
Main analysis
139
Among the 7736 participants, 671 (8.7%) had mild near VI, 325 (4.2%) moderate to severe near VI and 413 (5.3%)
140
distance VF loss. Among the 882 cases of dementia occurred over the 12-year follow-up, 140 cases occurred before the
141
first follow-up time ( in the first 2 years), 149 between the first and the second follow-up time ( from 2 to 4 years) and
142
593 after the second follow-up time (beyond 4 years). In the analyses adjusted for all the potential confounders (Table
143
2), mild near VI was associated with an increased risk of dementia only in the first 2 years (HR=1.6, 95%CI: 1.1 to 2.5).
144
Moderate to severe near VI was associated with an increased risk of dementia in the first 2 years (HR= 2.0, 95%CI: 1.2
145
to 3.3) and from 2 to 4 years (HR=1.8, 95%CI: 1.1 to 3.1), but the risk was not significantly increased beyond 4 years
146
although there was a trend (HR= 1.3, 95%CI: 0.95 to 1.9). Distance VF loss was associated with an increased risk of
147
dementia only beyond 4 years (HR= 1.5, 95%CI: 1.1 to 2.0). In sensitivity analysis additionally adjusted for baseline
148
global cognition, results were almost unchanged for near vision although the association between mild near VI and
149
dementia in the first 2 years was no longer significant (Supplementary table 1, HR=1.5, 95%CI: 0.98 to 2.4, p=0.06).
150
However, distance VF loss was no longer significantly associated with dementia beyond 4 years (HR= 1.3, 95%CI: 0.94
151
to 1.8). In the supplementary analysis using other cut-offs (<4 years, 4-7 years and ≥7 years) we found a significant
152
effect of vision loss on dementia for moderate to severe near VI only in the first 4 years after inclusion (HR=1.88,
153
95%CI 1.29;2.73, p=0.001); after 7 years the increased risk associated with distance VF loss was only borderline
154
significant (HR=1.55, 95%CI 0.99;2.44, p=0.055)(Supplementary table 2).
155
Engagement in cognitively stimulating activities
156
There was no interaction between vision loss and cognitively stimulating activities, thus to analyze the effects of
157
engagement in cognitively stimulating activities on the associations between vision loss and dementia we additionally
158
adjusted for these activities. Engagement in cognitively stimulating activities was evaluated for 7089 participants, this
159
relatively large number of missing data (8.4%) being due to the evaluation by self-questionnaire. At baseline,
160
participants with near VI had lower mean scores of engagement in cognitively stimulating activities, with scores
161
decreasing as the severity of VI increased (0.08 (95% CI: 0.06 to 0.11) for no near VI, -0.14 (95% CI: -0.22 to -0.06)
162
for mild VI, -0.38 (95% CI:-0.49 to -0.26)for moderate to severe VI, p<0.0001 adjusted for age). After additional
163
adjustment for these activities in the multivariate model (Table 3, model B), mild near VI was still associated with an
164
increased risk of dementia in the first 2 years (HR=1.7, 95%CI: 1.0 to 2.8). Moderate to severe near VI was also
165
associated with an increased risk of dementia from 2 to 4 years (HR=1.8, 95%CI: 1.1 to 3.3) but the risk was no longer
166
significant beyond 4 years (HR=1.7, 95%CI: 0.9 to 3.2). As in the previous model distance VF loss was associated with
167
an increased risk only beyond 4 years (HR=1.4, 95%CI 1.0 to 2.0). Compared to results observed in the same sample
168
(Table 3, Model A), HRs were only slightly decreased after this adjustment for cognitively stimulating activities.
169
Depressive symptomatology
170
Analyses stratified on depressive symptomatology showed an interaction between depressive symptomatology and
171
vision loss. At baseline, distribution of depressive symptomatology differed according to near VI (p=0.0040):
172
participants with moderate to severe near VI had more often depressive symptomatology (15.6% (95%CI; 11.7 to 20.1)
173
vs 12.4% (95%CI: 11.6 to 13.2) for those without near VI) and had a higher proportion of missing evaluations of their
174
depressive symptomatology (5.2% (95% CI: 3.1 to 8.2) vs 2.1% (95%CI: 1.8 to 2.5)). Among the 6610 participants
175
without depressive symptoms at baseline, 700 developed a dementia over the follow-up compared to 150 of the 951
176
participants with depressive symptoms. The risks of dementia associated with visual loss were significantly increased
177
only among participants with depressive symptomatology and not in those without. Indeed, moderate to severe near VI
178
was associated with an increased risk in the first 2 years (HR=2.9. 95%CI 1.0 to 7.9) and beyond 4 years (HR=3.1,
179
95%CI 1.5 to 6.5); the risk from 2 to 4 years tended to be increased but not significantly (HR=2.6, 95%CI 0.9 to 7.9).
180
Distance VF loss was associated with an increased risk of dementia only beyond 4 years (HR=2.8, 95%CI 1.5 to 5.3).
181
DISCUSSION
183
Within a large population-based cohort followed up over 12 years, we found that moderate to severe near VI was
184
associated with an increased risk of dementia in the first 2 years and from 2 to 4 years after adjusting for multiple
185
potential confounders, whereas mild near VI was associated with dementia only in the first 2 years. Less engagement in
186
cognitively stimulating activities only slightly decreased these associations. However, stratified analyses on depressive
187
symptomatology showed an interaction between vision loss and depressive symptomatology, such that moderate to
188
severe near visually impaired participants had an increased risk of dementia in the first 2 years, from 2 to 4 years (at the
189
limits of the significance) and beyond 4 years only when depressive symptomatology was present, with a nearly
three-190
fold increased risk. Participants self-reporting distance VF loss had an increased risk of dementia only beyond 4 years,
191
but that association was no longer significant after taking into account baseline cognitive performances.
192
Most of the previous research in this area has focused on cognition rather than dementia [2–16]. Within cross-sectional
193
studies, the results show either a significant association between VI and cognition [2–8] or no association [9,10]. In
194
longitudinal studies, significant associations between VI and cognitive decline have been found [12,14–16], using
195
different assessments of VI, either a measure of contrast sensitivity[12], a measure of presenting near VA [14] or
196
presenting distance VA [16] or self-reported decline in near or distance vision [15]. Regarding distance vision, however,
197
other studies using measures of presenting distance VA [14] or best-corrected distance VA [11,13] have not found any
198
association, or they found an association only when decline in distance vision was considered [13]. However, the
199
cognitive tests have differed between studies, with some including items requiring vision [12,15,16] whereas others
200
have used blind versions of cognitive tests [11,14]. Only one study presented results according to several cognitive
201
tests. The authors found significant associations between measured decline in distance vision and several cognitive tests
202
exploring speed, executive functions and memory, but all of them required visual capacities. In contrast, there was no
203
association with the only test not requiring vision, i.e., the verbal fluency test [13].
204
In addition, to our knowledge, only one study has explored the longitudinal association between VL and risk of
205
dementia [17], focusing only on self-reported VL without exploring the potential factors involved in that association. In
206
this American retrospective study on 625 older adults aged 71 years and older, who were followed up over 8.5 years,
207
the authors found that participants who reported their corrected (if applicable) vision as good or excellent at baseline
208
had a reduced 63% risk of dementia after adjusting for potential confounders. However, there was no indication about
209
the kind of vision (near or distance) studied and the authors did not evaluate the effect of vision loss on dementia risk
210
over time.
211
Several hypotheses have been proposed to explain the association between vision and dementia, either in favor of a
212
direct role of VL or via confounding factors, measurement bias and common processes [27,28]. To limit the impact of
213
potential confounders, we adjusted for numerous factors, including age, socio-economic factors, hearing impairment
214
and vascular factors. Although residual confounds cannot be totally excluded, none of these adjustments explained the
215
association. Moreover, as previous authors suggested that VL could be one of the first symptoms of dementia [42], we
216
adjusted for baseline cognitive performance, and we assessed whether vision loss had a constant effect over time, by
217
modeling the effect of vision loss on the risk of dementia in the first 2 years, from 2 to 4 years and beyond 4 years after
218
inclusion. The risk of dementia associated with near vision loss was indeed higher in the two first periods than beyond 4
219
years. Thus, reverse causation cannot be excluded and some participants were probably in a pre-dementia phase with
220
their visual impairment being one of the symptoms of this pre-dementia phase. However, although not significant, there
221
was a trend to an association between near vision loss and dementia beyond 4 years in the main analysis. Moreover,
222
near vision loss was associated with a significantly increased risk beyond 4 years among participants with depressive
223
symptoms, with a three-fold increased risk. In addition, distance VF loss tended also to be associated with an increased
224
risk beyond 4 years, suggesting that vision loss could be a risk factor of dementia.
225
Previous studies have also suggested that the effect of VL on dementia may be achieved through intermediate factors, in
226
particular decreased engagement in cognitively stimulating activities [22,25] or an increased level of depressive
227
symptomatology [23,24]. In our population, in spite of decreased engagement in cognitively stimulating activities by
228
participants with near VI, taking into account these activities only slightly explained the association between near VI
229
and dementia. We cannot exclude that the measurement of activities was not accurate enough or occurred not timely in
230
the relationship between VI and dementia, but it seems not to be the main factor involved. On the contrary, depressive
231
symptomatology seems to be particularly involved in the relationship between vision loss and dementia. Indeed, an
232
interaction between vision loss and depressive symptomatology was found with a risk of dementia for visually impaired
233
participants significantly increased only for those with depressive symptomatology. As such, VL could worsen the risk
234
of dementia in participants with pre-existing depressive symptoms. The mechanisms of this interaction need to be
235
further explored to understand if there are potential underlying pathophysiological mechanisms, or if it acts through
236
environmental or social factors, for example, social isolation and its consequences on recourse to care. Moreover,
237
whether depression is a risk factor or a prodromal symptom of dementia is still unknown [43]. Thus, this increased risk
238
of dementia in participants with vision loss and depressive symptoms could also reflect at least partly the onset of
239
dementia more so than a real increased risk. Furthermore, the direction of the relation between visual impairment and
240
depression is still uncertain, but previous papers from the 3C-Study showed an increased risk of depressive
241
symptomatology or suicidal ideation in participants with visual loss ([23,44]).
242
Our results have some limitations. Even after attempting to explore possible factors involved and in spite of a
243
longitudinal design with 12 years of follow-up, the temporal sequence between visual loss, engagement in cognitively
244
stimulating activities and depression is difficult to evaluate. Indeed, all of these factors can change over time. Moreover,
245
distance vision was self-reported using a single question; thus, it is less accurate than other standard measures. Indeed,
246
the meaning of 4-meters distance is really difficult to estimate and may vary from one participant to another. Moreover
247
self-reported ability of vision loss probably varies according to cognitive capacities. However, surprisingly the
248
association between distance VF loss and dementia was observed only beyond 4 years, even if it was no longer
249
significant after adjustment for global cognition. For near vision, the test used (the Parinaud chart) required the ability
250
to read, which can potentially be impaired in cognitive impairment. However, the association between near VI and
251
dementia remained after additionally adjusting for baseline cognition. In addition, other parameters of vision, such as
252
contrast sensitivity or visual field, are probably important to study but were not available in our study. Moreover, we
253
did not have information about best-corrected visual acuity neither about the cause of the decreased near vision loss,
254
which could be due to under corrected refractive error or eye-diseases such as glaucoma or age-related macular
255
degeneration. Indeed, some studies have suggested that dementia and some eye diseases could share common
age-256
related pathogenesis [45]. However, our objective was to study the association between vision loss (evaluated with
257
visual acuity used in daily life) and dementia, whatever the cause of vision loss. Beyond clinical diagnosis of dementia,
258
it would be of great interest to document whether vision loss is associated with imaging markers of Alzheimer's disease
259
and dementia. Within a subsample of the 3C-Bordeaux participants we failed to find a cross-sectional association
260
between vision loss and hippocampus volume. However, these analyses deserve to be further explored and replicated on
261
a larger sample. Finally, engagement in cognitively stimulating activities was assessed using self-administered
262
questionnaires, with some missing data. As expected, the participants answering the questionnaire were younger, more
263
educated, had less cardiovascular risk factors and better cognition at baseline. However, the associations were almost
264
unchanged in this subsample.
265
The strengths of our results are attributable to a large population-based cohort with a long period of follow-up, a
266
baseline measure of presenting binocular near visual acuity using a standardized scale and an adjustment for numerous
267
major potential confounding factors. Moreover, we actively screened for dementia using validation by an independent
268
committee. We explored factors – namely, depressive symptomatology and engagement in cognitively stimulating
269
activities – that may be involved in the association between VL and risk of dementia. Finally, we assessed the effect of
270
vision loss on dementia over time.
271
Conclusions
272
This longitudinal population-based study suggests that moderate to severe near VI could represent an indicator of
273
dementia risk in the subsequent years, particularly in people suffering from depression. These results need to be
274
replicated in other large longitudinal studies with both measure of near and distance visual acuity, and potential
275
mediators need to be further explored. A large part of VL is correctable or preventable [46] . However, future
276
researches and interventional studies are needed to further evaluate whether VL is only an indicator of future dementia
277
or whether the improvement of VL, may represent a promising opportunity for dementia prevention.
278
COMPLIANCE WITH ETHICAL STANDARDS
279
Conflict of interest
280
Authors V. Naël and AC Scherlen are Essilor International employees. Author C. Delcourt is a consultant for Bausch &
281
Lomb, Novartis, and Laboratoires Théa and has received research grants from Laboratoires Théa. The authors
282
K. Pérès, JF. Dartigues, L. Letenneur, H. Amieva, A. Arleo, I. Carrière, C. Tzourio, C. Berr and C. Helmer declare that
283
they have no conflict of interest.
284
285
Research involving Human Participants
286
All procedures performed in studies involving human participants were in accordance with the ethical standards of the
287
Kremlin-Bicêtre University Hospital and Sud-Mediterranée III committee and with the 1964 Helsinki declaration and
288
its later amendments or comparable ethical standards.
289
290
Informed consent
291
Informed consent was obtained from all individual participants included in the study.
292
REFERENCES
294
1. Bourne RR, Stevens GA, White RA, Smith JL, Flaxman SR, Price H, et al. Causes of vision loss worldwide, 1990–
295
2010: a systematic analysis. Lancet Glob Health. 2013;1:e339–49.
296
2. Chen SP, Bhattacharya J, Pershing S. Association of Vision Loss With Cognition in Older Adults. JAMA
297
Ophthalmol. 2017;135:963–70.
298
3. Spierer O, Fischer N, Barak A, Belkin M. Correlation Between Vision and Cognitive Function in the Elderly: A
299
Cross-Sectional Study. Medicine (Baltimore). 2016;95:e2423.
300
4. Mine M, Miyata K, Morikawa M, Nishi T, Okamoto N, Kawasaki R, et al. Association of Visual Acuity and
301
Cognitive Impairment in Older Individuals: Fujiwara-kyo Eye Study. Biores Open Access. 2016;5:228–34.
302
5. Garin N, Olaya B, Lara E, Moneta MV, Miret M, Ayuso-Mateos JL, et al. Visual impairment and multimorbidity in a
303
representative sample of the Spanish population. BMC Public Health. 2014;14.
304
6. Ong SY, Cheung CY, Li X, Lamoureux EL, Ikram MK, Ding J, et al. Visual impairment, age-related eye diseases,
305
and cognitive function: the Singapore Malay Eye study. Arch Ophthalmol. 2012;130:895–900.
306
7. Tay T, Wang JJ, Kifley A, Lindley R, Newall P, Mitchell P. Sensory and cognitive association in older persons:
307
findings from an older Australian population. Gerontology. 2006;52:386–94.
308
8. Clemons TE, Rankin MW, McBee WL, Age-Related Eye Disease Study Research Group. Cognitive impairment in
309
the Age-Related Eye Disease Study: AREDS report no. 16. Arch Ophthalmol. 2006;124:537–43.
310
9. de Kok DS, Teh RO, Pillai A, Connolly MJ, Wilkinson TJ, Moyes SA, et al. What is the relationship between visual
311
impairment and cognitive function in octogenarians? N Z Med J. 2017;130:33–47.
312
10. Diaz M, Norell M, Belkin J, Singh A, Reinhart W, Lass J. Cognitive profile of elders in an ophthalmic ambulatory
313
setting. Br J Ophthalmol. 2011;95:24–7.
314
11. Hong T, Mitchell P, Burlutsky G, Liew G, Wang JJ. Visual Impairment, Hearing Loss and Cognitive Function in an
315
Older Population: Longitudinal Findings from the Blue Mountains Eye Study. PLoS ONE. 2016;11.
316
12. Fischer ME, Cruickshanks KJ, Schubert CR, Pinto AA, Carlsson CM, Klein BEK, et al. Age-Related Sensory
317
Impairments and Risk of Cognitive Impairment. J Am Geriatr Soc. 2016;64:1981–7.
318
13. Valentijn SAM, van Boxtel MPJ, van Hooren SAH, Bosma H, Beckers HJM, Ponds RWHM, et al. Change in
319
sensory functioning predicts change in cognitive functioning: results from a 6-year follow-up in the maastricht aging
320
study. J Am Geriatr Soc. 2005;53:374–80.
321
14. Reyes-Ortiz CA, Kuo Y-F, DiNuzzo AR, Ray LA, Raji MA, Markides KS. Near vision impairment predicts
322
cognitive decline: data from the Hispanic Established Populations for Epidemiologic Studies of the Elderly. J Am
323
Geriatr Soc. 2005;53:681–6.
324
15. Sloan FA, Ostermann J, Brown DS, Lee PP. Effects of changes in self-reported vision on cognitive, affective, and
325
functional status and living arrangements among the elderly. Am J Ophthalmol. 2005;140:618–27.
326
16. Lin MY, Gutierrez PR, Stone KL, Yaffe K, Ensrud KE, Fink HA, et al. Vision impairment and combined vision and
327
hearing impairment predict cognitive and functional decline in older women. J Am Geriatr Soc. 2004;52:1996–2002.
328
17. Rogers MAM, Langa KM. Untreated poor vision: a contributing factor to late-life dementia. Am J Epidemiol.
329
2010;171:728–35.
330
18. Katon W, Pedersen HS, Ribe AR, Fenger-Grøn M, Davydow D, Waldorff FB, et al. Effect of depression and
331
diabetes mellitus on the risk for dementia: a national population-based cohort study. JAMA Psychiatry. 2015;72:612–9.
332
19. Köhler S, Buntinx F, Palmer K, van den Akker M. Depression, vascular factors, and risk of dementia in primary
333
care: a retrospective cohort study. J Am Geriatr Soc. 2015;63:692–8.
334
20. Dartigues JF, Foubert-Samier A, Le Goff M, Viltard M, Amieva H, Orgogozo JM, et al. Playing board games,
335
cognitive decline and dementia: a French population-based cohort study. BMJ Open. 2013;3:e002998.
336
21. Ivers RQ, Mitchell P, Cumming RG. Sensory impairment and driving: the Blue Mountains Eye Study. Am J Public
337
Health. 1999;89:85–87.
338
22. Laitinen A, Koskinen S, Härkänen T, Reunanen A, Laatikainen L, Aromaa A. A Nationwide Population-Based
339
Survey on Visual Acuity, Near Vision, and Self-Reported Visual Function in the Adult Population in Finland.
340
Ophthalmology. 2005;112:2227–37.
341
23. Carrière I, Delcourt C, Daien V, Pérès K, Féart C, Berr C, et al. A prospective study of the bi-directional association
342
between vision loss and depression in the elderly. J Affect Disord. 2013;151:164–70.
343
24. Hong T, Mitchell P, Burlutsky G, Gopinath B, Liew G, Wang JJ. Visual impairment and depressive symptoms in an
344
older Australian cohort: longitudinal findings from the Blue Mountains Eye Study. Br J Ophthalmol. 2015;99:1017–21.
345
25. Kiely KM, Anstey KJ, Luszcz MA. Dual sensory loss and depressive symptoms: the importance of hearing, daily
346
functioning, and activity engagement. Front Hum Neurosci. 2013;7:837.
347
26. Tsai S-Y, Cheng C-Y, Hsu W-M, Su T-PT, Liu J-H, Chou P. Association between visual impairment and
348
depression in the elderly. J Formos Med Assoc Taiwan Yi Zhi. 2003;102:86–90.
349
27. Lindenberger U, Baltes PB. Sensory functioning and intelligence in old age: a strong connection. Psychol Aging.
350
1994;9:339–55.
351
28. Baltes PB, Lindenberger U. Emergence of a powerful connection between sensory and cognitive functions across
352
the adult life span: a new window to the study of cognitive aging? Psychol Aging. 1997;12:12–21.
353
29. Armstrong RA. Alzheimer’s Disease and the Eye. J Optom. 2009;2:103–11.
354
30. 3C Study Group. Vascular factors and risk of dementia: design of the Three-City Study and baseline characteristics
355
of the study population. Neuroepidemiology. 2003;22:316–25.
356
31. Folstein MF, Folstein SE, McHugh PR. “Mini-mental state”. A practical method for grading the cognitive state of
357
patients for the clinician. J Psychiatr Res. 1975;12:189–98.
358
32. Isaacs B, Kennie AT. The Set test as an aid to the detection of dementia in old people. Br J Psychiatry J Ment Sci.
359
1973;123:467–70.
360
33. Benton A. Manuel pour l’application du test de retention visuelle. Applications cliniques et expérimentales.
361
Deuxième édition française. Paris: Centre de Psychologie Appliquée; 1965.
362
34. American Psychiatric Association. Diagnostic and Statistical Manual of Mental Disorders: DSM-IV. Washington
363
DC: American Psychiatric Association; 1994.
364
35. McKhann G, Drachman D, Folstein M, Katzman R, Price D, Stadlan EM. Clinical diagnosis of Alzheimer’s disease:
365
report of the NINCDS-ADRDA Work Group under the auspices of Department of Health and Human Services Task
366
Force on Alzheimer’s Disease. Neurology. 1984;34:939–44.
367
36. Foubert-Samier A, Catheline G, Amieva H, Dilharreguy B, Helmer C, Allard M, et al. Education, occupation,
368
leisure activities, and brain reserve: a population-based study. Neurobiol Aging. 2012;33:423.e15-25.
369
37. Akbaraly TN, Portet F, Fustinoni S, Dartigues J-F, Artero S, Rouaud O, et al. Leisure activities and the risk of
370
dementia in the elderly: results from the Three-City Study. Neurology. 2009;73:854–61.
371
38. Radloff LS. The CES-D Scale A Self-Report Depression Scale for Research in the General Population. Appl
372
Psychol Meas. 1977;1:385–401.
373
39. Fuhrer R, Rouillon F. La version française de l’échelle CES-D (Center for epidemiologic studies-depression scale).
374
Description et traduction de l’échelle d’autoévaluation. Psychiatr Psychobiol. 1989;4:163–6.
375
40. Lin FR, Metter EJ, O’Brien RJ, Resnick SM, Zonderman AB, Ferrucci L. Hearing Loss and Incident Dementia.
376
Arch Neurol. 2011;68:214–20.
377
41. Schafer JL. Multiple imputation: a primer: Stat Methods Med Res [Internet]. 2016 [cited 2018 Oct 26]; Available
378
from: http://journals.sagepub.com/doi/metrics/10.1177/096228029900800102
379
42. Bowen M, Edgar DF, Hancock B, Haque S, Shah R, Buchanan S, et al. The Prevalence of Visual Impairment in
380
People with Dementia (the PrOVIDe study). Southampton (UK): NIHR Journals Library; 2016.
381
43. Li C-M, Zhang X, Hoffman HJ, Cotch MF, Themann CL, Wilson MR. Hearing Impairment Associated With
382
Depression in US Adults, National Health and Nutrition Examination Survey 2005-2010. JAMA Otolaryngol Neck
383
Surg. 2014;140:293–302.
384
44. Cosh S, Carrière I, Daien V, Tzourio C, Delcourt C, Helmer C. Sensory loss and suicide ideation in older adults:
385
findings from the Three-City cohort study. Int Psychogeriatr. 2018;1–7.
386
45. Baker ML, Wang JJ, Rogers S, Klein R, Kuller LH, Larsen EK, et al. Early age-related macular degeneration,
387
cognitive function, and dementia: the Cardiovascular Health Study. Arch Ophthalmol Chic Ill 1960. 2009;127:667–73.
388
46. Naël V, Moreau G, Monfermé S, Cougnard-Grégoire A, Scherlen A-C, Arleo A, et al. Prevalence and Associated
389
Factors of Uncorrected Refractive Error in Older Adults in a Population-Based Study in France. JAMA Ophthalmol.
390
2018;
391
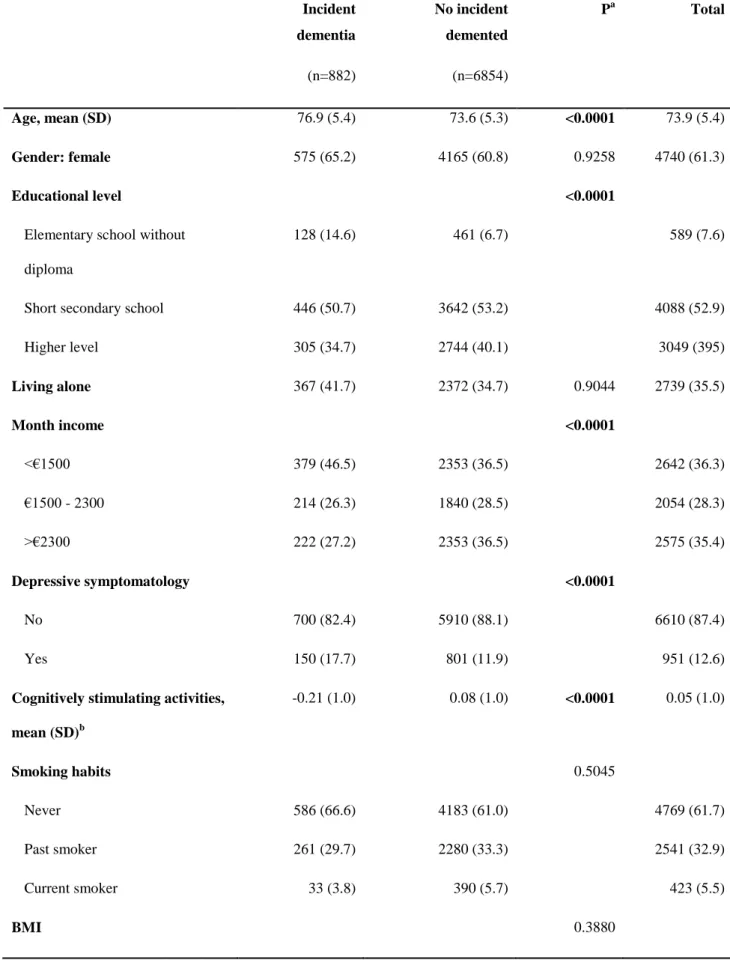
Table 1. Baseline characteristics according to incident dementia over the 12-year follow-up: The Three-City (3C)
393
cohort study (n=7736)394
Incident dementia (n=882) No incident demented (n=6854) Pa Total Age, mean (SD) 76.9 (5.4) 73.6 (5.3) <0.0001 73.9 (5.4) Gender: female 575 (65.2) 4165 (60.8) 0.9258 4740 (61.3) Educational level <0.0001Elementary school without diploma
128 (14.6) 461 (6.7) 589 (7.6)
Short secondary school 446 (50.7) 3642 (53.2) 4088 (52.9)
Higher level 305 (34.7) 2744 (40.1) 3049 (395) Living alone 367 (41.7) 2372 (34.7) 0.9044 2739 (35.5) Month income <0.0001 <€1500 379 (46.5) 2353 (36.5) 2642 (36.3) €1500 - 2300 214 (26.3) 1840 (28.5) 2054 (28.3) >€2300 222 (27.2) 2353 (36.5) 2575 (35.4) Depressive symptomatology <0.0001 No 700 (82.4) 5910 (88.1) 6610 (87.4) Yes 150 (17.7) 801 (11.9) 951 (12.6)
Cognitively stimulating activities, mean (SD)b -0.21 (1.0) 0.08 (1.0) <0.0001 0.05 (1.0) Smoking habits 0.5045 Never 586 (66.6) 4183 (61.0) 4769 (61.7) Past smoker 261 (29.7) 2280 (33.3) 2541 (32.9) Current smoker 33 (3.8) 390 (5.7) 423 (5.5) BMI 0.3880
<21 100 (11.5) 702 (10.3) 802 (10.4) 21-26.9 484 (55.7) 3861 (56.7) 4345 (56.6) 27-29.9 172 (19.8) 1338(19.6) 1510 (19.7) ≥30 113 (13.0) 910 (13.4) 1023 (13.3) Hypertension (>140/90) 700 (79.4) 5262 (76.8) 0.8041 5962 (77.1) History of stroke 40 (4.6) 147 (2.2) <0.0001 187 (2.4)
History of cardiovascular disease 74 (8.5) 410 (6.0) 0.0076 484 (6.3)
Hypercholesterolemia 0.1644 No 333 (40.4) 2818 (42.3) 3151 (42.1) Yes 492 (59.6) 3843 (57.7) 4335 (57.9) Hypertriglyceridemia 0.0030 No 648 (80.3) 5492 (83.6) 6140 (83.2) Yes 159 (19.7) 1079 (16.4) 1238 (16.8) Diabetes <0.0001 Normal glycemia 651 (80.8) 5750 (87.4) 6401 (86.7) Hyperglycemia 32 (4.0) 241 (3.7) 273 (3.7) Diabetes 123 (15.3) 589 (9.0) 712 (9.6) APOE4 carrier <0.0001 No 587 (73.1) 5306 (80.9) 5893 (80.1) Yes 216 (26.9) 1253 (19.1) 1469 (20.0) MMSE, mean (SD) 26.5 (2.1) 27. 5 (1.9) <0.0001 27.4 (1.9) Hearing loss 0.0180 No 485 (55.4) 4288 (62.8) 4773 (61.9) Mild 299 (34.1) 2080 (30.5) 2379 (30.9) Moderate to severe 92 (10.5) 462 (6.8) 554 (7.2)
No (≥20/30) 698 (79.1) 6042 (88.2) 6740 (87.1)
Mild (20/30 – 20/60) 115 (13.0) 556 (8.1) 671 (8.7)
Moderate to severe (<20/60) 69 (7.8) 256 (3.7) 325 (4.2)
Distance visual function loss 77 (8.7) 336 (4.9) 0.0014 413 (5.3)
Abbreviations: BMI= Body Mass Index; MMSE= Mini-Mental State Examination; SD= Standard Deviation;
395
Missing data: educational level (n=10), living alone (n=18), income (n=465), depressive symptomatology (n=175),
396
smoking (n=3), BMI (n=56), hypertension (n=1), stroke (n=81), hypercholesterolemia (n=250),hypertriglyceridemia
397
(n=358), diabetes (n=350), APOE4 (n=374), MMSE (n=35), hearing loss (n=30), cognitively stimulating activities
398
(n=647)
399
Unless otherwise indicated, data are expressed as n (%)
400
a
Cox models for the risk of dementia with age used as the time-scale except for age, which was tested using a 2-tailed T
401
test
402
b z-score
20
Table 2. Risk of dementia by vision loss in the first 2 years, from 2 to 4 years and beyond 4 years after inclusion: The Three-City (3C) cohort study (n=7736)
<2 years (n=698) 2-4 years (n=1311) ≥4 years (n=5727)
No of cases HR 95%CI Pa No of cases HR 95%CI Pa No of cases HR 95%CI Pa
Near visual impairment 140 149 593
No 96 Ref 113 Ref 489 Ref
Mild 27 1.63 1.06 – 2.51 0.027 20 1.15 0.71 – 1.86 0.57 68 1.00 0.77 – 1.31 0.99
Moderate to severe 17 1.95 1.16 – 3.28 0.012 16 1.82 1.07 – 3.08 0.027 36 1.34 0.95 – 1.89 0.095
Distance visual function lossb
13 1.12 0.63 – 1.99 0.70 14 1.22 0.70 – 2.13 0.48 50 1.49 1.11 – 2.00 0.008
Abbreviations: CI= Confidence Interval; HR= Hazard Ratio
a Adjusted for center, age, gender, educational level, for hearing loss, living alone, income, depressive symptomatology at baseline, smoking habits, body mass index,
hypertension, history of stroke, history of cardiovascular disease, hypercholesterolemia, hypertriglyceridemia, diabetes and APOE4 genotype
b Separate models
Table 3. Risk of dementia by vision loss, with supplementary adjustment for engagement in cognitively stimulating activities: The Three-City (3C) cohort study (n=7089)
<2 years (n=611) 2-4 years (n=1190) ≥4 years (n=5288)
No of cases HR 95%CI Pa No of cases HR 95%CI Pa No of cases HR 95%CI Pa
21
Model A without adjustment for cognitively stimulating activities
a.bNear visual impairment 107 125 518
No 76 Ref 97 Ref 440 Ref
Mild 19 1.71 1.03 – 2.84 0.038 14 1.09 0.62 – 1.92 0.75 49 0.95 0.70 – 1.28 0.73
Moderate to severe 12 1.86 1.01 – 3.44 0.048 14 2.00 1.14 – 3.53 0.016 29 1.34 0.91 – 1.96 0.14
Distance visual function lossc
10 1.19 0.62 – 2.29 0.60 10 1.06 0.55 – 2.02 0.87 42 1.52 1.11 – 2.09 0.010
Model B + adjustment for cognitively stimulating activities
bNear visual impairment 107 125 518
No 76 Ref 97 Ref 440 Ref
Mild 19 1.69 1.02 – 2.81 0.042 14 1.07 0.61 – 1.88 0.81 49 0.94 0.70 – 1.28 0.70
Moderate to severe 12 1.71 0.92 – 3.16 0.087 14 1.84 1.05 – 3.25 0.035 29 1.27 0.87 – 1.86 0.22
Distance visual function lossc
10 1.09 0.57 – 2.10 0.80 10 0.98 0.51 – 1.88 0.95 42 1.42 1.03 – 1.95 0.032
Abbreviations: CI= Confidence Interval; HR= Hazard Ratio
a
Model re-run among participants without missing data on cognitively stimulating activities
b Model adjusted for center, age, gender, educational level, hearing loss, living alone, income, smoking habits, body mass index, hypertension, history of stroke, history of
cardiovascular disease, hypercholesterolemia, hypertriglyceridemia, diabetes and APOE4 genotype
22
Table 4. Risk of dementia stratified by depressive symptomatology: The Three-City (3C) cohort study (n=7561)
No depressive symptoms (n=6610)
<2 years (n=552) 2-4 years (n=1080) ≥4 years (n=4978)
No of cases HR 95%CI Pa No of cases HR 95%CI Pa No of cases HR 95%CI Pa
Near visual impairment 100 113 487
No 71 Ref 86 Ref 406 Ref
Mild 20 1.62 0.98 – 2.68 0.06 16 1.18 0.69 – 2.03 0.54 58 1.02 0.76 – 1.36 0.90
Moderate to severe 9 1.48 0.73 – 2.97 0.28 11 1.70 0.90 – 3.20 0.10 23 1.07 0.70 – 1.63 0.77
Distance visual function lossb
6 0.80 0.35 – 1.83 0.60 10 1.26 0.66 – 2.42 0.49 35 1.25 0.88 – 1.77 0.22
Depressive symptoms (n=951)
<2 years (n=115) 2-4 years (n=193) ≥4 years (n=643)
No of cases HR 95%CI Pa No of cases HR 95%CI Pa No of cases HR 95%CI Pa
Near visual impairment 30 28 92
No 19 Ref 21 Ref 73 Ref
Mild 6 2.11 0.83 – 5.39 0.12 3 1.07 0.31 – 3.63 0.92 10 1.18 0.59 – 2.37 0.65
23
Distance visual function lossb
4 1.09 0.37 – 3.17 0.88 4 1.29 0.44 – 3.83 0.64 13 2.83 1.52 – 5.28 0.001
Abbreviations: CI= Confidence Interval; HR= Hazard Ratio
a Adjusted for center, age, gender, educational level, for hearing loss, living alone, income, depressive symptomatology at baseline, smoking habits, body mass index,
hypertension, history of stroke, history of cardiovascular disease, hypercholesterolemia, hypertriglyceridemia, diabetes and APOE4 genotype
24
Supplementary Table 1. Risk of dementia by vision loss in the first 2 years, from 2 to 4 years and beyond 4 years after inclusion with supplementary adjustment for baseline cognitive performance: The Three-City (3C) cohort study (n=7557)
<2 years (n=672) 2-4 years (n=1282) ≥4 years (n=5603)
No of cases HR 95%CI Pa No of cases HR 95%CI Pa No of cases HR 95%CI Pa
Near visual impairmentb 135 146 568
No 94 Ref 110 Ref 473 Ref
Mild 26 1.52 0.98 – 2.36 0.06 20 1.12 0.69 – 1.81 0.65 66 0.96 0.73 – 1.25 0.75
Moderate to severe 15 1.77 1.02 – 3.07 0.042 16 2.11 1.24 – 3.58 0.006 29 1.29 0.88 – 1.89 0.20
Distance visual function lossb
11 0.89 0.48 – 1.65 0.71 14 1.14 0.65 – 2.00 0.64 40 1.30 0.94 – 1.81 0.11 Abbreviations: HR= Hazard Ratio; CI= Confidence Interval
a
Adjusted for center, age, gender, educational level, hearing loss, living alone, income, smoking habits, body mass index, hypertension, history of stroke, history of cardiovascular disease, hypercholesterolemia, hypertriglyceridemia, diabetes, APOE4 genotype and baseline cognitive performance (computed as a Z-score based on Mini Mental State Examination, Isaacs Set Test and Benton Visual Retention Test)
25
Supplementary Table 2. Risk of dementia by vision loss in the first 4 years, from 4 to 7 years and beyond 7 years after inclusion: The Three-City (3C) cohort study (n=7736)
<4 years (n=2009) 4-7 years (n=902) ≥7 years (n=4825)
No of cases HR 95%CI Pa No of cases HR 95%CI Pa No of cases HR 95%CI Pa
Near visual impairment 289 331 262
No 209 Ref 276 Ref 213 Ref
Mild 47 1.38 1.00 – 1.91 0.0504 35 0.88 0.62 – 1.26 0.50 33 1.17 0.81 – 1.70 0.41
Moderate to severe 33 1.88 1.29 – 2.73 0.001 20 1.22 0.77 – 1.93 0.39 16 1.52 0.91 – 2.53 0.11
Distance visual function lossb
27 1.17 0.79 – 1.75 0.44 29 1.45 0.99 – 2.12 0.0597 21 1.55 0.99 – 2.44 0.0547 Abbreviations: CI= Confidence Interval; HR= Hazard Ratio
a
Adjusted for center, age, gender, educational level, for hearing loss, living alone, income, depressive symptomatology at baseline, smoking habits, body mass index, hypertension, history of stroke, history of cardiovascular disease, hypercholesterolemia, hypertriglyceridemia, diabetes and APOE4 genotype