HAL Id: hal-01118620
https://hal-univ-rennes1.archives-ouvertes.fr/hal-01118620
Submitted on 19 Feb 2015
HAL is a multi-disciplinary open access
archive for the deposit and dissemination of
sci-entific research documents, whether they are
pub-lished or not. The documents may come from
teaching and research institutions in France or
abroad, or from public or private research centers.
L’archive ouverte pluridisciplinaire HAL, est
destinée au dépôt et à la diffusion de documents
scientifiques de niveau recherche, publiés ou non,
émanant des établissements d’enseignement et de
recherche français ou étrangers, des laboratoires
publics ou privés.
Exacerbation in Greater Strasbourg (France)
Metropolitan Area: the PAISA Study
Denis Bard, Olivier Laurent, Sabrina Havard, Séverine Deguen, Gaelle
Pedrono, Laurent Filleul, Claire Segala, Agnes Lefranc, Charles Schillinger,
Emmanuel Riviere
To cite this version:
Denis Bard, Olivier Laurent, Sabrina Havard, Séverine Deguen, Gaelle Pedrono, et al.. Ambient Air
Pollution, Social Inequalities and Asthma Exacerbation in Greater Strasbourg (France) Metropolitan
Area: the PAISA Study. Vanda Villanyi. Air Pollution, Intech, 2010, 978-953-307-143-5.
�hal-01118620�
Ambient air pollution, social inequalities and asthma exacerbation in
Greater Strasbourg (France) metropolitan area: The PAISA study
D. Bard, O. Laurent, S. Havard, S. Deguen, G. Pedrono, L. Filleul, C. Segala, A. Lefranc, C. Schillinger and E. RivièreX
Ambient air pollution, social inequalities and
asthma exacerbation in Greater Strasbourg
(France) metropolitan area: The PAISA study
D. Bard
1, O. Laurent
1,2, S. Havard
1,3, S. Deguen
1, G. Pedrono
4, L. Filleul
5,
C. Segala
4, A. Lefranc
6, C. Schillinger
7and E. Rivière
71
Département d’Epidémiologie et de Recherche Clinique, École des Hautes Études en Santé
Publique, Rennes
2
LEPID, Institut de Radioprotection et de Sûreté Nucléaire, Fontenay aux Roses
3INSERM U 707, Paris
4
SEPIA-santé, Baud
5CIRE Aquitaine, Institut national de Veille Sanitaire, Bordeaux
6DSE, Institut national de Veille Sanitaire, Saint Maurice
7Association pour la Surveillance et l'Etude de laPollution Atmosphérique en Alsace,
Schiltigheim
1. Introduction
The socio-economic status (SES) of populations has an influence on the incidence or mortality rates of numerous health outcomes, among which respiratory diseases (Prescott et al., 2003; Ellison-Loschmann et al., 2007). Considering asthma, the possible contribution of SES to overall prevalence –regardless of asthma severity-, remains controversial in industrialized countries. Several studies indicate that allergic asthma is more prevalent in more well-off populations whereas the non-allergic forms of asthma are more common in the deprived ones (Cesaroni et al., 2003; Blanc et al., 2006). On the other hand, severe asthma whatever its etiology appears to be more frequent in the latter populations, as compared to the more affluent (Basagana et al., 2004). Risk factors for exacerbations (e.g., passive smoking (Wright Subramanian, 2007), psychosocial stress (Gold & Wright, 2005), cockroach allergens (Kitch et al., 2000), and suboptimal compliance with anti-inflammatory medication (Gottlieb et al., 1995)) are generally more common among people with asthma and low SES than their better-off counterparts. These observations support the hypothesis that some factors more present in deprived populations contribute to asthma exacerbation (Mielck et al., 1996). One candidate factor is ambient air pollution, a well-demonstrated risk factor for asthma (Samet & Krewski, 2007). Epidemiologic studies report short-term associations (latency of several hours to several days) between exposure to air pollutants (particulate matter,
nitrogen dioxide [NO2], sulfur dioxide, and ozone [O3]) and various asthma attack
indicators routinely available: hospitalization (Sunyer et al., 1997), emergency department (ED) visits (Romeo et al., 2006), calls to mobile emergency medical service networks (Medina
15
et al., 1997) and visits to doctors’ offices for asthma attacks (Hajat et al., 1999). Associations are also reported with indicators measured directly in individuals with asthma: respiratory
symptoms and consumption of short-acting -agonist (SABA) drugs (von Klot et al., 2002;
Schildcrout et al., 2006).
It should be stressed that in such studies, be they time series (Sunyer et al., 1997), case-crossover (Jalaludin et al., 2008), or panel (Ward & Ayres, 2004; Romeo et al., 2006) studies, investigators average citywide ambient pollutant concentrations for estimating exposure, although these concentrations often vary spatially and strongly within cities (Jerrett et al., 2005a), with few exceptions (Tolbert et al., 2000; Neidell, 2004; Erbas et al., 2005). Failure to consider these spatial variations at the sub-city level can lead to exposure misclassification and resulting bias (Jerrett et al., 2005a). Conversely, taking these spatial variations into account in studying the relations between air pollution and health would allow more
rigorous measurement of the magnitude of these relations (Jerrett et al., 2005a). Another
problem inherent in ecologic studies is spatial autocorrelation, which expresses the non-independence of geographic observations (Haynes et al., 2001). With very rare exceptions (Jerrett et al., 2001; Buzzelli et al., 2003), studies of environmental equity do not consider this phenomenon, although it is essential to avoid violating the hypotheses that underlie the application of statistical models, and may thus lead to erroneous conclusions about associations.
Another key issue is identification of the populations most susceptible to air pollution and the precise measurement of exposure-response relations in these subsets (Maynard et al., 2003; Samet & Krewski, 2007). Several studies show that some specific populations, such as children, the elderly, and people with chronic diseases, including people with diabetes and chronic obstructive pulmonary disease, are more susceptible to air pollution than the general population (Annesi-Maesano et al., 2003; Samet & Krewski, 2007). Some suspect that socioeconomic deprivation influences the relations between air pollution and health (O'Neill et al., 2003). Many investigators have tested this hypothesis with regard to mortality, and their overall results suggest the existence of larger relative risks for more deprived populations (Laurent et al., 2007). Substantially fewer researchers have tested this hypothesis with regard to asthma attacks (Norris et al., 1999; Lin et al., 2004; Neidell, 2004), and the few that have done so have considered socioeconomic indicators measured at resolutions ranging from the individual level (Neidell, 2004; Kim et al., 2007) to the level of geographic residence areas of various sizes (Nauenberg & Basu, 1999; Norris et al., 1999; Lin et al., 2004; Son et al., 2006; Kim et al., 2007). Whether or not a socioeconomic indicator is an effect modifier, however, may well depend on the resolution at which it is measured (Laurent et al., 2007). To our knowledge, only two studies have tested the influence of socioeconomic indicators measured at the level of small areas (Canadian enumeration areas (Lin et al., 2004)and US zip codes (Neidell, 2004) on the short-term relations between air pollution and asthma attacks. Disadvantaged people may be more susceptible to asthma attacks when they face additional environmental insults, such as ambient air pollution (Maynard et al., 2003). Nonetheless, the few studies (Nauenberg & Basu, 1999; Annesi-Maesano et al., 2003; Maynard et al., 2003; O'Neill et al., 2003; Lin et al., 2004; Laurent et al., 2007) that have tested this hypothesis have produced divergent results. This may be because the distribution according to SES of factors modulating the relations between air pollution and asthma morbidity differs between the study settings or because of lack of statistical power.
In the absence of individual data, which are not generally routinely available, ecological (or contextual) measures of SES are frequently used to describe health inequalities. Although some epidemiological studies are based on only one socioeconomic indicator (income, educational level, or occupation), e.g. (Kunst et al., 1998; Finkelstein et al., 2003), SES is usually recognized as complex and multidimensional, integrating different components that may be either material (e.g., housing conditions, income, or occupation), social (e.g., social position or isolation, or family support) or both (Folwell, 1995; Braveman et al., 2005). Area-based deprivation indices for the measurement of the economic or social disadvantages of urban areas were proposed in the 1980s (Townsend, 1987). Initially designed for health care planning and resource allocation, they have been recently used to evaluate and analyse health inequalities (Carstairs, 1995; Niggebrugge et al., 2005; Eibner Sturm, 2006). These measures, including Townsend’s, Carstairs’, and Jarman’s indices, as well as the more recent Index of Multiple Deprivation, combine contextual indicators such as unemployment rate or proportions of overcrowded or of non-owner-occupied households (Jarman, 1983; Townsend et al., 1988; Carstairs & Morris, 1991; DETR, 2000). Since the end of the 1990s, numerous other area-based deprivation indices have emerged – in the United States (Singh, 2003; Eibner & Sturm, 2006; Messer et al., 2006), Canada (Pampalon & Raymond, 2000), New Zealand (Salmond et al., 1998), Japan (Fukuda et al., 2007), Italy (Tello et al., 2005), Spain (Benach & Yasui, 1999), and Belgium (Lorant, 2000). Hospitalizations or emergency department visits reflect severe asthma exacerbation episodes. As to increase sensitivity, alternative indicators integrating less severe events may be used, such as telephone calls to medical services or asthma exacerbation specific drugs. Naureckas et al. (Naureckas et al., 2005) showed that SABA sales are valuable indicators of asthma morbidity and its temporal variability. These sales are especially good predictors of the risk of emergency department visits and hospitalization for asthma attacks in the days immediately afterwards (Naureckas et al., 2005). Moreover, they generally reflect less severe morbidity states than those requiring emergency department visits or hospitalizations and are therefore very sensitive indicators. Finally, they are very common, likely to involve large numbers of individuals, even within small geographic units and short observation periods (Pitard et al., 2004; Naureckas et al., 2005). While SABA drugs are the treatment of choice for asthma attacks (Global Initiative for Asthma, 2007), they are also prescribed for acute exacerbation of chronic obstructive pulmonary disorders (COPD) (Urbano & Pascual, 2005). Nevertheless, this disease is rare in people less than 40 years old (Viegi et al., 2007); within this age group, SABA prescriptions and sales are therefore very specific for asthma attacks. The PAISA study objectives were to investigate the short-term relations between air pollution estimated at the level of small geographic areas and asthma attacks and to test the influence of socioeconomic deprivation, also measured at this level, on these relations. Two different, although related, indicators were tested, that is i) calls for emergency services for asthma exacerbation and ii) SABA drugs deliveries.
2. Methods
2.1 Setting and statistical unit
The setting of our study was the Strasbourg metropolitan area (SMA), gathering
municipalities (316 km2) with a population of about 450,000 inhabitants located in the
North-et al., 1997) and visits to doctors’ offices for asthma attacks (Hajat North-et al., 1999). Associations are also reported with indicators measured directly in individuals with asthma: respiratory
symptoms and consumption of short-acting -agonist (SABA) drugs (von Klot et al., 2002;
Schildcrout et al., 2006).
It should be stressed that in such studies, be they time series (Sunyer et al., 1997), case-crossover (Jalaludin et al., 2008), or panel (Ward & Ayres, 2004; Romeo et al., 2006) studies, investigators average citywide ambient pollutant concentrations for estimating exposure, although these concentrations often vary spatially and strongly within cities (Jerrett et al., 2005a), with few exceptions (Tolbert et al., 2000; Neidell, 2004; Erbas et al., 2005). Failure to consider these spatial variations at the sub-city level can lead to exposure misclassification and resulting bias (Jerrett et al., 2005a). Conversely, taking these spatial variations into account in studying the relations between air pollution and health would allow more
rigorous measurement of the magnitude of these relations (Jerrett et al., 2005a). Another
problem inherent in ecologic studies is spatial autocorrelation, which expresses the non-independence of geographic observations (Haynes et al., 2001). With very rare exceptions (Jerrett et al., 2001; Buzzelli et al., 2003), studies of environmental equity do not consider this phenomenon, although it is essential to avoid violating the hypotheses that underlie the application of statistical models, and may thus lead to erroneous conclusions about associations.
Another key issue is identification of the populations most susceptible to air pollution and the precise measurement of exposure-response relations in these subsets (Maynard et al., 2003; Samet & Krewski, 2007). Several studies show that some specific populations, such as children, the elderly, and people with chronic diseases, including people with diabetes and chronic obstructive pulmonary disease, are more susceptible to air pollution than the general population (Annesi-Maesano et al., 2003; Samet & Krewski, 2007). Some suspect that socioeconomic deprivation influences the relations between air pollution and health (O'Neill et al., 2003). Many investigators have tested this hypothesis with regard to mortality, and their overall results suggest the existence of larger relative risks for more deprived populations (Laurent et al., 2007). Substantially fewer researchers have tested this hypothesis with regard to asthma attacks (Norris et al., 1999; Lin et al., 2004; Neidell, 2004), and the few that have done so have considered socioeconomic indicators measured at resolutions ranging from the individual level (Neidell, 2004; Kim et al., 2007) to the level of geographic residence areas of various sizes (Nauenberg & Basu, 1999; Norris et al., 1999; Lin et al., 2004; Son et al., 2006; Kim et al., 2007). Whether or not a socioeconomic indicator is an effect modifier, however, may well depend on the resolution at which it is measured (Laurent et al., 2007). To our knowledge, only two studies have tested the influence of socioeconomic indicators measured at the level of small areas (Canadian enumeration areas (Lin et al., 2004)and US zip codes (Neidell, 2004) on the short-term relations between air pollution and asthma attacks. Disadvantaged people may be more susceptible to asthma attacks when they face additional environmental insults, such as ambient air pollution (Maynard et al., 2003). Nonetheless, the few studies (Nauenberg & Basu, 1999; Annesi-Maesano et al., 2003; Maynard et al., 2003; O'Neill et al., 2003; Lin et al., 2004; Laurent et al., 2007) that have tested this hypothesis have produced divergent results. This may be because the distribution according to SES of factors modulating the relations between air pollution and asthma morbidity differs between the study settings or because of lack of statistical power.
In the absence of individual data, which are not generally routinely available, ecological (or contextual) measures of SES are frequently used to describe health inequalities. Although some epidemiological studies are based on only one socioeconomic indicator (income, educational level, or occupation), e.g. (Kunst et al., 1998; Finkelstein et al., 2003), SES is usually recognized as complex and multidimensional, integrating different components that may be either material (e.g., housing conditions, income, or occupation), social (e.g., social position or isolation, or family support) or both (Folwell, 1995; Braveman et al., 2005). Area-based deprivation indices for the measurement of the economic or social disadvantages of urban areas were proposed in the 1980s (Townsend, 1987). Initially designed for health care planning and resource allocation, they have been recently used to evaluate and analyse health inequalities (Carstairs, 1995; Niggebrugge et al., 2005; Eibner Sturm, 2006). These measures, including Townsend’s, Carstairs’, and Jarman’s indices, as well as the more recent Index of Multiple Deprivation, combine contextual indicators such as unemployment rate or proportions of overcrowded or of non-owner-occupied households (Jarman, 1983; Townsend et al., 1988; Carstairs & Morris, 1991; DETR, 2000). Since the end of the 1990s, numerous other area-based deprivation indices have emerged – in the United States (Singh, 2003; Eibner & Sturm, 2006; Messer et al., 2006), Canada (Pampalon & Raymond, 2000), New Zealand (Salmond et al., 1998), Japan (Fukuda et al., 2007), Italy (Tello et al., 2005), Spain (Benach & Yasui, 1999), and Belgium (Lorant, 2000). Hospitalizations or emergency department visits reflect severe asthma exacerbation episodes. As to increase sensitivity, alternative indicators integrating less severe events may be used, such as telephone calls to medical services or asthma exacerbation specific drugs. Naureckas et al. (Naureckas et al., 2005) showed that SABA sales are valuable indicators of asthma morbidity and its temporal variability. These sales are especially good predictors of the risk of emergency department visits and hospitalization for asthma attacks in the days immediately afterwards (Naureckas et al., 2005). Moreover, they generally reflect less severe morbidity states than those requiring emergency department visits or hospitalizations and are therefore very sensitive indicators. Finally, they are very common, likely to involve large numbers of individuals, even within small geographic units and short observation periods (Pitard et al., 2004; Naureckas et al., 2005). While SABA drugs are the treatment of choice for asthma attacks (Global Initiative for Asthma, 2007), they are also prescribed for acute exacerbation of chronic obstructive pulmonary disorders (COPD) (Urbano & Pascual, 2005). Nevertheless, this disease is rare in people less than 40 years old (Viegi et al., 2007); within this age group, SABA prescriptions and sales are therefore very specific for asthma attacks. The PAISA study objectives were to investigate the short-term relations between air pollution estimated at the level of small geographic areas and asthma attacks and to test the influence of socioeconomic deprivation, also measured at this level, on these relations. Two different, although related, indicators were tested, that is i) calls for emergency services for asthma exacerbation and ii) SABA drugs deliveries.
2. Methods
2.1 Setting and statistical unit
The setting of our study was the Strasbourg metropolitan area (SMA), gathering
municipalities (316 km2) with a population of about 450,000 inhabitants located in the
North-Eastern France. The statistical small-area unit used was the French census residential block (Ilots Regroupés pour l’Information Statistique-IRIS), a submunicipal division devised by the National Institute for Statistics and Economic Studies (INSEE). This unit is the smallest geographic area in France for which socioeconomic and demographic information from the national census is available. It is, in terms of population size, intermediate between US census tracts (about 4,000 inhabitants) and US census block groups (about 1,000 inhabitants) with an average number of inhabitants of 2,000. The division of neighborhoods into census blocks takes into account the physical obstacles that may break up urban landscapes (important traffic arteries, bodies of water, green spaces, etc.) and aims to maximize their homogeneity in population size, socioeconomic characteristics, land use and zoning. The
SMA is subdivided into 190 blocks, with areas ranging from 0.05 km2 to 19.6 km2 (median
values of 0.45 km2 for the entire SMA and 0.29 km2 for the city center). Fifteen blocks
covering a very small population (250 people, altogether 0.2 percent of the total population) were removed from the study because of confidentiality rules in force in France.
2.2 Socioeconomic Status Indicator
The demographic and socioeconomic data come from the 1999 national population census, conducted by INSEE. The census database is structured into different domains, including employment, family and household, educational level, housing, immigration status, and income; together these regroup a collection of very diverse quantitative variables, such as proportions of unemployed people, foreigners, blue-collar workers, households without cars, people aged 15 years or older with general or vocational maturity certificates, etc. Accordingly, we selected 52 variables from the available data, endeavoring to apply theoretical concepts of deprivation (Krieger et al., 1997), relying on the indicators most often used in the literature (Morris & Carstairs, 1991; Pampalon & Raymond, 2000; Challier & Viel, 2001; Jordan et al., 2004), and using the same definitions as INSEE most often uses in its studies. All but 2 of the 52 variables were proportions (the exceptions were mean number of people per room and median income per consumption unit). Some variables, intentionally redundant, were introduced into the analysis to determine statistically the most discriminating for characterizing deprivation (e.g., unemployment among total labor force, among men, among women).
Constructing the index
We developed the socioeconomic deprivation index by principal component analysis (PCA) of the 52 variables. All variables were first standardized (i.e. centered and reduced) to remove the influence of different units of measure and thus to give them the same weight in the analysis. This statistical technique permits the synthesis of information contained in a great number of variables by constructing new and independent synthetic variables – the principal components. These new variables are linear combinations of some of the initial variables, defined by a maximum variance. The principal advantage of this method is that it makes it possible to consider relations between the variables, by attributing to each a weight that takes the relations into account (that is, treating them as coefficients of the linear combinations).
In our study, to facilitate the use of the deprivation index in a public health context, we chose to construct a single index for all the blocks to maximizing the variance of the first principal component. Several consecutive PCA were thus performed to conserve only the variables most strongly correlated with the first component and contributing most to its
construction. If two redundant variables were conserved, only the one most closely correlated with the first component was finally retained (and in each case, that turned out to be the variable not stratified by sex). Finally, this first component, used as our socioeconomic deprivation index, was calculated for each block, as the linear combination of the final variables retained.
To obtain the most discriminant cartographic representation of socioeconomic disparities, the blocks were grouped into five classes of index values, approximately equivalent to the quintiles (Beguin & Pumain, 1994). The first class comprised the least deprived blocks and the fifth the most deprived blocks. The choropleth mapping of the index was performed with the Geographic Information System ArcView™ v. 9.1 (ESRI Inc., Redlands, CA, USA).
Index validity
According to Coste et al. (1995) (Coste et al., 1995), several criteria make it possible to judge the validity of composite measurement scales (in our case, a socioeconomic deprivation index), in particular, its content validity and its construct validity (Fermanian, 1996). Content validity is assessed by the extent to which the items composing the scale or index are relevant to and representative of all of the possible items that can describe the phenomenon measured. To select the initial subset of variables for analysis, we carefully ensured that each census domain (income, job, housing, family and household, etc.) was represented by at least one variable, and again at the end we verified this representativeness for all of the final variables.
Construct validity verifies that from a theoretical point of view the instrument is associated with the concept it is supposed to measure. It tests the relations between the index variables, both internally (factorial validity and internal consistency) and externally (convergent validity), and thus identifies more precisely the real meaning of the concept measured by the indicator. The internal validity of our index was estimated with the results of the PCA and Cronbach’s alpha coefficient. This coefficient judges how the variables retained by the PCA measure a one-dimensional concept – here, socioeconomic deprivation. The closer the coefficient value is to one, the better the verification that the index variables are homogenous. The convergent validity was tested using Pearson’s correlation coefficients with the most widely used British indices (those of Carstairs and Townsend) (Townsend et al., 1988; Carstairs & Morris, 1991). These indices combine four variables, three common to both: (1) proportion of unemployed, (2) proportion of households without a car, and (3) proportion of over- crowded households. Townsend’s index also includes the concept of rental versus owner-occupied housing (proportion of non-owner-occupied housing) while Carstairs’ index considers a variable related to the household head’s place in the British social scale (proportion of households in which the householder belongs to social classes 4 or 5). These indices were compiled at the census block level by adapting or translating some British variables when they had no direct correspondence in the French census database (for example, the variable ‘‘proportion of households in which the householder belongs to social class 4 or 5’’ was translated for the French census database as ‘‘the proportion of blue-collar workers’’).
Index reliability
To test the robustness of our index, the same methodological procedure as that used for the SMA (the same 52 initial variables, same algorithm decision for the final choice of variables, the same tests of validity) was conducted for another French metropolitan area at the
Eastern France. The statistical small-area unit used was the French census residential block (Ilots Regroupés pour l’Information Statistique-IRIS), a submunicipal division devised by the National Institute for Statistics and Economic Studies (INSEE). This unit is the smallest geographic area in France for which socioeconomic and demographic information from the national census is available. It is, in terms of population size, intermediate between US census tracts (about 4,000 inhabitants) and US census block groups (about 1,000 inhabitants) with an average number of inhabitants of 2,000. The division of neighborhoods into census blocks takes into account the physical obstacles that may break up urban landscapes (important traffic arteries, bodies of water, green spaces, etc.) and aims to maximize their homogeneity in population size, socioeconomic characteristics, land use and zoning. The
SMA is subdivided into 190 blocks, with areas ranging from 0.05 km2 to 19.6 km2 (median
values of 0.45 km2 for the entire SMA and 0.29 km2 for the city center). Fifteen blocks
covering a very small population (250 people, altogether 0.2 percent of the total population) were removed from the study because of confidentiality rules in force in France.
2.2 Socioeconomic Status Indicator
The demographic and socioeconomic data come from the 1999 national population census, conducted by INSEE. The census database is structured into different domains, including employment, family and household, educational level, housing, immigration status, and income; together these regroup a collection of very diverse quantitative variables, such as proportions of unemployed people, foreigners, blue-collar workers, households without cars, people aged 15 years or older with general or vocational maturity certificates, etc. Accordingly, we selected 52 variables from the available data, endeavoring to apply theoretical concepts of deprivation (Krieger et al., 1997), relying on the indicators most often used in the literature (Morris & Carstairs, 1991; Pampalon & Raymond, 2000; Challier & Viel, 2001; Jordan et al., 2004), and using the same definitions as INSEE most often uses in its studies. All but 2 of the 52 variables were proportions (the exceptions were mean number of people per room and median income per consumption unit). Some variables, intentionally redundant, were introduced into the analysis to determine statistically the most discriminating for characterizing deprivation (e.g., unemployment among total labor force, among men, among women).
Constructing the index
We developed the socioeconomic deprivation index by principal component analysis (PCA) of the 52 variables. All variables were first standardized (i.e. centered and reduced) to remove the influence of different units of measure and thus to give them the same weight in the analysis. This statistical technique permits the synthesis of information contained in a great number of variables by constructing new and independent synthetic variables – the principal components. These new variables are linear combinations of some of the initial variables, defined by a maximum variance. The principal advantage of this method is that it makes it possible to consider relations between the variables, by attributing to each a weight that takes the relations into account (that is, treating them as coefficients of the linear combinations).
In our study, to facilitate the use of the deprivation index in a public health context, we chose to construct a single index for all the blocks to maximizing the variance of the first principal component. Several consecutive PCA were thus performed to conserve only the variables most strongly correlated with the first component and contributing most to its
construction. If two redundant variables were conserved, only the one most closely correlated with the first component was finally retained (and in each case, that turned out to be the variable not stratified by sex). Finally, this first component, used as our socioeconomic deprivation index, was calculated for each block, as the linear combination of the final variables retained.
To obtain the most discriminant cartographic representation of socioeconomic disparities, the blocks were grouped into five classes of index values, approximately equivalent to the quintiles (Beguin & Pumain, 1994). The first class comprised the least deprived blocks and the fifth the most deprived blocks. The choropleth mapping of the index was performed with the Geographic Information System ArcView™ v. 9.1 (ESRI Inc., Redlands, CA, USA).
Index validity
According to Coste et al. (1995) (Coste et al., 1995), several criteria make it possible to judge the validity of composite measurement scales (in our case, a socioeconomic deprivation index), in particular, its content validity and its construct validity (Fermanian, 1996). Content validity is assessed by the extent to which the items composing the scale or index are relevant to and representative of all of the possible items that can describe the phenomenon measured. To select the initial subset of variables for analysis, we carefully ensured that each census domain (income, job, housing, family and household, etc.) was represented by at least one variable, and again at the end we verified this representativeness for all of the final variables.
Construct validity verifies that from a theoretical point of view the instrument is associated with the concept it is supposed to measure. It tests the relations between the index variables, both internally (factorial validity and internal consistency) and externally (convergent validity), and thus identifies more precisely the real meaning of the concept measured by the indicator. The internal validity of our index was estimated with the results of the PCA and Cronbach’s alpha coefficient. This coefficient judges how the variables retained by the PCA measure a one-dimensional concept – here, socioeconomic deprivation. The closer the coefficient value is to one, the better the verification that the index variables are homogenous. The convergent validity was tested using Pearson’s correlation coefficients with the most widely used British indices (those of Carstairs and Townsend) (Townsend et al., 1988; Carstairs & Morris, 1991). These indices combine four variables, three common to both: (1) proportion of unemployed, (2) proportion of households without a car, and (3) proportion of over- crowded households. Townsend’s index also includes the concept of rental versus owner-occupied housing (proportion of non-owner-occupied housing) while Carstairs’ index considers a variable related to the household head’s place in the British social scale (proportion of households in which the householder belongs to social classes 4 or 5). These indices were compiled at the census block level by adapting or translating some British variables when they had no direct correspondence in the French census database (for example, the variable ‘‘proportion of households in which the householder belongs to social class 4 or 5’’ was translated for the French census database as ‘‘the proportion of blue-collar workers’’).
Index reliability
To test the robustness of our index, the same methodological procedure as that used for the SMA (the same 52 initial variables, same algorithm decision for the final choice of variables, the same tests of validity) was conducted for another French metropolitan area at the
resolution of the census block – the Lille metropolitan area (LMA). The LMA was selected because its demographic and socioeconomic characteristics are quite distinct from those of the SMA (e.g., 489 census blocks for a total population around 1,100,000 inhabitants). The objective of this stage was to demonstrate that similar results could be obtained in a different part of France and to show that the variables selected for the construction of the index were independent of the study area and characterized socioeconomic level in as discriminating a manner as possible.
Application
Census blocks were divided into five deprivation categories according to their index value; the first category comprised the most privileged blocks and the fifth the most deprived ones. More details can be found in (Havard et al., 2008).
Calls to emergency medical services for asthma exacerbation
The two mobile emergency and healthcare networks operating in the SMA (Service d’Aide Médicale d’Urgence (SAMU) and SOS Médecins provided data about emergency telephone calls made to physicians for asthma attacks. The Bas-Rhin emergency medical services unit (SAMU 67) is a public service that coordinates pre- hospital emergency medical services. SOS Médecins of Strasbourg is a private service providing emergency general medical care. We included each call regarding an asthma attack that reached either SAMU or SOS Médecins from January 1, 2000, to December 31, 2005. The two databases were merged, duplicates being excluded. Each call was geo-coded to the census block where the patient was located at the time of the call, based on the postal address. Only 2 percent of the calls could not be geocoded; they were excluded from the analysis.
SABA sales
The data about SABA sales to people living in the SMA during 2004 came from four health insurance funds: the regional union of health insurance funds (Union Régionale des Caisses d’Assurance Maladie [URCAM], for salaried workers and very low-income families), agricultural social insurance fund (Mutualité Sociale Agricole [MSA], for farmers and similar workers), the fund for self-employed workers (Régime Social des Indépendants [RSI]), and the Lorraine students’ insurance fund (Mutuelle Générale des Etudiants de Lorraine [MGEL]). These funds cover >90% of the local population (Com-Ruelle et al.). In 2004, these funds either paid or reimbursed (fully or partially) all SABA sales prescribed by a physician. All records of SABA sales in pharmacies were extracted from the databases of these four insurance funds by requests for code R3A4 of the European Pharmaceutical Market Research Association nomenclature (Tollier et al., 2005). The following information was furnished for each sale: date, age group (0 to 9, 10 to 19, 20 to 39 years), sex, and census block of residence of the person for which SABA were prescribed. All sales were combined into a single file for analysis.
Ambient air pollution
Hourly ambient concentrations of particulate matter less than 10 m in aerodynamic diameter
(PM10), nitrogen dioxide, sulfur dioxide, and ozone were modeled by the local air quality
monitoring association (Association pour la Surveillance et l’Etude de la Pollution Atmosphérique en Alsace, Schiltigheim) for each block during the entire study period (Bard et al., 2007). Modeling was conducted with Atmospheric Dispersion Modeling System (ADMS-Urban), a deterministic Gaussian dispersion model (McHugh et al., 1997) that integrates emissions inventories, meteorological data (wind direction and speed, temperature and cloudiness, supplied by Météo France, the French meteorological service), and background
pollution measurements as input parameters. A limitation of the model was the estimation of Monin-Obukhov length from cloudiness measurements, but the correlation coefficients for the
modeled and effectively measured ambient concentrations were 0.73 for PM10, 0.87 for
nitrogen dioxide, 0.84 for ozone. However, this correlation was only 0.06 for sulfur dioxide. Therefore, sulfur dioxide was no longer considered in the analyses.
Potential confounders
Daily meteorological variables (temperature, atmospheric pressure, and relative humidity) were obtained from Météo France, and daily pollen counts were obtained from the National Network of Aerobiological Surveillance (Thibaudon, 2004). Weekly influenza case counts came from the Sentinelles network (Flahault et al., 2006) of the National Institute of Health and Medical Research.
Statistical analyses
As some census blocks featured a relatively small population size, yielding unstable rates,
we carried out an empirical Bayesian smoothing using STIS software (Space Time
Intelligence System 2007 (Ann Arbor, MI, USA: Terraseer), except for drug sales, where smoothing was not warranted in view of the much greater number of events per census block (Marshall, 1991). Positive and statistically significant spatial autocorrelations were found for our SES index (Moran’s I = 0.54, p<0.01), rates and standardized incidence ratios (SIR) for asthma calls (I from 0.67 to 0.77 according to age group, p<0.01). Associations between SES and health event rates or SIR were quantified by Pearson’s correlation test and their significance assessed using a modified Student’s t-test as proposed by Clifford et al., (Clifford et al., 1989) as to accounting for spatial autocorrelation of neighboring census blocks variables.
Associations between asthma calls and air pollution were assessed with case-crossover models (Maclure & Mittelman, 1991), which are similar to case-control models, except that in the former, the subjects serve as both cases and controls, depending on when they are considered. The subject serves as a case on the day of the health event and a control on days without any health event. Control days were defined according to a monthly time-stratified design (Janes et al., 2005). For an asthma call occurring on a given weekday (e.g., Monday), control days were chosen as the same days of the week throughout the rest of the month (thus, three or four days; here, the other Mondays of the month). Conditional logistic regression was employed for analyses. The statistical significance of the odds ratios was
tested by means of a two-sided 2 test at the 5 percent level.
Base models
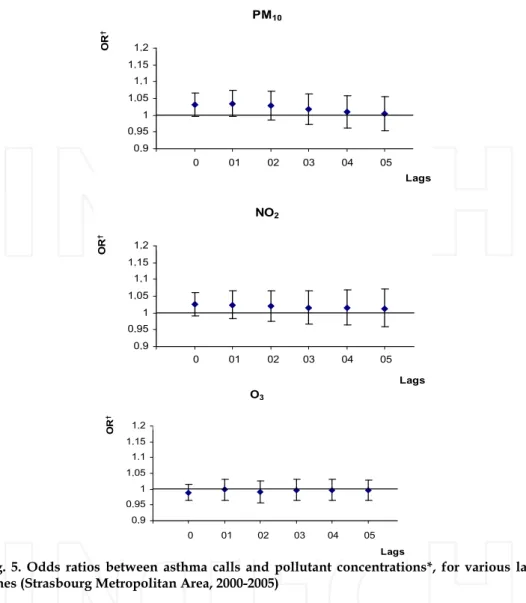
We first analyzed all calls or SABA sale, without differentiating them according to socioeconomic deprivation. Associations between health events and ambient air pollution concentrations modeled by census block were estimated, adjusting for holidays, meteorological variables (daily maximum temperature, maximum atmospheric pressure, and mean relative humidity), influenza epidemics, and pollen counts.
We tested the influence of air pollution indicators averaged on the day of the call (lag 0) and then averaged on the day of the call and the 1–5 previous days (lag 0–1 to 0–5) or up to 10
days in the case of SABA sales. The daily air pollution indicator considered for PM10,
nitrogen dioxide, and sulfur dioxide was the 24-hour average concentration, and for ozone it was the maximum daily value of the 8-hour moving average. The analysis for ozone considered only health events occurring between April 1 and September 30 of each year, because of the very low concentrations of this pollutant in winter.
resolution of the census block – the Lille metropolitan area (LMA). The LMA was selected because its demographic and socioeconomic characteristics are quite distinct from those of the SMA (e.g., 489 census blocks for a total population around 1,100,000 inhabitants). The objective of this stage was to demonstrate that similar results could be obtained in a different part of France and to show that the variables selected for the construction of the index were independent of the study area and characterized socioeconomic level in as discriminating a manner as possible.
Application
Census blocks were divided into five deprivation categories according to their index value; the first category comprised the most privileged blocks and the fifth the most deprived ones. More details can be found in (Havard et al., 2008).
Calls to emergency medical services for asthma exacerbation
The two mobile emergency and healthcare networks operating in the SMA (Service d’Aide Médicale d’Urgence (SAMU) and SOS Médecins provided data about emergency telephone calls made to physicians for asthma attacks. The Bas-Rhin emergency medical services unit (SAMU 67) is a public service that coordinates pre- hospital emergency medical services. SOS Médecins of Strasbourg is a private service providing emergency general medical care. We included each call regarding an asthma attack that reached either SAMU or SOS Médecins from January 1, 2000, to December 31, 2005. The two databases were merged, duplicates being excluded. Each call was geo-coded to the census block where the patient was located at the time of the call, based on the postal address. Only 2 percent of the calls could not be geocoded; they were excluded from the analysis.
SABA sales
The data about SABA sales to people living in the SMA during 2004 came from four health insurance funds: the regional union of health insurance funds (Union Régionale des Caisses d’Assurance Maladie [URCAM], for salaried workers and very low-income families), agricultural social insurance fund (Mutualité Sociale Agricole [MSA], for farmers and similar workers), the fund for self-employed workers (Régime Social des Indépendants [RSI]), and the Lorraine students’ insurance fund (Mutuelle Générale des Etudiants de Lorraine [MGEL]). These funds cover >90% of the local population (Com-Ruelle et al.). In 2004, these funds either paid or reimbursed (fully or partially) all SABA sales prescribed by a physician. All records of SABA sales in pharmacies were extracted from the databases of these four insurance funds by requests for code R3A4 of the European Pharmaceutical Market Research Association nomenclature (Tollier et al., 2005). The following information was furnished for each sale: date, age group (0 to 9, 10 to 19, 20 to 39 years), sex, and census block of residence of the person for which SABA were prescribed. All sales were combined into a single file for analysis.
Ambient air pollution
Hourly ambient concentrations of particulate matter less than 10 m in aerodynamic diameter
(PM10), nitrogen dioxide, sulfur dioxide, and ozone were modeled by the local air quality
monitoring association (Association pour la Surveillance et l’Etude de la Pollution Atmosphérique en Alsace, Schiltigheim) for each block during the entire study period (Bard et al., 2007). Modeling was conducted with Atmospheric Dispersion Modeling System (ADMS-Urban), a deterministic Gaussian dispersion model (McHugh et al., 1997) that integrates emissions inventories, meteorological data (wind direction and speed, temperature and cloudiness, supplied by Météo France, the French meteorological service), and background
pollution measurements as input parameters. A limitation of the model was the estimation of Monin-Obukhov length from cloudiness measurements, but the correlation coefficients for the
modeled and effectively measured ambient concentrations were 0.73 for PM10, 0.87 for
nitrogen dioxide, 0.84 for ozone. However, this correlation was only 0.06 for sulfur dioxide. Therefore, sulfur dioxide was no longer considered in the analyses.
Potential confounders
Daily meteorological variables (temperature, atmospheric pressure, and relative humidity) were obtained from Météo France, and daily pollen counts were obtained from the National Network of Aerobiological Surveillance (Thibaudon, 2004). Weekly influenza case counts came from the Sentinelles network (Flahault et al., 2006) of the National Institute of Health and Medical Research.
Statistical analyses
As some census blocks featured a relatively small population size, yielding unstable rates,
we carried out an empirical Bayesian smoothing using STIS software (Space Time
Intelligence System 2007 (Ann Arbor, MI, USA: Terraseer), except for drug sales, where smoothing was not warranted in view of the much greater number of events per census block (Marshall, 1991). Positive and statistically significant spatial autocorrelations were found for our SES index (Moran’s I = 0.54, p<0.01), rates and standardized incidence ratios (SIR) for asthma calls (I from 0.67 to 0.77 according to age group, p<0.01). Associations between SES and health event rates or SIR were quantified by Pearson’s correlation test and their significance assessed using a modified Student’s t-test as proposed by Clifford et al., (Clifford et al., 1989) as to accounting for spatial autocorrelation of neighboring census blocks variables.
Associations between asthma calls and air pollution were assessed with case-crossover models (Maclure & Mittelman, 1991), which are similar to case-control models, except that in the former, the subjects serve as both cases and controls, depending on when they are considered. The subject serves as a case on the day of the health event and a control on days without any health event. Control days were defined according to a monthly time-stratified design (Janes et al., 2005). For an asthma call occurring on a given weekday (e.g., Monday), control days were chosen as the same days of the week throughout the rest of the month (thus, three or four days; here, the other Mondays of the month). Conditional logistic regression was employed for analyses. The statistical significance of the odds ratios was
tested by means of a two-sided 2 test at the 5 percent level.
Base models
We first analyzed all calls or SABA sale, without differentiating them according to socioeconomic deprivation. Associations between health events and ambient air pollution concentrations modeled by census block were estimated, adjusting for holidays, meteorological variables (daily maximum temperature, maximum atmospheric pressure, and mean relative humidity), influenza epidemics, and pollen counts.
We tested the influence of air pollution indicators averaged on the day of the call (lag 0) and then averaged on the day of the call and the 1–5 previous days (lag 0–1 to 0–5) or up to 10
days in the case of SABA sales. The daily air pollution indicator considered for PM10,
nitrogen dioxide, and sulfur dioxide was the 24-hour average concentration, and for ozone it was the maximum daily value of the 8-hour moving average. The analysis for ozone considered only health events occurring between April 1 and September 30 of each year, because of the very low concentrations of this pollutant in winter.
These associations were assessed for cases of all ages and then for groups of cases aged 0–19, 20–64, and >64 years, except for SABA sales (below 40). These groups were defined according to the guidelines of the French Data Protection Authority, to ensure the confidentiality of the health data geocoded by census blocks.
Testing the influence of deprivation
Interactions with socioeconomic deprivation were tested for the lag times for which the strongest associations were observed in the basic models.
Deprivation was introduced first as a discrete variable. The SMA population was divided into five strata with contrasting deprivation levels, according to the quintiles of the distribution of the deprivation index. An odds ratio for the relation between asthma calls and pollution was estimated for each stratum. The heterogeneity of the odds ratios between
these strata was assessed by means of a two-sided 2 test at the 5 percent level (Atkinson et
al., 2001). These analyses were conducted for the same age groups as in the base models. In an alternative method, deprivation was introduced as a continuous variable. For that purpose, a case-crossover model was constructed for each of the 174 census blocks in which asthma calls occurred during the study period. The models did not converge in the census blocks with fewer than 11 asthma calls. These census blocks were treated as follows. Those adjoining neighboring census blocks of a similar deprivation level (differences of deprivation index values less than one 10th of the deprivation index scale) were merged with them. The deprivation index value attributed to each newly created geographic unit was the mean of the deprivation index values from the merged blocks, weighted by their respective population counts. Census blocks (n = 26) that bordered no neighboring census block of a similar deprivation level (differences of deprivation index values one 10th or more of the deprivation index scale) were excluded from these analyses.
The heterogeneity of the odds ratios estimated in the 136 geographic units so defined was assessed as described above (Atkinson et al., 2001). The influence of the deprivation level of the geographic units on the odds ratios was tested by linear regression (weighted by the inverse of the variance of these odds ratios) in both fixed- and random-effects models. These
analyses were conducted for PM10, nitrogen dioxide, and sulfur dioxide for cases of all ages
but were not feasible for ozone (April–September) and specific age groups, because of the small numbers of calls in most census blocks.
All analyses were carried out using SAS statistical software v 9.1 and 8.2 (SAS Institute, Cary, NC, USA).
3. Results
3.1 Socioeconomic Status Indicator
Our deprivation index was defined by the PCA as the first principal component, which explained 66% of the total variance of the model, while the second explained only 17%. The impossibility of drawing any residual structure from the second component justifies the conclusion that all of the discriminating information useful for characterizing socioeconomic deprivation was in fact captured by the first component. Our index is composed of 19 socio-economic variables that describe different dimensions of sociosocio-economic deprivation. Seventeen can be qualified as primarily material variables and only two directly refer to social dimension of the deprivation (that is, single-parent family and foreign population). Although several of the variables retained belong to the same domain, we consider that they
provide complementary information for characterizing the deprivation. Our index opposes the concepts of material and, to a lesser extent, social deprivation (it is significantly and positively correlated with variables relative to unemployment, immigration, social isolation, household overcrowding, low educational level, and low income) to those of well-being and economic comfort (it is significantly and negatively correlated with variables relative to job stability, high educational level, better living conditions, and high income). Moreover, these variables had differing relative influences in the construction of the index (e.g., proportion of unemployed people contributed to 6.72% of the variance and the percentage of households without cars to only 3.91%).
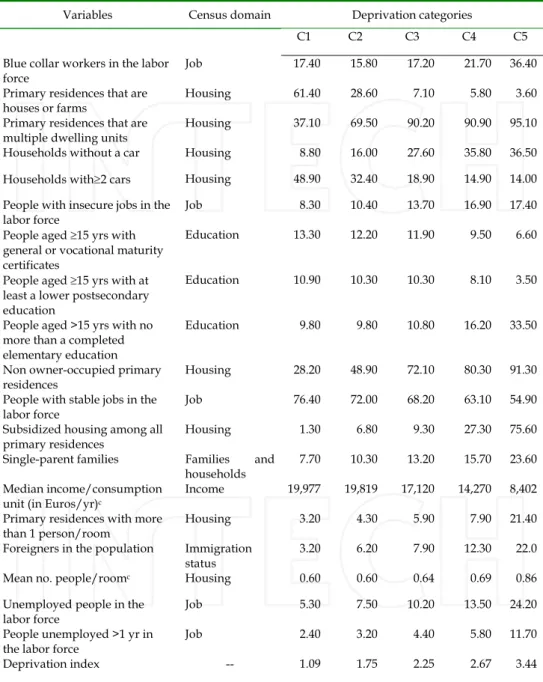
Table I presents the mean values of the index and of the 19 variables by deprivation class. The first class (C1) is characterized by the lowest mean index value and includes the most privileged blocks, defined by the best living conditions (low percentages of the variables describing socioeconomic deprivation and high percentages of variables illustrating material comfort). At the other end, the fifth class (C5) is characterized by the highest mean index value and includes the most deprived blocks. The blocks of this class are characterized by more socioeconomic deprivation, a greater cumulative lack of material and social resources (the highest percentages of variables describing deprivation and the lowest percentages of variables related to positive living conditions). For example, on average, only 1.28% of homes in the C1 blocks were low income subsidized housing while this percentage exceeded 75% for the C5 blocks.
These associations were assessed for cases of all ages and then for groups of cases aged 0–19, 20–64, and >64 years, except for SABA sales (below 40). These groups were defined according to the guidelines of the French Data Protection Authority, to ensure the confidentiality of the health data geocoded by census blocks.
Testing the influence of deprivation
Interactions with socioeconomic deprivation were tested for the lag times for which the strongest associations were observed in the basic models.
Deprivation was introduced first as a discrete variable. The SMA population was divided into five strata with contrasting deprivation levels, according to the quintiles of the distribution of the deprivation index. An odds ratio for the relation between asthma calls and pollution was estimated for each stratum. The heterogeneity of the odds ratios between
these strata was assessed by means of a two-sided 2 test at the 5 percent level (Atkinson et
al., 2001). These analyses were conducted for the same age groups as in the base models. In an alternative method, deprivation was introduced as a continuous variable. For that purpose, a case-crossover model was constructed for each of the 174 census blocks in which asthma calls occurred during the study period. The models did not converge in the census blocks with fewer than 11 asthma calls. These census blocks were treated as follows. Those adjoining neighboring census blocks of a similar deprivation level (differences of deprivation index values less than one 10th of the deprivation index scale) were merged with them. The deprivation index value attributed to each newly created geographic unit was the mean of the deprivation index values from the merged blocks, weighted by their respective population counts. Census blocks (n = 26) that bordered no neighboring census block of a similar deprivation level (differences of deprivation index values one 10th or more of the deprivation index scale) were excluded from these analyses.
The heterogeneity of the odds ratios estimated in the 136 geographic units so defined was assessed as described above (Atkinson et al., 2001). The influence of the deprivation level of the geographic units on the odds ratios was tested by linear regression (weighted by the inverse of the variance of these odds ratios) in both fixed- and random-effects models. These
analyses were conducted for PM10, nitrogen dioxide, and sulfur dioxide for cases of all ages
but were not feasible for ozone (April–September) and specific age groups, because of the small numbers of calls in most census blocks.
All analyses were carried out using SAS statistical software v 9.1 and 8.2 (SAS Institute, Cary, NC, USA).
3. Results
3.1 Socioeconomic Status Indicator
Our deprivation index was defined by the PCA as the first principal component, which explained 66% of the total variance of the model, while the second explained only 17%. The impossibility of drawing any residual structure from the second component justifies the conclusion that all of the discriminating information useful for characterizing socioeconomic deprivation was in fact captured by the first component. Our index is composed of 19 socio-economic variables that describe different dimensions of sociosocio-economic deprivation. Seventeen can be qualified as primarily material variables and only two directly refer to social dimension of the deprivation (that is, single-parent family and foreign population). Although several of the variables retained belong to the same domain, we consider that they
provide complementary information for characterizing the deprivation. Our index opposes the concepts of material and, to a lesser extent, social deprivation (it is significantly and positively correlated with variables relative to unemployment, immigration, social isolation, household overcrowding, low educational level, and low income) to those of well-being and economic comfort (it is significantly and negatively correlated with variables relative to job stability, high educational level, better living conditions, and high income). Moreover, these variables had differing relative influences in the construction of the index (e.g., proportion of unemployed people contributed to 6.72% of the variance and the percentage of households without cars to only 3.91%).
Table I presents the mean values of the index and of the 19 variables by deprivation class. The first class (C1) is characterized by the lowest mean index value and includes the most privileged blocks, defined by the best living conditions (low percentages of the variables describing socioeconomic deprivation and high percentages of variables illustrating material comfort). At the other end, the fifth class (C5) is characterized by the highest mean index value and includes the most deprived blocks. The blocks of this class are characterized by more socioeconomic deprivation, a greater cumulative lack of material and social resources (the highest percentages of variables describing deprivation and the lowest percentages of variables related to positive living conditions). For example, on average, only 1.28% of homes in the C1 blocks were low income subsidized housing while this percentage exceeded 75% for the C5 blocks.
Table I. Deprivation Index and mean values of its 19 variables, according to deprivation categoriesa
Variables Census domain Deprivation categories
C1 C2 C3 C4 C5 Blue collar workers in the labor
force Job 17.40 15.80 17.20 21.70 36.40 Primary residences that are
houses or farms Housing 61.40 28.60 7.10 5.80 3.60 Primary residences that are
multiple dwelling units Housing 37.10 69.50 90.20 90.90 95.10 Households without a car Housing 8.80 16.00 27.60 35.80 36.50 Households with2 cars Housing 48.90 32.40 18.90 14.90 14.00 People with insecure jobs in the
labor force Job 8.30 10.40 13.70 16.90 17.40 People aged 15 yrs with
general or vocational maturity certificates
Education 13.30 12.20 11.90 9.50 6.60
People aged 15 yrs with at least a lower postsecondary education
Education 10.90 10.30 10.30 8.10 3.50
People aged >15 yrs with no more than a completed elementary education
Education 9.80 9.80 10.80 16.20 33.50
Non owner-occupied primary
residences Housing 28.20 48.90 72.10 80.30 91.30 People with stable jobs in the
labor force Job 76.40 72.00 68.20 63.10 54.90 Subsidized housing among all
primary residences Housing 1.30 6.80 9.30 27.30 75.60 Single-parent families Families and
households 7.70 10.30 13.20 15.70 23.60 Median income/consumption
unit (in Euros/yr)c
Income 19,977 19,819 17,120 14,270 8,402 Primary residences with more
than 1 person/room Housing 3.20 4.30 5.90 7.90 21.40 Foreigners in the population Immigration
status 3.20 6.20 7.90 12.30 22.0 Mean no. people/roomc Housing 0.60 0.60 0.64 0.69 0.86
Unemployed people in the
labor force Job 5.30 7.50 10.20 13.50 24.20 People unemployed >1 yr in
the labor force Job 2.40 3.20 4.40 5.80 11.70 Deprivation index -- 1.09 1.75 2.25 2.67 3.44
aAll variables are percentages (%), unless otherwise stated; p value for trend < 0.01 for all variables. bC1 is the least deprived category, C5 is the most. cNot a percentage.
Conversely, nearly 50% of the households in C1 blocks had two cars or more compared with 14% for the C5 blocks (Table I).
Our index thus demonstrates the existence of a socio-economic gradient in the SMA, along which we observe a progressive degradation of level and quality of life between the first and fifth classes (p < 0.01). The different variables used to construct the index sometimes vary significantly in the same direction as the gradient, and sometimes in the opposite direction (Table I), depending on the aspect (positive or negative) of SES that they express (p < 0.01). This gradient appears clearly in the cartographic representation (Figure 1). The most affluent blocks are located on the outskirts of the study area and constitute a peri-urban ring around Strasbourg. These are principally blocks with a relatively low population, comprising rural municipalities. Conversely, socioeconomic deprivation is accentuated as we approach Strasbourg and reaches its maximum at the centre of the metropolitan area. The most disadvantaged blocks are principally those in Strasbourg and the inner suburbs with a relatively high population and comprising the urban municipalities.
Validity tests
Content validity. The 19 variables retained cover all of the census domains and thus insure that our index has fully integrated the multiple socioeconomic aspects of deprivation (Table I).
Construct validity. The high Cronbach’s coefficient (0.92) supports the hypothesis that
these variables measure a one-dimensional concept – socioeconomic deprivation. Convergent validity is verified by very high correlation coefficients with the indices of both Townsend (0.97; p<0.01) and Carstairs (0.96; p < 0.01).
Reliability
Following the same process, 20 variables were retained for Lille metropolitan area, 18 of them were the same as for SMA and they explained the same proportion of variance (66%). Only three variables differed between the two indices: the percentages of the self-employed and of foreign immigrants were retained only for the Lille index and the percentage of blue-collar workers only for Strasbourg. Mapping the index for LMA again illustrates the strong spatial heterogeneity of SES between urban centers and outer suburbs. Finally, as for Strasbourg, all the tests of the index conclusively demonstrated its validity (i.e., the Lille index had a high Cronbach’s coefficient and was very highly correlated with both British indices; data not shown).
Calls to emergency medical services for asthma exacerbation
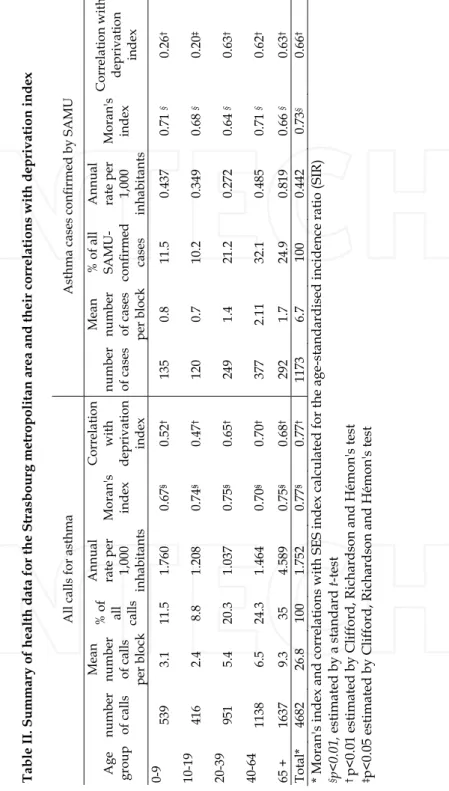
There were 4,682 calls for asthma (SAMU and SOS Médecins combined) and 1,173 SAMU-confirmed asthma cases (from 1,578 calls given to SAMU - some but not all initially reported to be for asthma). Cases finally diagnosed as asthma by participating physicians were treated as such in our analyses, regardless of the initial reason for call. We observed no trend in the annual number of health events.
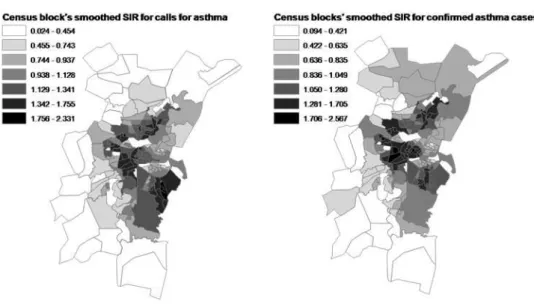
Figure 2 shows the results of empirical Bayesian smoothing of calls for asthma exacerbation SIRs.
Maps of ambient air pollutant concentrations averaged by census block across the SMA (for the period 2000–2005) appear on figure 3.
As expected for a small-area study, high and statistically significant spatial autocorrelation was found for the deprivation index (I =0.54, p<0.01) and for health event indicators (Table II). These are mapped respectively in figures 4 and 5.
Table I. Deprivation Index and mean values of its 19 variables, according to deprivation categoriesa
Variables Census domain Deprivation categories
C1 C2 C3 C4 C5 Blue collar workers in the labor
force Job 17.40 15.80 17.20 21.70 36.40 Primary residences that are
houses or farms Housing 61.40 28.60 7.10 5.80 3.60 Primary residences that are
multiple dwelling units Housing 37.10 69.50 90.20 90.90 95.10 Households without a car Housing 8.80 16.00 27.60 35.80 36.50 Households with2 cars Housing 48.90 32.40 18.90 14.90 14.00 People with insecure jobs in the
labor force Job 8.30 10.40 13.70 16.90 17.40 People aged 15 yrs with
general or vocational maturity certificates
Education 13.30 12.20 11.90 9.50 6.60
People aged 15 yrs with at least a lower postsecondary education
Education 10.90 10.30 10.30 8.10 3.50
People aged >15 yrs with no more than a completed elementary education
Education 9.80 9.80 10.80 16.20 33.50
Non owner-occupied primary
residences Housing 28.20 48.90 72.10 80.30 91.30 People with stable jobs in the
labor force Job 76.40 72.00 68.20 63.10 54.90 Subsidized housing among all
primary residences Housing 1.30 6.80 9.30 27.30 75.60 Single-parent families Families and
households 7.70 10.30 13.20 15.70 23.60 Median income/consumption
unit (in Euros/yr)c
Income 19,977 19,819 17,120 14,270 8,402 Primary residences with more
than 1 person/room Housing 3.20 4.30 5.90 7.90 21.40 Foreigners in the population Immigration
status 3.20 6.20 7.90 12.30 22.0 Mean no. people/roomc Housing 0.60 0.60 0.64 0.69 0.86
Unemployed people in the
labor force Job 5.30 7.50 10.20 13.50 24.20 People unemployed >1 yr in
the labor force Job 2.40 3.20 4.40 5.80 11.70 Deprivation index -- 1.09 1.75 2.25 2.67 3.44
aAll variables are percentages (%), unless otherwise stated; p value for trend < 0.01 for all variables. bC1 is the least deprived category, C5 is the most. cNot a percentage.
Conversely, nearly 50% of the households in C1 blocks had two cars or more compared with 14% for the C5 blocks (Table I).
Our index thus demonstrates the existence of a socio-economic gradient in the SMA, along which we observe a progressive degradation of level and quality of life between the first and fifth classes (p < 0.01). The different variables used to construct the index sometimes vary significantly in the same direction as the gradient, and sometimes in the opposite direction (Table I), depending on the aspect (positive or negative) of SES that they express (p < 0.01). This gradient appears clearly in the cartographic representation (Figure 1). The most affluent blocks are located on the outskirts of the study area and constitute a peri-urban ring around Strasbourg. These are principally blocks with a relatively low population, comprising rural municipalities. Conversely, socioeconomic deprivation is accentuated as we approach Strasbourg and reaches its maximum at the centre of the metropolitan area. The most disadvantaged blocks are principally those in Strasbourg and the inner suburbs with a relatively high population and comprising the urban municipalities.
Validity tests
Content validity. The 19 variables retained cover all of the census domains and thus insure that our index has fully integrated the multiple socioeconomic aspects of deprivation (Table I).
Construct validity. The high Cronbach’s coefficient (0.92) supports the hypothesis that
these variables measure a one-dimensional concept – socioeconomic deprivation. Convergent validity is verified by very high correlation coefficients with the indices of both Townsend (0.97; p<0.01) and Carstairs (0.96; p < 0.01).
Reliability
Following the same process, 20 variables were retained for Lille metropolitan area, 18 of them were the same as for SMA and they explained the same proportion of variance (66%). Only three variables differed between the two indices: the percentages of the self-employed and of foreign immigrants were retained only for the Lille index and the percentage of blue-collar workers only for Strasbourg. Mapping the index for LMA again illustrates the strong spatial heterogeneity of SES between urban centers and outer suburbs. Finally, as for Strasbourg, all the tests of the index conclusively demonstrated its validity (i.e., the Lille index had a high Cronbach’s coefficient and was very highly correlated with both British indices; data not shown).
Calls to emergency medical services for asthma exacerbation
There were 4,682 calls for asthma (SAMU and SOS Médecins combined) and 1,173 SAMU-confirmed asthma cases (from 1,578 calls given to SAMU - some but not all initially reported to be for asthma). Cases finally diagnosed as asthma by participating physicians were treated as such in our analyses, regardless of the initial reason for call. We observed no trend in the annual number of health events.
Figure 2 shows the results of empirical Bayesian smoothing of calls for asthma exacerbation SIRs.
Maps of ambient air pollutant concentrations averaged by census block across the SMA (for the period 2000–2005) appear on figure 3.
As expected for a small-area study, high and statistically significant spatial autocorrelation was found for the deprivation index (I =0.54, p<0.01) and for health event indicators (Table II). These are mapped respectively in figures 4 and 5.