HAL Id: hal-02372214
https://hal.archives-ouvertes.fr/hal-02372214
Submitted on 20 Nov 2019HAL is a multi-disciplinary open access archive for the deposit and dissemination of sci-entific research documents, whether they are pub-lished or not. The documents may come from teaching and research institutions in France or abroad, or from public or private research centers.
L’archive ouverte pluridisciplinaire HAL, est destinée au dépôt et à la diffusion de documents scientifiques de niveau recherche, publiés ou non, émanant des établissements d’enseignement et de recherche français ou étrangers, des laboratoires publics ou privés.
Embryogenesis of the Peristaltic Reflex
Nicolas Chevalier, Nicolas Dacher, Cécile Jacques, Lucas Langlois, Chloé
Guedj, Orestis Faklaris
To cite this version:
Nicolas Chevalier, Nicolas Dacher, Cécile Jacques, Lucas Langlois, Chloé Guedj, et al.. Embryo-genesis of the Peristaltic Reflex. The Journal of Physiology, Wiley, 2019, 597 (10), pp.2785-2801. �10.1113/JP277746�. �hal-02372214�
1
Embryogenesis of the Peristaltic Reflex
1
INSIGHTS INTO THE MYOGENIC TO NEUROGENIC TRANSITION OF GUT MOTILITY 2
Nicolas R. Chevalier1*, Nicolas Dacher1, Cécile Jacques1, Lucas Langlois1, Chloé Guedj2, Orestis Faklaris2,3 3
1 Laboratoire Matière et Systèmes Complexes, Université Paris Diderot/CNRS UMR 7057, Sorbonne 4
Paris Cité, 10 rue Alice Domon et Léonie Duquet, 75013 Paris, France 5
2 Imagoseine Core Facility, Institut Jacques Monod, Université Paris Diderot/CNRS UMR7592, 15 6
rue Hélène Brion, 75013 Paris, France 7
3 MRI-CRBM Core Facility, CNRS UMR 5237, 1919 route de Mende, 34293 Montpellier, France 8
*Correspondence should be addressed to: [email protected] 9
Corresponding Author ORCID: 0000-0002-9713-1511 10
Keywords
11 12
Enteric nervous system, peristaltic reflex, chicken embryo, longitudinal and circular smooth muscle, 13
iDISCO, mechanosensitive neurons, nNOS, calcium waves 14
Keypoints
15 16
• Neurogenic gut movements start after longitudinal smooth muscle differentiation in three 17
species (mouse, zebrafish, chicken), at E16 in the chicken embryo. 18
• The first activity of the chicken enteric nervous system is dominated by inhibitory neurons. 19
• The embryonic enteric nervous system electromechanically couples circular and longitudinal 20
spontaneous myogenic contractions, thereby producing a new, rostro-caudally directed bolus transport 21
pattern: the migrating motor complex. 22
• The response of the embryonic gut to mechanical stimulation evolves from a symmetric, 23
myogenic response at E12, to a neurally-mediated, polarized, descending inhibitory, “law-of-intestine” 24
like response at E16 25
2
• We present high resolution, whole-mount 3D reconstructions of the enteric nervous system of 26
the chicken embryo at the neural-control stage E16 with the iDISCO tissue transparization technique. 27
Abstract
28 29
Gut motility is a complex transport phenomenon involving smooth muscle, enteric neurons, glia and 30
interstitial cells of Cajal. Because these different cells differentiate and become active at different times 31
during embryo development, studying the ontogenesis of motility offers a unique opportunity to “time-32
reverse-engineer” the peristaltic reflex. Working on chicken embryo intestinal explants in-vitro, we 33
found by spatio-temporal mapping and signal processing of diameter and position changes that motility 34
follows a characteristic sequence of increasing complexity: 1) myogenic circular smooth muscle 35
contractions from E6 to E12 that propagate as waves along the intestine, 2) overlapping and 36
independent, myogenic, low-frequency, bulk longitudinal smooth muscle contractions around E14, 3) 37
tetrodotoxin-sensitive coupling of longitudinal and circular contractions by the enteric nervous system 38
as from E16. Inhibition of NOS neurons shows that the coupling consists in NO-mediated relaxation of 39
circular smooth muscle when the longitudinal muscle layer is contracted. This mechanosensitive 40
coupling gives rise to directional, peristaltic bolus transport: the migrating motor complex. We further 41
reveal a transition to a polarized, descending, inhibitory, “law of the intestine”-like reflex response to 42
mechanical stimulation after neuronal activity sets in at E16. This asymmetric response is the 43
elementary mechanism responsible for peristaltic transport. We finally present unique high-resolution 44
3D reconstructions of the chicken enteric nervous system at the neural-control stage based on confocal 45
imaging of iDISCO+ clarified tissues. Our study shows that the enteric nervous system gives rise to new 46
peristaltic transport patterns during development by coupling spontaneous circular and longitudinal 47
smooth muscle contraction waves. 48
Introduction
49 50
The gut is a very sophisticated, autonomous, mechano-chemical reactor. Synchronized movements of 51
muscles within the gut wall, collectively termed motility, permit the transport, mixing and absorption of 52
the food bolus. Speaking in engineering terms, the specifications that the gut as an engine must comply 53
with are substantial. It must actively propel a food bolus with variable rheological properties (from liquid 54
to solid) and adjust the speed of propulsion and local flow in the vicinity of the gut epithelium to ensure 55
optimal absorption of nutrients. Any residual content has to be expelled to prevent stasis and infection. 56
3
Facing microbial or viral stress, it must be able to flush gut contents at high speed (diarrhea) or on the 57
contrary switch to rear gear (vomiting). Accomplishing all these tasks obviously requires a two-way 58
feedback between the digestive “chemical” (epithelium and mucosa) and “mechanical” (longitudinal and 59
circular smooth muscle) compartments of the gut. The need for a mechano-chemical crosstalk is the 60
raison d’être of the enteric nervous system (ENS), an intrinsic nervous control system that is unique 61
among smooth muscle-lined organs (e.g. blood vessels, ureter, oviduct). The anatomical subdivision of 62
the ENS in inter-connected myenteric, smooth muscle-innervating and submucous, epithelium-63
innervating plexuses reflects the dual mechano-chemical interfacing role of this nerve network (Hu & 64
Spencer, 2018). 65
Physiologic studies of motility have revealed a panoply of contractile regimes (Anon, n.d.; Spencer et al., 66
2016): colonic migrating motor complexes, peristalsis, segmentation, myogenic ripples and slow waves. 67
Studies on isolated adult gut segments in organ baths have aimed at grasping the chemical and 68
mechanical factors underpinning these movements, in order to reduce the apparent variety and 69
complexity of movements observed to a minimal number of elementary, local behavioral laws. Although 70
incredible strides (Spencer et al., 2016) have been made in this pursuit since the pioneering studies of 71
Bayliss and Starling (Bayliss & Starling, 1899), this approach has also been challenged by the shear 72
complexity of the adult gut. More than 30 functional types of neurons are present in the ENS 73
synthesizing about 25 different neurochemicals, although only a very small number actually meet the 74
criteria to be considered neurotransmitters (McConalogue & Furness, 1994). This makes it necessary to 75
apply an arsenal of pharmacological agents (Daniel et al., 1989) that often present concentration-76
dependent effects. Motility patterns and contractile behavior depend on the gut segment location 77
(duodenum, hindgut etc.), on animal species (guinea-pig, mouse, etc.) and on the preparation method 78
(open, tubular, muscle strips etc.). Common apparatus used to measure smooth muscle contractility was 79
recently found to interfere with the physiologic motility pattern (Barnes et al., 2014). 80
In the face of this complexity, the approach we adopt and expand upon here is to deconstruct (“reverse-81
engineer”) adult motility by examining how it develops in the embryo. The first motility patterns in the 82
embryonic mouse (Roberts et al., 2010), zebrafish (Holmberg et al., 2007) and chick (Chevalier et al., 83
2017) have all been shown to be myogenic, i.e. they are insensitive to neuronal inhibitors, and are 84
present in guts devoid of enteric nervous system (Roberts et al., 2010; Chevalier et al., 2017) or of 85
interstitial cells of Cajal (Roberts et al., 2010). We have recently demonstrated that early digestive 86
movements are underpinned by calcium waves that travel through a circular smooth muscle syncytium 87
4
(Chevalier, 2018). All attributes of early motility are virtually identical to those of calcium waves: 88
constant speed propagation without attenuation, counter-propagating wave annihilation, sensitivity of 89
wave generation to mechanical stimulation or wounding. The first detectable neuronal subtypes are 90
predominantly inhibitory (Hao & Young, 2009); calcium activity of neurons can be detected in mice 91
around E12.5 (Hao et al., 2012, 2017), i.e., preceding their first detectable influence on motility patterns. 92
The first neurally-controlled movements emerge at E18.5 in the mouse duodenum in the form of TTX-93
sensitive migrating motor complex (MMC, Roberts et al., 2010). In the zebrafish, motility was found to 94
be TTX-sensitive at between 4 and 7 days post fertilization (Holmberg et al., 2007). The lack of enteric 95
nerves in the dysfunctional colon of Hirschsprung disease patients is a testimony to the essential role of 96
the ENS in adult gut motility (Ro et al., 2006; Roberts et al., 2008). 97
The investigations we report on here were initially motivated by the empirical observation that, in all 98
species examined, onset of neurally-controlled motility occurs shortly after longitudinal smooth muscle 99
differentiation (E16.5 in mice (Walton et al., 2016), days 4-5 in zebrafish (Wallace et al., 2005). Several 100
studies on adult motility indicate that the myenteric nerve plexus plays an essential role in synchronizing 101
calcium activity between longitudinal and circular muscle layers (Stevens et al., 2000; Spencer et al., 102
2007). We were therefore keen on 1°) detecting the first longitudinal contractile movements in the gut 103
after differentiation of this smooth muscle layer, 2°) examining how the emergence of neurally-104
controlled movements relates to the activity of both circular and longitudinal muscle layers. We 105
resorted to simple, contactless imaging of gut kinematics in minimalistic tubular preparations to avoid 106
mechanical interference with the samples (Barnes et al., 2014). The main conclusion of our study is that 107
the enteric nervous system creates new motility patterns by coupling spontaneous, myogenic, circular 108
and longitudinal smooth muscle contractions. The mechanosensitive coupling consists in NO-mediated, 109
caudally polarized relaxation of the circular muscle layer when the ENS is distended, i.e. when 110
longitudinal muscle is contracted, when bolus is present or when the gut is pinched. We conclude by 111
presenting unique high-resolution 3D reconstructions of the chicken enteric nervous system at the 112
neural-control stage E16 based on confocal imaging of iDISCO+ clarified tissues. 113
Materials & Methods
114 115
Ethics statement
5
The experiments were conducted under European law article 2016/63/UE: the approval of experimental 117
protocols by an ethics committee is not required for research conducted on chicken at embryonic 118
stages. All experiments were performed in accordance with the ethics guidelines of CNRS. Animal pain 119
was minimized by rapid beheading immediately after the eggs were cracked open. The investigators 120
understand the ethical principles under which the Journal of Physiology operates and certify that their 121
work complies with its animal ethics checklist. 122
Specimen preparation
123
Fertilized chicken eggs were purchased from EARL Morizeau (Chartres, France, breeder Hubbard, JA57 124
hen, I66 rooster, yielding type 657 chicks). The total number of embryos reported on in this work is ~95. 125
The eggs were incubated at 37.5 °C in a humidified chamber for 12 to 16 days. The gastrointestinal tracts 126
were dissected from hindgut to stomach, the mesentery and Remak’s nerve were removed. Duodenum 127
(just after the stomach), jejunum (just before the umbilicus) and hindgut segments (~1 cm) were 128
collected. 129
Motility observation setup, drugs & mechanical stimulation
130
The experimental setup is described in Fig.1a. Opened or tubular gut segments were pinned at their 131
extremities, in a vertical position, to the wall of a rectangular trough coated with Sylgard. The trough 132
was filled with 40 mL DMEM GlutaMAXTM-I (Thermoscientific, with 4.5 g/L D-glucose and sodium 133
pyruvate, Ca2+ 1.8 mM, Mg2+ 0.8 mM), covered and heated from below with a heating plate to a 134
temperature of 36.5± 1°C. The medium was constantly bubbled with carbogen (95% O2 – 5% CO2); rising 135
bubbles generated a flow in the trough that replenished oxygen in the vicinity of the explants. 136
6 137
Figure 1: Experimental and analytical methods. (a) Photograph of the motility monitoring setup. (b) Still shot of tubular E16 138
jejunum segment, blue and red dashed rectangles are longitudinal and transverse regions-of-interest used to generate the 139
data in (c) and in (d-e) respectively. (c) Spatiotemporal map (“Diameter-type map” or “D-map”). (d) Left: Diameter versus 140
time plot 𝒅(𝒕) and signal processing. Right: Fourier transform of 𝒅(𝒕). (e) Left: x-position versus time plot 𝒑(𝒕). Right: 141
Fourier transform of 𝒑(𝒕) showing longitudinal contraction frequency. 142
We waited 30 min after the guts were introduced in the trough to stabilize temperature and oxygen 143
levels. This method yielded stationary motility patterns for the duration of the experiment (1-2h). 144
Oxygenating by passive O2 diffusion through a thin meniscus of medium as we previously described for 145
early stage guts (E5-E9) (Chevalier et al., 2017) is not satisfactory at late development stages (E12 +) as 146
the thickness of the tissue and its oxygen demand increase. The contractile activity 30 min before and 30 147
min after drug addition to the medium was then recorded by time-lapse imaging (0.5 to 3 Hz) with a 148
video camera. In most experiments 5 segments were recorded simultaneously, up to 8 for stage E12 149
7
guts. Drugs applied include: tetrodotoxin (TTX, 1 μM, Cayman Chemicals 14964), NOLA (N ω-Nitro-L-150
arginine, 100 μM, Santa Cruz Biotechnology sc-3570), sodium nitroprusside (SNP, 100 μM, Sigma-Aldrich 151
71778), atropine sulfate (10 μM, Sigma-Aldrich A0257). All drugs were prepared as x100 or x1000 stock 152
solutions in distilled water; NOLA, SNP and atropine stock solutions were prepared freshly before each 153
experiment. To mechanically stimulate (pinch) the guts, we pulled a Pasteur pipette to a diameter of 154
~200-500 μm and blunted its end with a flame to prevent damage to the gut tissue. The pressure was 155
applied for ~1 sec and caused a ~20-50% diameter increase of the gut in the direction perpendicular to 156
the applied force. We waited 2-4 min between each pinch and continuously recorded the contractile 157
response of the guts. 158
Motility analysis
159
Our analysis method is described in Fig. 1b-e. Image stacks were analyzed with ImageJ. The Reslice 160
function was applied to a region-of-interest (ROI) along the gut (blue dashed rectangle in Fig.1b) to 161
generate spatiotemporal maps (Fig.1c). These maps are similar to D-maps (Lentle & Hulls, 2018), but the 162
grey level is not directly proportional to the diameter change. The rostro-caudal (R-C) axis runs from top 163
to bottom for all maps shown. Circular contraction waves appeared as slanted lines (red arrowheads, 164
Fig.1c); the average angle α (Fig.1c) of 5 circular contractions was measured to calculate their speed v = 165
1/ tan α. The Reslice function was applied to a ROI perpendicular to the gut (red dashed rectangle in 166
Fig.1b). A threshold was applied to the resulting image and further analyzed with Matlab software to 167
extract the local diameter 𝑑(𝑡) (distance between left and right edges) and local 𝑥 position 𝑝(𝑡) 168
(average of left and right edges) of the segment. The 𝑦 position of the ROI was chosen in such a way that 169
the gut was locally always perpendicular to the ROI, even when it rocked to the side. The signal 𝑑(𝑡) 170
exhibited high frequency ~3 cpm (cycle-per-minute) oscillations (Fig.1d, blue line) resulting from circular 171
contraction waves; we Fourier transformed this signal (Fig.1d, right) to extract the circular contraction 172
frequency. Using Matlab signal processing routines, we further extracted the upper 𝑑+(𝑡) and lower
173
𝑑−(𝑡) envelope of the diameter (Fig.1d, red and orange lines), as well as the averaged, smoothed
174
diameter 𝑑𝑠(𝑡) (Fig.1d, green line); the instantaneous circular contraction amplitude was defined as
175
𝐴𝑐(𝑡) = (𝑑+(𝑡) − 𝑑−(𝑡)) 𝑑⁄ 𝑠(𝑡). This is an amplitude of diameter fluctuations induced by the
176
contractions, not of muscle tension or of depolarization. The signal 𝑝(𝑡) exhibited low frequency ~0.3 177
cpm oscillations (Fig.1e, blue line) that we identified (see Results section) as resulting from longitudinal 178
contractions, and that were also visible as a low-frequency signal on spatiotemporal maps (white 179
arrows, Fig.1c). Position extremes coincided with diameter extremes (see dashed lines connecting Fig.1d 180
8
and Fig.1e) because 𝑑𝑠(𝑡) was maximal when the longitudinal muscle was contracted and vice-versa.
181
We Fourier transformed the smoothed 𝑝(𝑡) (Fig.1e, right) to extract the longitudinal contraction 182
frequency. 183
In E16 duodenum, we noticed that when longitudinal muscle was contracted (𝑑𝑠(𝑡) peaks, see Fig.2c),
184
𝐴𝑐(𝑡) significantly decreased, i.e., these two signals were out of phase. To quantify this interplay, we
185
computed the Pearson correlation coefficient 𝜌(𝑑𝑠, 𝐴𝑐) = −1 𝑇−1∑ ( 𝑑𝑠(𝑡)−𝜇𝑑𝑠 𝜎𝑑𝑠 ) 𝑇 𝑡=1 ( 𝐴𝑐(𝑡)−𝜇𝐴𝑐 𝜎𝐴𝑐 ) with the 186
Matlab corrcoeff() function, where 𝑇 is the total time of a recording period, 𝜇𝑑𝑠 and 𝜎𝑑𝑠are the mean
187
and standard deviation of 𝑑𝑠, and 𝜇𝐴𝑐 and 𝜎𝐴𝑐 the mean and standard deviation of 𝐴𝑐. 𝜌 values are
188
comprised between -1 and 1; completely correlated (in-phase) and anti-correlated (out-of-phase) signals 189
have, with this definition (notice the minus sign), respectively, a 𝜌 of -1 and 1. As a further measure of 190
correlation, we computed the time-averaged 𝐴𝑐(𝑡) in a window of ±10 sec around all diameter valleys
191
(minima) 𝐴𝑐,𝑣𝑎𝑙𝑙𝑒𝑦𝑠 and around all diameter peaks (maxima) 𝐴𝑐,𝑝𝑒𝑎𝑘𝑠, and calculated the valley-peak
192
contractile amplitude difference as 𝑉𝑃 = 𝐴𝑐,𝑣𝑎𝑙𝑙𝑒𝑦𝑠− 𝐴𝑐,𝑝𝑒𝑎𝑘𝑠. Because amplitude is stronger at
193
diameter valleys than at diameter peaks for E16 duodenums, we find 𝑉𝑃 > 0 in most of these samples. 194
We time-averaged 𝐴(𝑡) and 𝑑𝑠(𝑡) in the 500 sec before and after drug addition, respectively, to get the
195
averaged circular contraction amplitude and averaged smoothed diameter just before and right after 196
drug addition. We did not average these quantities over the whole recording period because they 197
presented a slow drift in time that was independent of the drug and that occurred even after a 198
prolonged equilibration period; the diameter tended to become gradually smaller and the amplitude 199
gradually higher, most likely because of viscous deformation of the gut under the effect of repeated 200
circular contractions. All other quantities were computed from the whole 30-min recording period 201
before and after drug addition. 202
We emphasize that we did not measure the mechanical tension developed by the muscle layers. We 203
measure circular muscle activity by assessing the local diameter reduction it induces (distinctly seen on 204
spatiotemporal maps and supplementary videos) when this layer is contracted. We measure longitudinal 205
muscle activity by the periodic transverse displacement of the pinned segments (buckling) caused by 206
these changes in length. Due to passive, purely mechanical cross-effects, circular muscle contraction 207
causes some degree of elongation, and conversely longitudinal muscle contraction induces some 208
distension. In tubular preparations in a stationary physiological state, these passive cross-effects are 209
relatively small compared to the main deformations induced by circular and longitudinal contractions. 210
9
Longitudinal and circular motions have very distinct intrinsic frequencies (0.3 and 3 cycles per min 211
respectively) in the chicken embryonic gut, so that the two can be very clearly distinguished and any 212
potential artifact from passive mechanical cross-effects discarded, as clearly seen in Video S1,3-6. 213
Passive effects can be seen on longer time scales (~hours) because the tissue is viscoelastic, or upon 214
applying drugs that abruptly change muscle tone (like TTX on E16 duodenum, see results section). 215
Sample clearing and whole-mount 3D Tuj & DAPI confocal imaging
216
In brief, samples were dehydrated, bleached, immunostained and clarified according to a modified 217
iDISCO+ clearing protocol (Renier et al., 2016; Belle et al., 2017). Samples were dehydrated for 1h at RT 218
in ascending concentrations of methanol (50%, 80%, 100%) in PBS, left overnight at 4°C in a 6% 219
hydrogen peroxide solution in 100% methanol for bleaching, re-hydrated on the following day in 220
descending concentrations of methanol (100%, 80%, 50%) and washed in PBS. Samples were 221
permeabilized and blocked in PBS containing 0.2% gelatin (Prolabo), and 0.5% Triton X-100 (Sigma-222
Aldrich) (PBSGT) at RT on a rotating tray. Immunostaining for Tuj anti βIII-tubulin (Abcam 14545, 223
dilution 1:100) was performed in 0.1% saponin (10μg/mL) in PBSGT at RT with agitation for 3 days, 224
followed by 6 washes of 30 min in PBSGT at RT. Secondary antibodies (Cy3 or GFP, dilution 1:300) 225
applied in 0.1% saponin (10μg/mL) in PBSGT at RT for 2 days. After staining samples were exposed to a 226
DAPI solution for 6 h and protected from light by covering in aluminium foil. For clearing we followed 227
the iDISCO+ protocol (Renier et al., 2016): samples were dehydrated in a series of methanol in PBS 228
solutions (20%, 40%, 60%, 80%, 100%) for 1 h each at RT. Samples were then incubated overnight in 2:3 229
anhydrous dichloromethane anhydrous (DCM) – 1:3 Methanol solution. The next day, after 30 min 230
incubation in 100% DCM, samples were transferred in 100% Benzyl Ether solution (DBE). Cleared 231
samples were imaged in DBE in specific 3D-printed chambers. Because DBE dissolves most materials, we 232
sealed the 3D-printed chambers with a coverslide using Twinsil silicone-glue (PicoDent) that does not 233
react with DBE. Samples were imaged using an inverted microscope DMI8 (Leica) equipped with a 234
spinning disk head (Yokogawa CSU-W1), and a sCMOS ORCA-FLASH 4 V2+ camera (Hamamatsu). 235
Acquisitions were performed with MetaMorph (Molecular Devices) software. 3D-reconstructions and 236
movies (Video S7-8) were generated with Imaris (Bitplane) software. 237
Tuj & SMA immunostaining on transverse sections
238
Guts were fixed for 1H in a 4% PFA in PBS solution, washed in PBS, then left overnight in 30% sucrose in 239
water solutions, and embedded the next day in OCT compound (VWR). 14 μm slices were cut at -20°C 240
10
with a cryotome (Leica) and deposited on Thermofrost glass slides (VWR). After rehydration and 241
blocking of the slides for 15 min in a 1% BSA in PBS solution, the slides were then incubated overnight in 242
an anti-α smooth muscle actin antibody (Abcam, ref5694, dilution 1:1000) and anti βIII-tubulin antibody 243
(Abcam, ref14545, dilution 1:1000) solution composed of 0.1% BSA and 0.1% triton in PBS; the following 244
day, after washing, complementary fluorescent secondary antibodies (CY3 and Alexa488, dilution 1:400 245
in PBS) were applied for 6H. The slides were washed and immediately imaged with a confocal 246 microscope. 247
Results
248 249Physiological motility characteristics from E12 to E16
250 251
11 252
Figure 2. Motility patterns and characteristics from E12 to E16. (a-d) Schemes of motility patterns. Full and dashed contours 253
indicate the state of the gut at 𝒕 and 𝒕 + ∆𝒕, to portray its dynamics. The red lines indicate the smooth muscle fiber 254
orientation and contractions. Spatiotemporal diagrams or diameter-time plots illustrate the emerging features at each stage. 255
White arrows in (b) and green arrowheads in (c): longitudinal contractions. Blue arrowheads in (d): propagating contraction 256
complexes. (e) Still shots (Video S1) of open preparations of E16 duodenum, the epithelium faces the reader. Dashed white 257
line: long axis of the gut. The vectors indicate the displacement of features of the epithelium between two frames (1 sec 258
interval) during a longitudinal contraction (left) and during a circular contraction (right). (f) Summary of movements 259
observed in the duodenum (DUOD), jejunum (JEJ) and hindgut (HG) at stages E12-E16, CC: circular contraction, LC: 260
longitudinal contraction, MMC: migrating motor complex. 261
12
Fig.2 and Fig. 3 provide respectively a qualitative and quantitative overview of the movements observed 263
from stages E12-E16. At stage E12, motility consisted in circular smooth muscle contraction waves (CC 264
waves) that propagated along the gut at constant velocity (Fig.2a, VideoS1). Contractions occurred 265
spontaneously along the gut segment or at its extremities and gave rise to two counter-propagating 266
waves traveling away from the origination site. When two oppositely propagating waves met, they 267
annihilated. This behavior is in all aspects identical to what we described earlier for E6-E9 guts (Chevalier 268
et al., 2017). CC waves did not exhibit any preferential rostro-caudal or caudo-rostral direction at any of 269
the stages examined (E12-E16). 270
Longitudinal smooth muscle is known to differentiate in the chicken at E13 (Shyer et al., 2013). E14 271
(VideoS1) and E16 (VideoS2-5) duodenum and jejunum exhibited a periodic, low-frequency (~0.3 cpm, 272
cycles-per-minute) rocking motion in the transverse direction (x-axis in Fig.1b), that was superimposed 273
with higher-frequency (~3 cpm) CC waves (Fig.2b-d). The rocking motion was accompanied by a slight 274
periodic increase in gut length (~5-10 %). To identify the origin of this motion, we performed particle-275
image velocimetry (using the “Tracker” ImageJ plugin, courtesy of O. Cardoso) on open gut preparations 276
(VideoS2, Fig.1b). Longitudinal contractions (LC, Fig.2e, left) compressed the epithelium along the 277
longitudinal direction and stretched it along the transverse direction at a frequency of ~0.3 cpm. 278
Conversely, circular contractions (CC, Fig.2e, right) compressed the epithelium along the transverse 279
direction and stretched it in the longitudinal direction, but at a higher frequency of ~3 cpm. This 280
confirms that the ~0.3 cpm rocking motion we observe in tubular preparations is due to longitudinal 281
contractions. The decrease in length during a LC was much more pronounced in open preparations 282
because the gut could more freely expand in diameter than in a tubular preparation. We did not detect 283
longitudinal contractions in the hindgut in the period E12-E16.
284
At stage E16, duodenal segments exhibited a marked correlation between longitudinal bulk (whole-285
segment) contractions and circular contractions (Fig.2c, Video S3): when longitudinal muscle was 286
contracted (𝑑𝑠(𝑡) peaks, see Fig.2c), CC wave amplitude 𝐴𝑐(𝑡) significantly decreased or even vanished,
287
i.e., these two signals were out of phase with one another. In n=10/67 E16 duodenal segments, we 288
detected localized diameter bulges (spanning ~1 mm) that propagated along the length of the intestine 289
(Video S4). These propagating bulges are distinctly seen on spatiotemporal maps (light, slanted streaks 290
pointed at with blue arrowheads in Fig.2d). They had an average speed of 38 ± 7 μm/sec (n=10) and a 291
frequency of ~0.3 cpm. Circular contraction waves propagated towards or away from the bulge, but 292
wave amplitude at the site of the bulge was zero. The diameter bulges were generated at the same 293
13
frequency as bulk longitudinal contractions. They had the same inhibitory effect on circular wave 294
amplitude than bulk longitudinal contractions. We therefore must conclude that the local propagating 295
diameter bulge is due to a local, propagating, longitudinal contraction. In the following we will refer to 296
this motion pattern as a migrating motor complex, MMC (Roberts et al., 2010). We found that in all 297
samples where MMCs were present, they propagated in the rostro-caudal direction. The complexes 298
therefore represent the first motility pattern in the embryo with a preferential, aboral propagation 299
direction. Fig.2f summarizes the movements observed in each segment of the lower gastrointestinal 300
tract at stages E12-E16. 301
302
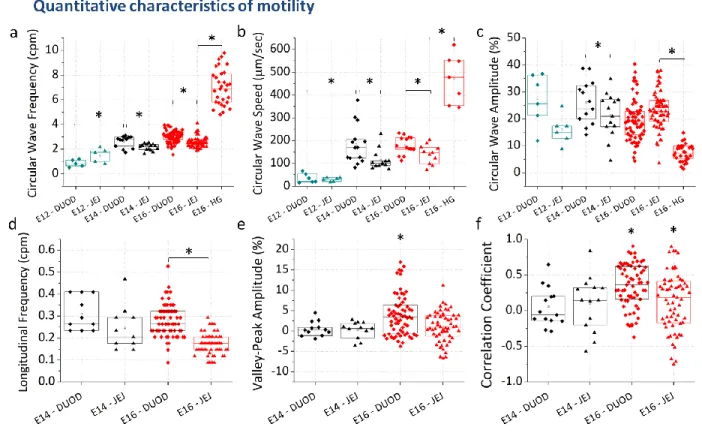
Figure 3. Quantitative characteristics of circular, longitudinal, and circular-longitudinal coupling at E12-E16. Each data point 303
corresponds to a different sample. A star indicates a statistically positive (>0) value, Student t-test p<0.05. A star over a 304
bracket indicates a statistically significant difference between groups (p<0.05, Mann-Whitney two-tailed test). 305
CC frequencies (Fig.3a) and wave speeds (Fig.3b) were significantly higher in the E16 duodenum (3.1 ± 306
0.2 cpm, n=65, all uncertainties are ± SD/2) than in the jejunum (2.5 ± 0.2 cpm, n=63); a similar 307
difference between duodenum and jejunum was present at E14 (Fig.3a,b). Similarly, LC frequency 308
(Fig.3d) was significantly higher in the E16 duodenum (0.28 ± 0.04 cpm, n=65) than in the jejunum (0.17 309
± 0.02 cpm, n=57). We measured a significant, abrupt, 4-5 fold increase of CC wave speed between E12 310
and E14 (Fig.3b) from 35 ± 11 μm/sec (n=6) to 184 ± 42 μm/sec (n=14) in the duodenum, and from 29 ± 311
14
5 (n=6) to 114 ± 22 μm/sec (n=13) in the jejunum. In the E16 hindgut, the frequency of CC waves
312
(Fig.3a) was 7.3 ± 0.8 cpm (n=22), a factor ~2 higher than in the midgut. The speed of CC waves (Fig.3b)
313
in the hindgut was in the range 200-600 μm/sec, i.e. a factor ~3 higher than in the midgut; 1 Hz
time-314
lapse acquisition was actually not sufficient to accurately measure wave speed in the hindgut. CC wave
315
amplitude (Fig.3c) was 8.0 ± 1.7 % (n=30), i.e., a factor ~3 lower than in the midgut. We quantified the 316
correlation between bulk LC and local CC wave amplitude by computing two indicators: the Pearson 317
correlation coefficient and the average difference of contraction amplitude at diameter valleys (minima) 318
and diameter peaks (maxima), as described in the Methods section. Fig.3e-f shows that both indicators 319
are significantly >0 in E16 duodenum (ρ= 0.34 ± 0.15, VP = 3.9 ± 2.5 %), whereas they are not 320
significantly different from zero in all other preparations (E14 duodenum & jejunum and E16 jejunum). 321
322
Effects of drugs on tonic and phasic contractility
323
The effect of neuronal inhibitors and of the muscle agonist NO in the duodenum are presented in Fig.4a-324
h and illustrated in Video S3-5. 325
15 327
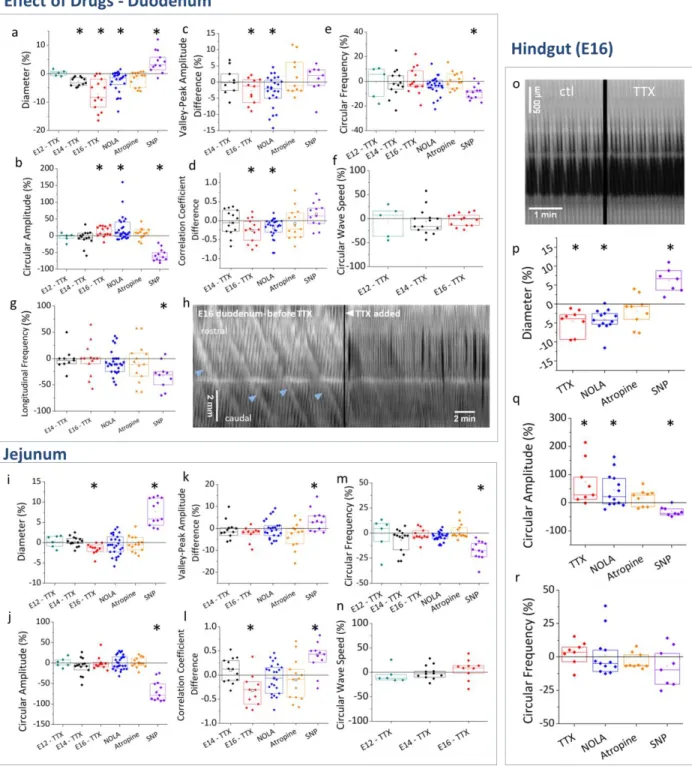
Figure 4. Effects of tetrodotoxin (TTX), NOLA, atropine and sodium nitroprusside (SNP) in duodenum (a-h), jejunum (i-n) and 328
hindgut (o-r). Percent changes before-after drug addition are computed for any quantity 𝒒 as ∆𝒒 = 329
𝟏𝟎𝟎 (𝒒𝒂𝒇𝒕𝒆𝒓− 𝒒𝒃𝒆𝒇𝒐𝒓𝒆) 𝒒⁄ 𝒃𝒆𝒇𝒐𝒓𝒆. Because correlation indicators 𝝆 and 𝑽𝑷 can be positive or negative, we computed their 330
difference rather than their percent change, i.e. ∆𝝆 = 𝝆𝒂𝒇𝒕𝒆𝒓− 𝝆𝒃𝒆𝒇𝒐𝒓𝒆 and ∆𝑽𝑷 = 𝑽𝑷𝒂𝒇𝒕𝒆𝒓− 𝑽𝑷𝒃𝒆𝒇𝒐𝒓𝒆. Each data point 331
represents a different sample. A star indicates that a sample group is significantly different from zero, Student t-test p<0.05. 332
The spatiotemporal map (h) illustrates that propagating contractile complexes (light slanted lines, blue arrowheads) in E16 333
duodenum vanish after application of TTX 1 μM. The spatiotemporal map (o) shows TTX-insensitive CC wave activity in the 334
hindgut. 335
16
We first used tetrodotoxin (TTX, 1 μM) to determine when smooth muscle contractions become 336
dependent on the activity of the enteric nervous system. We found that TTX had no effect at E12 337
(Fig.4a-f) showing that motility at this stage is purely myogenic, as we found for earlier stage guts (E7-338
E9, (Chevalier et al., 2017)). At E14, TTX caused a slight but significant diameter decrease (Fig.4a) of -2.8 339
± 0.8 % (n=12); none of the other characteristics (Fig.4b-g) examined were affected. The diameter 340
decrease corresponded to an immediate constriction of the whole duodenum segment following drug 341
addition, caused by the increase of circular smooth muscle tone. At stage E16, TTX induced a more 342
pronounced diameter decrease of the duodenum of -7.1 ± 2.8 % (n=14, Fig.4a & Video S4). TTX also 343
caused a significant increase of CC wave amplitude by 13 ± 8 % (n=14, Fig.4b). It finally induced a net 344
decrease of the correlation coefficient (-0.25 ± 0.15, n=13, Fig.4d) and of the valley-peak indicator (- 2.6 345
± 1.9 %, n=11, Fig.4c), showing that coupling between the longitudinal and circular muscle layers was 346
reduced or abolished. We further found that, in all samples (n=3) in which propagating contraction 347
complexes were present before drug addition, this motion pattern was abolished by TTX 348
(spatiotemporal map Fig.4h, Video S4). TTX did not affect CC wave speed (Fig.4f) or CC and LC frequency 349
(Fig.4e,g). 350
We applied atropine and NOLA to inhibit more specifically excitatory- and inhibitory-neuronal pathways 351
at E16. Atropine (10 μM) did not have a significant effect on any of the quantities examined (Fig.4a-g). 352
Similarly to TTX, NOLA (100 μM) led to diameter decrease of -2.7 ± 1.9 % (n=26, Fig.4a) and a 21 ± 19 % 353
(n=26, Fig.4b) increase in CC wave amplitude (Video S3). Like TTX, it also induced a net decrease of the 354
correlation coefficient (-0.2 ± 0.1, n=26, Fig.4d) and of the valley-peak indicator (-2.8 ± 2.4 %, n=26, 355
Fig.4c), showing a reduction of the coupling between LC and CC (Video S3). NOLA did not abolish 356
propagating contraction complexes (n=6) but the amplitude of the diameter bulges appeared reduced. 357
Like TTX, NOLA did not affect CC wave speed (Fig.4f) or CC and LC frequency (Fig.4e,g). 358
Because TTX and NOLA induced significant responses in E16 duodenal segments, we finally examined 359
the effect of the nNOS neurotransmitter nitric oxide (NO). To this end, we added the NO-donor sodium 360
nitroprusside (SNP 100 μM, Video S5), resulting in a NO concentration of 65 nM (Bradley & Steinert, 361
2015). SNP led to a significant increase of diameter of 4.3 ± 1.9 % (n=12, Fig.4a), and a strong reduction 362
of CC amplitude by -58 ± 10 % (n=12, Fig.4b). Correlation indicators increased slightly after SNP 363
(Fig.4c,d), essentially because CC waves had decreased to such an extent immediately after SNP 364
application that CC amplitude and diameter curves overlapped (i.e., were correlated). Overall, the 365
effects of exogenous NO on diameter, CC amplitude, and CC-LC correlation are the opposite of those 366
17
obtained by blocking endogenous NO synthesis either by TTX or NOLA. SNP also led to a significant 367
reduction of CC frequency (-9.0 ± 2.9 %, Fig.4e) and of LC frequency (-33 ± 13 %, Fig.4g); the reduction 368
was especially pronounced immediately after SNP addition; frequency then gradually increased in the 30 369
min period following drug application (Video S5). 370
The effects of drugs on jejunal segments are summarized in Fig.4i-n. E12 and E14 jejunal contractions 371
were TTX-insensitive. The diameter reduction associated with TTX at E16 was small (-1.7 ± 0.7 %, Fig.4i) 372
but significant. Unlike for duodenum however, CC amplitude in the jejunum remained unchanged after 373
TTX application (Fig.4j). Although TTX led to a decrease of the correlation coefficient (Fig.4l), it did not 374
yield a significant valley-peak difference ((Fig.4k), such that it cannot be said that CC-LC coupling is 375
reduced by application of TTX in E16 jejunum. This conclusion is consistent with the fact that in the E16 376
jejunum, CC and LC are poorly correlated to start off with (in physiologic conditions, Fig.3e). Unlike in 377
the duodenum, application of NOLA to jejunal segments did not have a significant effect on any of the 378
quantities examined. Motility in the jejunum was insensitive to atropine, like in the duodenum. Overall, 379
the effects of neuronal inhibitors (TTX, NOLA) in the E16 jejunum were much less pronounced than they 380
were in the E16 duodenum. SNP induced essentially the same effects in the jejunum than it did in the 381
duodenum (diameter increase, CC wave amplitude and frequency decrease). 382
In the E16 hindgut segments (Fig.o-r), TTX and NOLA caused a significant diameter reduction (-4.6 ± 1.6 383
%, n=7 and -4.2 ± 1.6 %, n=9 respectively, Fig.4p), increased CC amplitude (20 ± 12 %, n=7 and 33 ± 13 384
%, n=9 respectively, Fig.4q) while CC frequency was unaffected (Fig.4r). Atropine did not have any effect 385
on hindgut contractility. SNP caused a significant diameter increase (6.6 ± 1.9 %, n=6, Fig.4p) and a 386
significant reduction of CC amplitude (-58 ± 10 %, n=6, Fig.4q). 387
Response to mechanical stimulation
388
We previously demonstrated that early stage guts (E7-E9) are intrinsically mechanosensitive: when 389
mechanical pressure is applied to the gut locally by pinching, it triggers two outgoing CC waves that 390
propagate away from the point of compression (Chevalier, 2018). We investigate here the 391
development of this reflex response on duodenal segments at the TTX-insensitive and TTX-sensitive 392
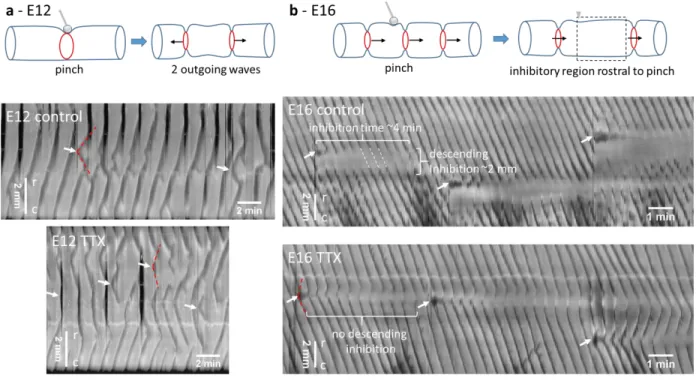
stages E12 and E16 respectively. The response to pinching of E12 guts was identical to that of E7-E9 393
guts, i.e. it generated two outgoing CC waves (Fig.5a, Video S6 n=6 guts, n>20 pinches). In some 394
instances, a second or third pair of contractile waves was generated at the point of compression. This 395
response was insensitive to tetrodotoxin (Fig.5a bottom). Pinching at stage E16 led to a local, phasic, 396
18
non-propagating contraction that lasted 10-30 sec (see black oscillating spots at white arrows, Fig.5b). 397
Circular contraction waves were inhibited in a region spanning ~1-2 mm rostral to the point of 398
compression for 4-6 min (Fig.5b, n=6 guts, n>20 pinches). CC waves on either side of the region of 399
inhibition were still in register with each other (Fig.5b, white connecting dashed lines), indicating that 400
propagation of the signal associated with the contractile waves was not inhibited. 401
402
Figure 5. Response to local mechanical stimulation of duodenum at stage E12 (a) and E16 (b). Top: Scheme of physiologic 403
response to pinching. Bottom: spatiotemporal maps before (physiologic) and after TTX application (1 μM for 1 h). Darker 404
areas correspond to reduced gut diameter. White arrows indicate time and position of pinch (2-4 per map). Red dashed lines 405
indicate outgoing waves after pinching. White dashed lines show that circular waves are still in register on either side of the 406
region of descending inhibition. r-c indicates the rostro-caudal direction (top-down in all spatiotemporal maps of this report). 407
Pinching after TTX application (1 μM for 1 h, Fig.5b bottom) triggered two outgoing CC waves, like for 408
E12 guts; the wave that propagated in the direction opposite to that of the background contractile 409
waves quickly annihilated; the wave that propagated in the same direction as the background waves 410
fused with them in a way that the overall frequency of the contractile waves remained unchanged. 411
Subsequent pairs (~5-10) of contractile waves were generated at the point of compression. The 412
amplitude of CC waves at the point of compression was slightly reduced, but the region of descending 413
inhibition observed prior to TTX application had vanished. 414
Gut clearing and 3D reconstitution of the enteric nervous system
19
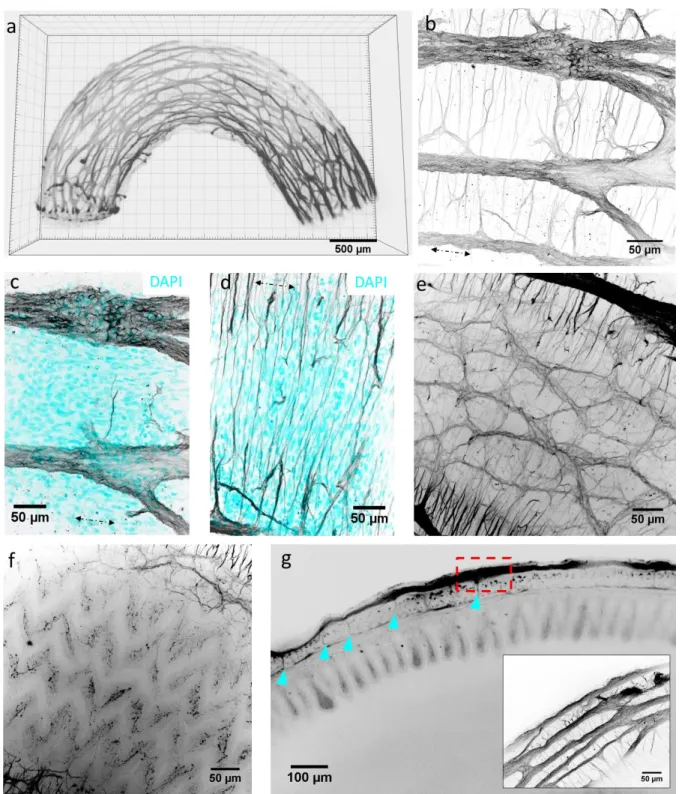
We used the iDISCO+ clearing method with Tuj & DAPI immunohistochemistry on duodenum at the 416
neural-control stage E16. Whole-mount tissue imaging is usually limited to a depth of ~100 μm by light 417
scattering. Clearing techniques remove lipids, the main contributor to light scattering, and make the 418
refractive index of the tissue homogeneous, thus drastically improving light penetration depth. In 419
clarified tissues, fluorescence signal could be retrieved throughout the ~1 mm thickness of the segment, 420
making it possible to reconstruct for the first time the 3D architecture of the chicken enteric nervous 421
system (Fig.6a & must-see Video S7). We complemented 3D Tuj images with immunohistochemistry on 422
2D transverse frozen sections to assess connectivity of enteric nerves to the smooth muscle. The 423
myenteric plexus is composed of 50-100 μm wide ganglia interconnected by interganglionc fibers 10-30 424
μm in diameter (Fig.6a-b). The fibers and ganglia form a polyhedral mesh that is elongated along the 425
longitudinal axis of the gut. Nerve fibers extend circumferentially from myenteric ganglia to innervate 426
the circular smooth muscle layer (Fig.6b,d & Fig.7). Interestingly, we do not observe a similar structure 427
innervating the longitudinal muscle layer at this stage (Fig.6b,c,g, Fig.7): no dendrites are seen to extend 428
longitudinally above or in the plane of the myenteric plexus. The submucosal plexus forms a looser mesh 429
network below the circular muscle layer (Fig.6e); the submucosal and myenteric plexus are connected 430
by radial nerve fibers that penetrate between circular smooth muscle bundles (see optical longitudinal 431
section Fig.6g, arrowheads and Fig.7). Dendrites from the submucosal plexus projected all the way to 432
the tip of the epithelial villi (Fig.6f,g, Fig.7). Video S8 shows the progression inside the enteric nervous 433
system from the myenteric plexus to the epithelium in a clarified tissue specimen. 434
435 436 437 438
20 439
Figure 6. Enteric nervous system of E16 chicken duodenum revealed by confocal imaging of Tuj (βIII-tubulin) whole-mount 440
IHC on clarified tissue. (a) Still shot of 3D reconstruction (Video S7). (b-f) are still shots of Video S8. (b) Z-stack max projection 441
of myenteric plexus and circumferentially extending dendrites. (c) Z-stack max projection of myenteric plexus showing 442
enteric ganglia and longitudinally oriented cells (DAPI) belonging to the longitudinal smooth muscle layer. (d) Z-stack max 443
projection of circumferentially extending dendrites and circumferentially oriented cells (DAPI) belonging to the circular 444
smooth muscle layer. (e) Submucosal plexus. (f) Dendritic projections of submucosal plexus in epithelial villi. (g) Longitudinal 445
optical section showing neuromuscular coat, epithelial villi and lumen. Arrowheads: connections between the myenteric and 446
submucous plexus. Inset: zoom of dashed region showing structure of myenteric ganglia at gut border. 447
21 448
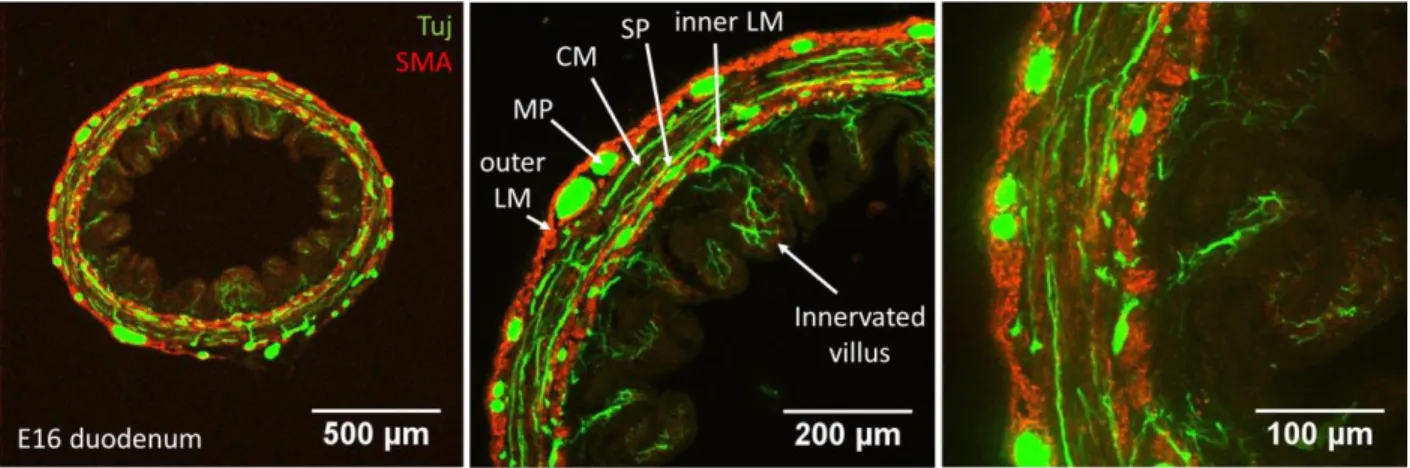
Figure 7: Enteric nervous in relation to smooth musculature in 2D transverse section. Tuj and α-smooth muscle actin 449
immunohistochemistry. LM: longitudinal muscle, MP: myenteric plexus, CM: circular muscle, SP: submucosal plexus. 450
Circumferential Tuj-positive fibers extend in the circular smooth muscle layer and in the epithelial villi. At E16, an outer and 451
an inner longitudinal muscle layer is present (Shyer et al., 2013). 452
453
Discussion
454 455
We described intestinal motility in the chicken fetus from stage E12 to E16. At E12, motility consists of 456
myogenic circular smooth muscle contractions that propagate as waves along the intestine. Overlapping 457
and independent, myogenic, low-frequency, bulk longitudinal smooth muscle contractions then appear 458
at E14. Tetrodotoxin-sensitive coupling of longitudinal and circular contractions by the enteric nervous 459
system at E16, gives rise to a new, directional, peristaltic bolus transport pattern: the migrating motor 460 complex. 461 462 463 464 465 466 467 468
22
a
Event Chicken
(days) Human (weeks) Mouse (days)
Zebrafish (days)
Enteric neural crest cell migration 4-8 4-8 (Wallace & Burns, 2005) 9.5-14.5 1-3 (Wallace et al., 2005)
First detectable nNOS neurons - - 11.5(Hao & Young, 2009) 2(Hao & Young, 2009)
Circular muscle differentiation 5-6 (Chevalier et al., 2017) <7 (Beaulieu et al., 1993; Romanska et al., 1996)
12.5(McHugh, 1995) 3(Wallace et al., 2005)
Circular contractions 6,7 (Chevalier et al., 2017) 7.5(Ueda et al., 2016) visible on MRI images
13.5 (Roberts et al., 2010) 4 (Holmberg et al., 2007)
Interstitial Cell of Cajal differentiation 9 (Lecoin et al., 1996) 9 (Wallace & Burns, 2005) 14.5-18.5 (Roberts et al., 2010)
7 (Holmberg et al., 2007)
Longitudinal muscle differentiation 13 (Shyer et al., 2013) 12-14 (Wallace & Burns, 2005) 16 (Walton et al., 2016) 4-5 (Wallace et al., 2005)
Longitudinal contractions 14 - - - Calcium activity in enteric neurons 14-16 (Mccann et al., 2019)
electrically evoked, TTX-sensitive
12.5 (Hao et al., 2017)
not correlated with motor patterns
Neurally-mediated motility
14-16 16.5-18.5(Roberts et al., 2010) 4-7 (Holmberg et al., 2007)
469
470
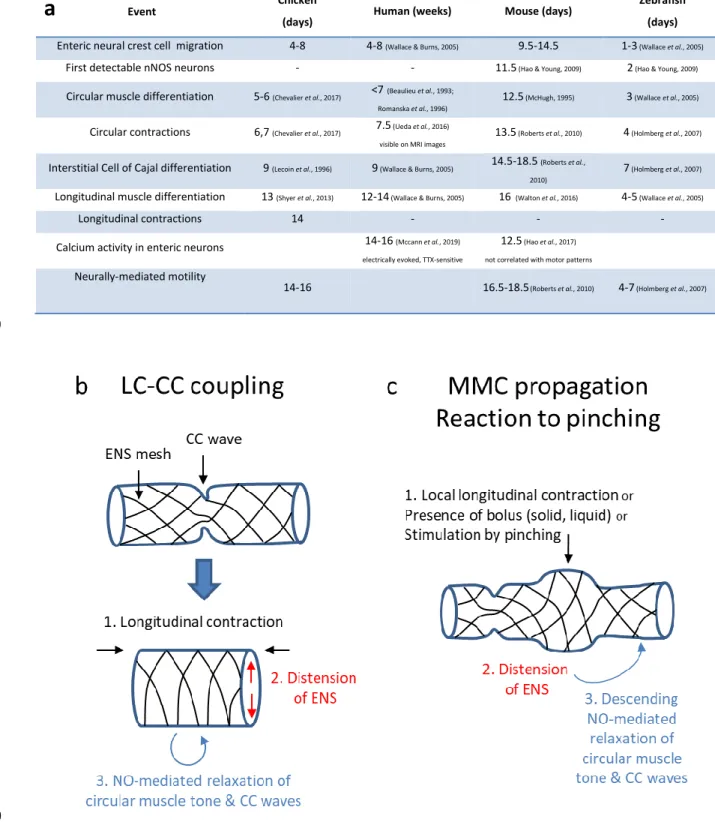
Figure 8. (a) Summary of important landmarks in the emergence of gut motility in the chicken, human, mouse and zebrafish. 471
Calcium signals detected in the mouse by (Hao et al., 2017) do not seem to be related to motor patterns; calcium signals 472
detected by (Mccann et al., 2019) could be related to motor patterns as they are TTX-sensitive. Note that the order of events 473
is the same in all four species. It is a remarkable fact that human and chick gut development follow the same timeline, in 474
days for the chicken, in weeks for humans. (b-c) Schemes illustrating the suggested mechanosensitive mechanism for 475
23
coupling of bulk longitudinal and circular contractions (b, LC-CC coupling) by the enteric nervous system, and its local version 476
(c) responsible for propagation of the MMC and the observed reaction to mechanical stimulation (pinching). 477
We summarize in Fig.8a important landmarks of the ontogenesis of motility in the chicken, mouse, 478
zebrafish and humans. From E5 to E12, the contractile activity of the chicken embryonic gut consists of 479
circular contraction (CC) waves that propagate along the gut tract (Chevalier et al., 2017). We have 480
previously demonstrated by direct calcium imaging that spontaneously generated, intercellular, gap-481
junction dependent circular smooth muscle calcium waves underpin this early motility pattern 482
(Chevalier, 2018). Contractions at stage E5-E6 propagate rapidly (100-1000 μm/sec), leading to 483
apparent, immediate whole-gut contractions (Chevalier et al., 2017). They become localized and their 484
speed decreases from E6 through E12; the speed then exhibits an abrupt, 5-fold increase between E12 485
and E14 (Fig.3b). Understanding this sudden speed increase will require further investigation. The 486
amplitude and frequency of CC waves increases respectively from 0 to ~25 % and from ~0.3 to ~3 cpm 487
between stages E6 and E14. 488
As development progresses, CC waves become more ordered: their rhythm becomes increasingly 489
regular and successive waves tend to all propagate in the same direction for prolonged periods of time 490
(compare spatio-temporal map of E7 gut in (Chevalier et al., 2017) and of E12 and later guts, Fig.2), 491
although they do not, as a whole, exhibit a preferred rostro-caudal or caudo-rostral propagation 492
direction. This progressive ordering of CC waves is probably the result of the activity of interstitial cells 493
of Cajal (ICC), because 1°) ICCs differentiate around E9 in the chicken gut (Lecoin et al., 1996) and 2°) 494
ICCs have been shown to be involved in regulating, ordering and entraining CC waves (Hennig et al., 495
2010). CC wave generation and propagation do not however require ICCs or neural activity, as they are 496
TTX-insensitive (Fig.3-4), are found in aganglionic chick hindgut (Chevalier et al., 2017), in aganglionic 497
mouse mid- (Roberts et al., 2010) and hindgut (Roberts et al., 2008), and also in embryonic (Roberts et 498
al., 2010) and adult (Hennig et al., 2010) W/WV mouse guts lacking interstitial cells of Cajal. 499
Interestingly, ICC-depleted mice are viable although they present dilated intestines and disrupted 500
motility patterns (Rich et al., 2013). This shows that even disordered CC waves can give rise to the 501
coupled, neurogenic movements that emerge later in development and are essential for bolus transport 502
and digestion. 503
Longitudinal smooth muscle differentiation is the next important milestone in the development of 504
motility. It occurs at stage E13 in the chicken embryo (Shyer et al., 2013). Soon thereafter, at stage E14, 505
we detected low-frequency (~0.3 cpm) whole-segment longitudinal contractions (LCs), superimposed on 506
24
higher-frequency (~3 cpm) CC waves. Pacing is believed to occur predominantly by ICC-MP interstitial 507
cells of Cajal, located in or close to the myenteric plexus (Sanders et al., 2014). Studies in the canine 508
colon (Smith et al., 1987) have shown that distinct ICC subnetworks can generate different pacemaker 509
frequencies: a similar mechanism might be at play in the chicken to generate the 10-times lower 510
frequency of LCs compared to CCs. It is also possible that the freshly differentiated longitudinal muscle 511
layer at E14-E16 is not yet connected to ICCs. Just like CCs, LCs persisted in the presence of TTX. LCs and 512
CCs occur independently of one another at E14. Neural inhibition by tetrodotoxin (TTX) induces a slight 513
but significant constriction of diameter in duodenum at stage E14 (Fig.4a), a first sign of neural activity 514
on smooth muscle contractility. Physiologic neuronal activity at this stage relaxes circular smooth 515
muscle; this relaxing effect is blocked upon TTX addition, leading to constriction. This contractile effect 516
of TTX becomes more pronounced at E16, by increasing both circular muscle tone (diameter decrease, 517
Fig.4a) and phasic CC wave amplitude (Fig.4b). A recent study on the emergence of electrical activity in 518
the human colon showed that TTX-sensitive electrically-evoked calcium transients in enteric neurons are 519
detected by week 16 (Mccann et al., 2019). It is a remarkable fact that human and chick gut 520
development follow almost exactly the same timeline, in days for the chicken, in weeks for humans (Fig. 521
8a). As in zebrafish, mice, and human, neural activity in the chicken ENS sets in right after longitudinal 522
smooth muscle differentiation (Fig.8a). 523
Motility in stage E16 duodenum is characterized by the emergence of a coupling between LCs and CCs: 524
we found that when longitudinal muscle is contracted, gut diameter increases and CC wave amplitude is 525
significantly decreased or even abolished (Fig.2c, Fig.3e-f). LC-CC coupling disappears in the presence of 526
TTX (Fig.4c-d), showing that the coupling is mediated by neurons. When longitudinal contraction occurs 527
locally (in ~15% of E16 duodenum samples examined), LC-CC coupling gives rise to a caudally 528
propagating diameter bulge, the migrating motor complex (Roberts et al., 2010). MMCs are the first 529
rostro-caudally polarized motility patterns in the embryonic gut. The frequency of MMC generation is 530
the same as that of LCs, (~0.3 cpm); they propagate at speeds of ~40 μm/sec; because MMCs are the 531
result of local LC-CC coupling, they vanish in the presence of TTX in chicken (Fig.4h) and in mice (Roberts 532
et al., 2010). The signal associated with a CC wave can travel through an MMC (Fig.2d, Fig.4h), but the 533
amplitude of CC waves is zero at the site of the MMC, as though the circular muscle was locally 534
anesthesized. 535
Comparison of duodenal and jejunal segments at identical stages revealed a rostro-caudal maturation 536
gradient: neurally-controlled movements (TTX and NOLA-sensitive LC-CC coupling, MMCs) were present 537
25
in E16 duodenum but not yet in the E16 jejunum (Fig.2); both the speed and frequency of CC waves and 538
the frequency of LCs were higher in duodenum than in jejunum (Fig.3a,b,d), a gradient that has been 539
observed over a century ago in adult guts (Alvarez, 1914). Similarly to TTX, inhibition of nNOS activity by 540
NOLA induced an increase of circular muscle tone, of CC wave amplitude, and uncoupled LC and CC in 541
E16 duodenum (Fig.4, Video S3). Applying the nNOS agonist NO had opposite effect to those of TTX and 542
NOLA on smooth muscle tonic and phasic contractility (Fig.4, Video S5). In the newly-hatched chicken 543
(i.e only 4-5 days after E16), NOS, VIP and NADPH-diaphorase positive neurons have been detected 544
throughout the enteric nervous system (Balaskas et al., 1995); nerve fibers were concentrated in the 545
circular smooth muscle layers, and very few, if any fibers were detected in the longitudinal muscle. 546
These findings are consistent with the predominantly inhibitory and NOLA-sensitive activity of the ENS 547
on circular muscle we report here. NOLA only diminished the amplitude of MMCs, without completely 548
abolishing them like TTX. This may indicate a role for vasointestinal peptide (VIP) in driving smooth 549
muscle relaxation in the embryonic gut at these stages. nNOS neurons are the first neuron subtype to 550
differentiate in the murine ENS (Hao et al., 2012). In the human colon (Mccann et al., 2019), excitatory 551
neurons (VAchT and Sub P) differentiate before inhibitory neurons (nNOS and VIP). 552
Acetylcholinesterase staining (using the Acetylcholineesterase Rapid Staining Kit #8450, MBL, Japan) 553
showed that cholinergic neurons are present in myenteric ganglia thoughout the chicken gut at E16 554
(data not shown but available upon request). They are not active as blocking this pathway with atropine 555
did not have any effect on gut motility. 556
Mechanically stimulating the guts (Fig.5) revealed further crucial information. Pinching leads to local 557
thinning and distension (~50 % diameter increase) of the gut wall. Although this stimulation method 558
does not yield a stress pattern identical to that obtained by applying fluid or solid pressure inside the 559
lumen (bolus), it could be applied reproducibly with precision concerning both the location and duration 560
of stimulation. We find that pinching at stage E12 leads to the generation of two contractile waves that 561
propagate away from the point of compression. Pinching at stage E16 leads to a localized contraction, 562
followed by the inhibition of CC wave over a distance of ~1-2 mm caudal to the point of compression, 563
for ~5 min. An E12-like myogenic response was recovered after neuronal inhibition of E16 guts by 564
tetrodotoxin. We therefore conclude that the ENS drives a transition from a myogenic, symmetric 565
reaction to mechanical stimulation at E12 to an asymmetric (polarized) reflex at E16 by actively 566
inhibiting the caudally-directed CC wave that is generated upon stimulation. The E16 reflex is very much 567
alike the “law of the intestine” (descending inhibition, ascending contraction) as first described by 568
Bayliss and Starling (Bayliss & Starling, 1899). Importantly, the reaction to distension we observe at E16 569
26
suggests an elementary mechanism to explain the propagation of the MMC (Fig.8c): 1°) a longitudinal 570
contraction initiates a MMC by sucking liquid inside the gut lumen at its rostral end, 2°) this liquid exerts 571
pressure on the gut wall, distending it and causing inhibition of CC waves caudal to the location of the 572
bolus, while continuous CC waves maintain a small lumen size rostrally, 3°) this asymmetry pushes the 573
liquid bolus caudally, driving further caudal inhibition and a net, continuous rostro-caudal transport. This 574
sequence of events is called the neuromechanical loop mechanism (Dinning et al., 2014). When the gut 575
is pinched, the compressed region does not propagate (Fig.5) because there is no liquid bolus. A 576
prediction of this propagation model is that MMC velocity should depend upon the viscosity and 577
physical characteristics of the bolus; this prediction has been verified for adult guts (Spencer et al., 578
2016). 579
Our findings support the view that the ENS in the fetal chicken gut drives an active reciprocal coupling of 580
longitudinal and circular smooth muscles. We suggest that this neural coupling is mediated by the 581
following mechanism (Fig.8b-c): when longitudinal muscle is contracted, the resting diameter of the gut 582
increases slightly due to passive mechanical cross-effects, putting the ENS under tension. Although this 583
cross-deformation is small, it is sufficient to activate mechanosensitive ENS neurons that amplify the 584
effect by relaxing the circular smooth muscle by secretion of NO. We stress that the reciprocal coupling 585
we observe cannot be accounted for solely by passive mechanical cross-effects because 1) LC-CC 586
coupling and MMCs are sensitive to TTX, and thus actively mediated by the ENS (Fig.4c-d,h), 2) passive 587
mechanical effects are relatively small and would yield a more graded correlation, whereas we observed 588
that CC waves could completely disappear during a bulk longitudinal contraction (Video S3), and that CC 589
amplitude was always zero at the site of a local longitudinal contraction (MMC, Video S4). Previous 590
investigators have reported reciprocal motion of longitudinal and circular muscle (Kottegoda, 1969; 591
Grider, 2003). This notion has been challenged by simultaneous electrophysiological recordings of 592
longitudinal and circular smooth muscle layers showing that both layers receive synchronous excitatory 593
nerve input oral and synchronous inhibitory nerve input anal to the site of stimulation (Spencer et al., 594
1999, 2003; Spencer & Smith, 2001). In our study, longitudinal muscle does not appear to be innervated, 595
as none of the neurotoxins tested had any effect on longitudinal contractions. The mechanism we 596
suggest to explain the active LC-CC coupling and the MMC (Fig.8b-c) does not imply reciprocal hard 597
wiring of longitudinal and circular muscle layers by the ENS, but does require passive mechanical 598
interaction of the longitudinal layer with the ENS mesh in intact tubular preparations. It is possible that 599
this mechanosensitive pathway may have been suppressed in preparations where this mechanical 600
interaction was eliminated (Spencer et al., 1999). We also note that previous studies (Kottegoda, 1969; 601
27
Spencer et al., 1999, 2003; Spencer & Smith, 2001; Grider, 2003) were all performed on adult, not 602
embryonic guts, in the colon and ileum, not in the duodenum, and in guinea-pig or rat, not in the 603
chicken. Differences in behavior related to species and segment location cannot be excluded. We also 604
expect further muscle innervation and neuronal subtype differentiation / activation to occur at later 605
embryonic and postnatal stages, giving rise to different and more complex motor behavior that the ones 606
we report on within the scope of this study. 607
Tissue clarification made it possible to acquire fluorescence signal throughout the gut and to present a 608
uniquely detailed optical 3D reconstruction of the beautiful enteric nerve meshwork (Fig.6, Video S7-8). 609
It revealed a dense network of circumferential neural projections from ganglia to the circular muscle 610
layer (Fig.6b,d, Fig.7). This is consistent with the observed effects of neurotoxins (TTX , NOLA) on circular 611
muscle contractility at this stage (Fig.4). The slow outgrowth of these projections between E8 and E14-612
E16 likely explains the prolonged lapse of time between complete colonization of the gut by enteric 613
crest cells (E8) and the first neural effects on motility (E16). We found that, at E16, the myenteric plexus 614
is connected to the submucous plexus which in turn projects to the epithelial villi (Fig.6f-g, Fig.7). We did 615
not however find a particular dendrite or neuronal projection structure innervating the longitudinal 616
muscle layer at this stage. 617
In conclusion we have outlined the development of motility in the chicken embryo from stages E12 to 618
E16, and examined the emergence of neurally-controlled motility patterns in the context of longitudinal 619
smooth muscle differentiation. Our investigation highlights that the “engine” driving gut movements at 620
this early stage of development are spontaneous myogenic contractile waves. Because these waves do 621
not have a preferential rostro-caudal or caudo-rostral direction, they cannot efficiently propel luminal 622
content. We found that the enteric nervous system cooperatively orchestrates (Huizinga & Lammers, 623
2008) these spontaneous contractions by inducing a polarized, caudal inhibition of circular contraction 624
waves upon distension of the gut wall. The distension can be triggered either by contraction of the 625
longitudinal muscle layer, or by local mechanical stimulation of the gut due to the presence of bolus, or 626
by external mechanical stimulation (pinching). This polarized mechanosensitive coupling of longitudinal 627
and circular movements by the enteric nervous system generates a new peristaltic, directional motility 628
pattern that will efficiently transport bolus in the adult: the migrating motor complex. Focusing on the 629
simpler, embryonic rather than adult gut has allowed us to understand in detail and with a minimal 630
number of ad-hoc hypotheses the emergence of this new motility pattern. 631