HAL Id: hal-00296082
https://hal.archives-ouvertes.fr/hal-00296082
Submitted on 27 Nov 2006
HAL is a multi-disciplinary open access
archive for the deposit and dissemination of
sci-entific research documents, whether they are
pub-lished or not. The documents may come from
teaching and research institutions in France or
abroad, or from public or private research centers.
L’archive ouverte pluridisciplinaire HAL, est
destinée au dépôt et à la diffusion de documents
scientifiques de niveau recherche, publiés ou non,
émanant des établissements d’enseignement et de
recherche français ou étrangers, des laboratoires
publics ou privés.
Observations of the diurnal and seasonal trends in
nitrogen oxides in the western Sierra Nevada
J. G. Murphy, D. A. Day, P. A. Cleary, P. J. Wooldridge, R. C. Cohen
To cite this version:
J. G. Murphy, D. A. Day, P. A. Cleary, P. J. Wooldridge, R. C. Cohen. Observations of the diurnal
and seasonal trends in nitrogen oxides in the western Sierra Nevada. Atmospheric Chemistry and
Physics, European Geosciences Union, 2006, 6 (12), pp.5321-5338. �hal-00296082�
www.atmos-chem-phys.net/6/5321/2006/ © Author(s) 2006. This work is licensed under a Creative Commons License.
Chemistry
and Physics
Observations of the diurnal and seasonal trends in nitrogen oxides
in the western Sierra Nevada
J. G. Murphy1,*, D. A. Day1,**, P. A. Cleary1,***, P. J. Wooldridge1, and R. C. Cohen1 1Department of Chemistry, University of California, Berkeley, USA
*now at: School of Environmental Sciences, University of East Anglia, Norwich, UK
**now at: Department of Land, Air, and Water Resources, University of California, Davis, USA ***now at: Department of Chemistry, University of Pennsylvania, Philadelphia, USA
Received: 6 February 2006 – Published in Atmos. Chem. Phys. Discuss.: 7 June 2006 Revised: 18 October 2006 – Accepted: 17 November 2006 – Published: 27 November 2006
Abstract. Observations of speciated nitrogen oxides, namely
NO2, total peroxy nitrates (6PNs), total alkyl nitrates
(6ANs), and HNO3 by thermal dissociation laser induced
fluorescence (TD-LIF), and supporting chemical and mete-orological measurements at Big Hill (1860 m), a high ele-vation site in California’s Sierra Nevada Mountains, are de-scribed. From May through October, terrain-driven winds in the region routinely bring air from Sacramento, 100 km southwest of the site, upslope over oak and pine forests to Big Hill during the day, while at night, the site often samples clean, dry air characteristic of the free troposphere. Win-ter differs mainly in that the meteorology does not favour the buildup of Sacramento’s pollution over the Sierra Nevada range, and the urban-influenced air that is seen has been less affected by biogenic VOC emissions, resulting in longer life-time for NO2and a predominance of the inorganic forms of
nitrogen oxides.
Summertime observations at Big Hill can be compared with those from Granite Bay, a Sacramento suburb, and from the University of California’s Blodgett Forest Research Sta-tion to examine the evoluSta-tion of nitrogen oxides and ozone within the urban plume. Nitrogen oxide radicals (NO and NO2), which dominate total nitrogen oxides (NOy) at
Gran-ite Bay, are rapidly converted into HNO3, 6PNs, and 6ANs,
such that these compounds contribute 29, 30, and 21% re-spectively to the NOybudget in the plume at Big Hill.
Nev-ertheless, the decreasing concentrations of NO2as the plume
is advected to Big Hill lead to decreases in the production rate of HNO3and ozone. The data also demonstrate the role
that temperature plays in sequestering NO2 into peroxy
ni-trates, effectively decreasing the rate of ozone production. The important contribution of 6ANs to NOy in the region
suggests that they should be considered with regards to ex-Correspondence to: R. C. Cohen
(cohen@cchem.berkeley.edu)
port of NOyfrom the boundary layer. Nocturnal observations
of airmasses characteristic of the free troposphere showed lower NOyconcentrations, which were dominated by HNO3
with a relatively small contribution from the organic nitrates.
1 Introduction
Anthropogenic activity increases the abundance of nitrogen oxides (NOx) in an urban atmosphere by orders of
mag-nitude above global and regional background levels. Af-ter enAf-tering the atmosphere, nitrogen oxides are diluted and chemically processed on timescales of minutes to hours. In daylight, NOx is quickly interconverted between its two
forms, NO and NO2, and in the presence of OH and
volatile organic compounds (VOC), catalytic ozone pro-duction ensues. When the cycle is terminated by asso-ciation reactions between NOx and odd hydrogen radicals
(HOx≡OH+HO2+RO2), higher oxides of nitrogen (NOz) are
formed. The more oxidized NOz species may act as
reser-voirs or sinks for the NOxradicals, and in some instances gas
to aerosol conversion results in the formation of nitrate par-ticles. Because of the timescale of this photochemistry, rural and remote regions downwind of major NOxsources are
of-ten more severely affected by secondary pollutants, such as ozone or particulate matter, than the source area (e.g. White et al., 1976; Blumenthal et al., 1978; Trainer et al., 1995; Ry-erson et al., 2001; Dillon et al., 2002; Neuman et al., 2003; Zaveri et al., 2003).
Observations at many remote continental locations show that the concentration and speciation of total reactive ni-trogen oxides (NOy=NOx+NOz)are strongly influenced by
meteorological conditions. At many sites in eastern North America concentrations of primary and secondary pollutants depend strongly on wind direction and season (Fahey et al.,
5322 J. G. Murphy et al.: Diurnal and seasonal trends in nitrogen oxides 1986; Munger et al., 1998; Hayden et al., 2003). During
summer months there is a strong correlation observed be-tween ozone and NOz(Trainer et al., 1993; Thornberry et al.,
2001; Zaveri et al., 2003). Measurements from a high eleva-tion site in the Swiss Alps show concentraeleva-tions are governed by the relative contributions from polluted airmasses origi-nating over continental Europe and cleaner airmasses from the free troposphere (Zellweger et al., 2003). As the trans-boundary nature of air pollution becomes better appreciated, there is an increasing impetus to quantify the export of reac-tive nitrogen oxides between continents (Liang et al., 1998; Li et al., 2004; Parrish et al., 2004), and the role it may play in affecting downwind air quality (Li et al., 2002; Hudman et al., 2004). This requires a complete understanding of the fac-tors that govern the chemistry, mixing and losses of nitrogen oxides over the appropriate timescales.
This paper describes speciated NOydata obtained at three
sites located along an east-west transect between Sacramento and Lake Tahoe, California. The measurement sites are lo-cated downwind of Sacramento during daylight hours, in the outflow of its urban plume. The goals of our analysis are to examine the seasonal and diurnal cycles in nitrogen oxide compounds at the most remote site, Big Hill, and to com-pare the summertime measurements made at all three sites. This comparison allows us to investigate the role that nitro-gen oxides play in regional ozone formation and to quantify the distribution of NOyavailable for export from the region.
In Sect. 2 we provide details about the location, character-istics, and instrumentation of the three measurement sites. Section 3 explains the thermal dissociation laser-induced flu-orescence technique used to make measurements of speci-ated nitrogen oxides at each of the sites. The regional mete-orology is described in Sect. 4, both in terms of its seasonal-ity, and the orographically driven diurnal cycle that drives air from the urban area towards the remote, high elevation Sierra Nevada during the day. Section 5 begins with a description of the annual cycle (March 2003–February 2004) of nitrogen oxide measurements made at Big Hill. In Sects. 5.3–5.5, we include measurements from two other sites: the nearby Uni-versity of California Blodgett Forest Research Station (UC-BFRS) and from Granite Bay, a Sacramento suburb. Sum-mertime data from 2001 for the latter sites are compared with Big Hill data from the summer of 2003. Long term measure-ments of climate variables and ozone at UC-BFRS show that there is relatively little interannual variability between sum-mers, and these two years in particular are very similar. Fur-thermore, routine monitoring of ozone and NO2at Folsom, a
site close to Granite Bay, shows that the chemical character-istics of the airmasses advecting east from Sacramento were very similar in both years also. Therefore we are able to use data from the three sites to examine the physical and chem-ical variables that determine the processing and distribution of nitrogen oxides in an airmass as it moves away from an urban area.
2 Measurement sites
The Big Hill monitoring site (38.84◦N, 120.41◦W, 1860 m) is located in Eldorado National Forest in Placer County, Cal-ifornia and was continuously maintained from March 2003 to February 2004. The site is located within a 24 000 acre forest fire scar from the Cleveland Fire of 1992 and there re-mains minimal vegetation within 1 km of Big Hill. The site is approximately 5 km north of Highway 50 and 30 km south west of Lake Tahoe. A climate-controlled 9 m long trailer was used to house the trace gas instruments and was posi-tioned on the west side of the hill, upwind of nearby struc-tures (fire lookout tower, heliport) during the daytime hours. Sampling inlets were mounted using a tower on the trailer roof, approximately 5 m above ground level.
The details of the thermal dissociation laser-induced flu-orescence (TD-LIF) instrument used to measure reactive ni-trogen species and its performance characteristics during the Big Hill measurement campaign are described below. In addition to the measurements of NOyi species carried out
by TD-LIF, California Air Resources Board (CARB) main-tained a meteorological station (Met One Instruments) to measure temperature, humidity and wind speed and direc-tion. Inside the trailer, CARB had two beta-attenuation mon-itors (BAMs, Met One Instruments) to measure particulate matter with diameters less than 2.5 and 10 µm (PM2.5 and
PM10), and commercial instrumentation to measure NOxand
NOy(Teco 42CY), CO (API 300), and O3(API 400).
Unfor-tunately, the CO instrument did not have sufficient sensitiv-ity, and the CARB NOxy data were not recorded with
suffi-cient precision to yield useful values at this remote site. Twenty kilometers northwest of the Big Hill site, the Uni-versity of California operates a research site at Blodgett For-est (UC-BFRS) within a managed ponderosa pine planta-tion located at 38.88◦N, 120.62◦W. Instruments are housed within a climate-controlled trailer and inlets are positioned at the top of a 10 m tower nearby. Measurements of reac-tive nitrogen have been made at the site using TD-LIF semi-continuously between October 2000 and October 2005. Ad-ditionally, long-term records exist for meteorological vari-ables, CO2, CO, ozone and several VOC. The main
differ-ences between the two sites are that UC-BFRS is at a sig-nificantly lower elevation, 1315 m, is 20 km closer to Sacra-mento, and is surrounded by dense vegetation. These factors have a dramatic influence on the meteorology and chemistry at the sites, and consequently on the partitioning of reactive nitrogen.
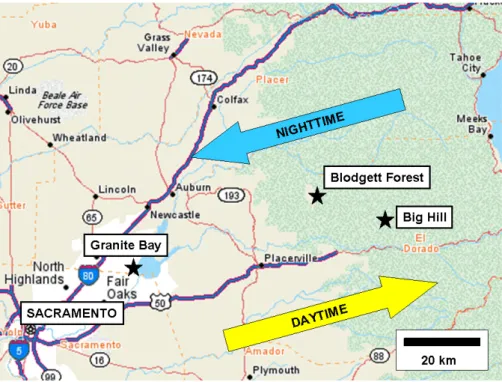
During the summer of 2001, observations were made from a site at the northeastern edge of the Sacramento area in Granite Bay (38.74◦N, 121.20◦W, 277 m). This site was ideally positioned to allow characterization of the initial con-ditions of the urban plume as it left the populated region and moved upslope. Figure 1 shows the location of all three mon-itoring sites. The instruments at Granite Bay were housed in the same mobile laboratory trailer that was later used at Big
Fig. 1. Map of western Sierra Nevada region between Sacramento and Lake Tahoe, CA. Monitoring sites used in this paper include Granite
Bay, a northeastern suburb of Sacramento, and Blodgett Forest (UC-BFRS) and Big Hill, located in the mid-elevation Sierra Nevada. Arrows depict the general daytime upslope, nighttime downslope flow pattern which dominates in the region.
Hill. A prototype LIF instrument measured NO2
continu-ously (Cleary et al., 2002), while a second TD-LIF instru-ment obtained measureinstru-ments of NO2and the individual NOz
species (Cleary et al., 2005). In this analysis, we also make use of ozone measurements (Dasibi, 1008) from that site.
3 TD-LIF instrument for NOy
Thermal dissociation laser-induced fluorescence was used to make specific, rapid, cross-calibrated measurements of NO2,
the sum of peroxy nitrate species (6PNs≡RO2NO2), the
sum of alkyl nitrate species (6ANs≡RONO2), and HNO3.
Heated ovens thermally decompose the organic nitrates and nitric acid to NO2at temperatures characteristic of the
com-pounds XO-NO2 bond energy (Day et al., 2002). At
am-bient temperatures, only NO2 is responsible for the
instru-ment signal. When the sample stream is heated to 180◦C for approximately 100 ms, the peroxy nitrates thermally decom-pose to yield NO2. By subtracting the ambient NO2 from
the total NO2 measured after heating, the concentration of
peroxy nitrates can be calculated. In a similar fashion, the air stream is heated to 330◦C to dissociate alkyl nitrates and 550◦C for HNO3. The TD-LIF instrument at Big Hill had
two ovens. The ovens were cycled through temperature pairs to make measurements of each class of NOy, for example
one oven at 550◦C and the second at 330◦C to make a mea-surement of HNO3. The inlet system was housed in a 1.7 m
long, 10 cm×10 cm steel box mounted vertically to a tower on the trailer roof. The individual nitrogen oxide compounds (NOyi)are converted to NO2immediately after entering the
inlet to minimize sampling losses. Aside from the oven sec-tions, which are made of quartz, all the tubing in the inlet system is made of PFA, including the 10 m long lines that delivered the air from the rooftop inlet to the instrument in-side the trailer.
Laser-induced fluorescence is a highly sensitive and se-lective method for detecting NO2in the atmosphere
(Thorn-ton et al., 2000, 2003). In the configuration used here, a Nd:YAG-pumped dye laser operating at 585 nm is used to excite a particular rovibronic feature in the NO2 spectrum.
The resulting fluorescence in each of two cells is collected by photomultiplier tubes with laser scatter and background light reduced by bandpass filters and time-gated detection. The sensitivity was also enhanced by use of a supersonic ex-pansion in which the gas stream is expanded into low pres-sure (<0.3 Torr) through a critical orifice. The resulting ther-mal cooling of the gas forces a greater fraction of the NO2
molecules being sampled to absorb at the wavelength of light provided by the dye laser and results in a stronger fluores-cence signal. Measurements were made at a rate of 1 Hz with an average detection limit throughout the campaign of 15 ppt/s (S/N=2).
Careful effort was made to ensure the accuracy and pre-cision of the measurements made by TD-LIF. A zero air
5324 J. G. Murphy et al.: Diurnal and seasonal trends in nitrogen oxides
°
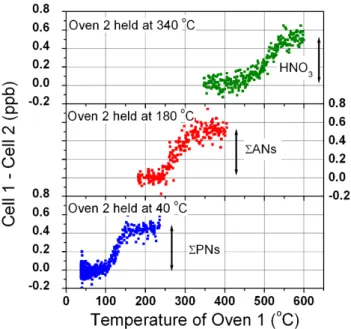
Fig. 2. The y-axis shows how the difference between concentrations
of NO2being measured in cells 1 and 2 changes as oven 1 is ramped
from a temperature well above oven 2 down to the same tempera-ture. For example, the lower panel shows that when cells 1 and 2 have their ovens set to 180 and 40◦C, respectively, the concentra-tion difference between them can be attributed to peroxy nitrates. When the temperature of oven 1 is slowly reduced to be the same as oven 2 the two cells agree on average. Each datapoint represents a 3-s average during a scan of the ambient atmosphere at Big Hill. generator (Sabio 1000) was used to provide clean air free of nitrogen oxides for zeros and calibrations. Zeros were performed approximately every two hours and were pro-grammed to occur at every temperature setting. A NIST-traceable cylinder of 5.17 ppm NO2 (BOC gases) was used
for calibration of the instrument every three hours. Mass flow controllers (MKS) were used to dilute the NO2
stan-dard in zero air and deliver four known concentrations in the range of atmospheric concentrations. Zeros and calibrations were carried out by delivering the gas mix to the top of the inlet housing so that the gases would interact with the inlet in exactly the same manner as during routine sampling and with sufficient flow to overflow the inlet during these diag-nostics. Furthermore, standard additions were carried out by adding a small flow of the NO2 standard during sampling
of the atmosphere to compare the instrument response and check for potential interferences resulting from atmospheric constituents. Due to the influence of water vapour on the fluorescence lifetime on NO2, a humidity correction was
ap-plied to the data. Based on laboratory tests, for every percent water vapour mixing ratio in the atmosphere, the data were corrected upward by 18%. The magnitude of the correction was determined empirically for this specific instrument con-figuration and confirmed by standard additions because it de-pends on the details of the detection scheme and the use of a supersonic expansion. In previous configurations without
a supersonic expansion (Thornton et al., 2000; Day et al., 2003) and in subsequent deployments with different pump-ing and detection schemes, the correction is less than 10% for every percent of water vapour.
The conversion of peroxy nitrates, alkyl nitrates and HNO3to NO2enables us to calibrate using only NO2
stan-dards, however permeation tubes of n-propyl nitrate and HNO3 were also used to check instrument response and,
most importantly, to confirm oven temperature settings. As a result of these diagnostic procedures, the concentrations measured by TD-LIF are accurate to better than 10% for NO2
and 15% for 6PNs, 6ANs, and HNO3. Because it was
nec-essary to cycle through oven pairs, measurement intervals for any compound were roughly 30 min, during which time data were collected at 1 Hz.
Figure 2 shows data acquired while sampling the atmo-sphere and slowly ramping the hotter oven (Oven 1) from a setting above the cool oven (Oven 2) to the same temperature. The y-axis shows that the concentrations in both cells are on average the same when their oven temperatures are the same. The S-shape is consistent with the sample residence time in the oven and the known bond energies and unimolecular dis-sociation kinetics of the reactive nitrogen species being mea-sured. The shapes of these atmospheric scans are consis-tent with those observed using a diffusion tube PAN standard and permeation tube standards of n-propyl nitrate and HNO3
added to both dry zero air and to ambient air, confirming that atmospheric constituents do not influence the decomposition behaviour of the nitrogen oxide species.
Because there is no particle filter on the inlets, aerosol that comprises volatile nitrates (i.e. NH4NO3)thermally
de-composes in the ovens yielding HNO3, further decomposed
to NO2 only in the 550◦C oven. Therefore the values
re-ported for the concentration of HNO3represent the sum of
gas phase and semi-volatile aerosol nitrate. Laboratory stud-ies have confirmed that the measurement does not capture non-volatile aerosol nitrate salts (Bertram and Cohen, 2003). Similarly, we would expect any particulate organic nitrate to contribute to the measurements made following the 330◦C oven. Very little is known about the abundance of particle phase organic nitrates in the atmosphere.
4 Regional transport
Due to its position on the western slope of the Sierra Nevada, Big Hill is subjected to extremely regular wind patterns, es-pecially during the summer. Daytime heating causes upslope flow that draws air from California’s Central Valley east-ward into the higher elevations of the Sierra Nevada range. When the sun sets, the flow reverses and the air drains from higher elevations back toward the valley floor (Fig. 1). This flow regime persists along much of the western slope of the Sierra Nevada (Zhong et al., 2004) and strongly influences the seasonal and diurnal patterns observed in primary and
secondary pollutants seen in the region (van Ooy and Carroll, 1995; Bytnerowicz et al., 2000; Carroll and Dixon, 2002).
Wind speed and direction measurements made at the UC-BFRS, Big Hill, and other sites maintained by the California Air Resources Board in the vicinity show that the general wind direction in the region is from the WSW during the day and the east at night. The UC-BFRS tends to experi-ence winds from the NE at night while flow at Big Hill is from the SE, likely due to topographical differences between the two sites. During upslope advection, the concentration of constituents within the urban plume may be altered by dilu-tion, deposidilu-tion, photochemical transformations and further emissions. Examining the measurements made at sites along the Sacramento – Lake Tahoe transect allows us to separate out these parameters and identify the variables controlling nitrogen oxide concentrations in the Sierra Nevada foothills downwind of Sacramento.
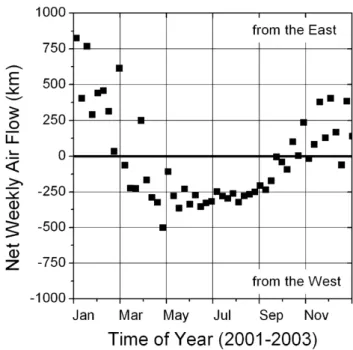
Observations made at these ground sites reflect the pro-cessing of boundary layer airmasses downwind of Sacra-mento during the daytime. Evidence that is described later shows that at 1860 m elevation, Big Hill frequently experi-ences nighttime downslope flow from the free troposphere. The boundary layer is expected to be surface-tracking, at least to elevations of 2000 m in the daytime, and is signifi-cantly shallower at night. Figure 3 shows a calculation of the net weekly east-west airflow averaged for the years 2001– 2003, based on wind speed and direction measurements at UC-BFRS. The data suggest the while net airflow between March and October is from west to east, during the winter months long periods of downslope flow result in the net di-rection of flow at the surface being from Lake Tahoe toward Sacramento. During the winter, daytime upslope flow is gen-erally too short-lived to transport anthropogenic pollutants from the Central Valley significantly further east than Big Hill. Meteorological measurements made at the surface can not capture the effect of flow aloft, which may be particularly different during winter months when storm systems tend to move rapidly from west to east.
On an average midsummer day, an airmass moves roughly 100 km from east to west while the sun is up and then may backtrack 50 km to the west overnight when the flow is re-versed. This pattern results in air sloshing back and forth along the western slopes of the Sierra and contributes to an increase in the regional background of reactive nitrogen. At lower elevation sites, like UC-BFRS, airmasses measured at night were likely also sampled several hours earlier when they passed by in the opposite direction. At Big Hill, mete-orological and chemical observations during the early morn-ing hours suggests that the site is experiencmorn-ing descendmorn-ing air characteristic of the free troposphere. Because of the charac-teristic transport times in the region, derived from local wind speeds and directions, airmasses passing over Granite Bay between 06:00 and 12:00 PST represent the initial conditions of airmasses that reach the UC-BFRS and Big Hill between roughly 11:00 and 20:00.
Fig. 3. Depiction of regional weekly net east-west airflow using
meteorological data from UC-BFRS for the years 2001–2003. Be-tween March and October, net flow in the region is from west to east, however this trend is reversed during the winter months.
5 Results and analyses
Measurements of NO2, total peroxy nitrates, total alkyl
ni-trates and HNO3were made between March 2003 and
Febru-ary 2004 at Big Hill. Meteorological variables, ozone, and PM10were also measured and are incorporated into the
anal-ysis. The corresponding measurements made at UC-BFRS are included to develop a more complete picture of the fac-tors controlling the distribution of reactive nitrogen within the region. The annual cycle of measurements are discussed with reference to seasonal differences and their causes. Then the summertime data (June through October) are analyzed more fully to examine correlations between trace gas con-stituents and climate variables. Diurnal cycles from Big Hill, UC-BFRS, and Granite Bay are compared to derive an un-derstanding about the relative roles of chemical production and loss, dilution and deposition in the urban plume. 5.1 Seasonal cycles in nitrogen oxide species at Big Hill Data were obtained at Big Hill from March 2003– February 2004. Because of electrical power failures virtually no data were collected during May 2003. The nearly com-plete annual cycle allow us to compare meteorology and re-active nitrogen throughout most of the year. Figure 4 presents annual observations of temperature, absolute water vapour, and total reactive nitrogen. For measurements at this re-mote site, we define NOyas the sum of all compounds
5326 J. G. Murphy et al.: Diurnal and seasonal trends in nitrogen oxides
Fig. 4. Full dataset obtained at the Big Hill monitoring site for
NOy, absolute water in parts per thousand, and temperature. Data
acquisition began 5 March 2003 (day 64) and ended on 23 February 2004 (day 54).
contribution from other species is expected to be less than 10% based on comparisons with a total NOy instrument
made at UC-BFRS (Dillon, 2002). The water vapour value is reported as a mole fraction in parts per thousand (ppth). Based on the temperature data, it seems reasonable to con-sider two different sets of conditions: summer (June through October) and winter (November through April). While the relative humidity was quite low during the summer months, the absolute water vapour content is actually higher on av-erage during summer compared to winter. Reactive nitrogen is higher during the summer months at the site though there is substantial day-to-day variability. Most notable perhaps is that the lower values, generally measured during the early morning, reach down almost to zero during the winter but generally not below 0.5 ppb in the summer. This seasonal cycle is consistent with corresponding measurements carried out at the UC-BFRS from 2001–2005. While emissions of precursor NOxare not known to change substantially in the
region by season, what does change is the extent to which these urban emissions are processed and transported to the western slope of the Sierra. As discussed above, net sur-face flow during the winter months is actually from east to west, so reactive nitrogen does not have the same opportu-nity to build up in the foothills and mountains that it does in the summer. The seasonal cycle in NOyat Big Hill and the
UC-BFRS is very different than that observed at sites that do not have a seasonal cycle in transport patterns. For ex-ample, Harvard Forest continues to sample air from urban
Σ Σ
Fig. 5. Annual record of individual NOyi species, NO2, 6PNs,
6ANs and HNO3measured at Big Hill. Data points represent a
3-min average and all concentrations are reported in parts per billion by volume.
sources to a similar extent throughout the year. During win-ter, lower rates of oxidation reduce the conversion of NO2
to HNO3, the ultimate sink of NOy, and therefore maximum
NOyvalues are measured during the winter months (Moody
et al., 1998; Munger et al., 1998). The shallower planetary boundary layer during the winter months also favors the ac-cumulation of higher concentrations of pollutants. Another feature of the sites on the western slope of the Sierras that distinguish them from other locations with annual records is that because precipitation is rare in the western Sierra during the summer, wet deposition only acts as an important sink of NOyduring the winter.
Figure 5 displays the full annual record for all the indi-vidual NOyi compounds at Big Hill. The organic nitrate
species, 6ANs and 6PNs maximize during the summer months, when higher temperatures and photochemical ac-tivity result in increased precursor VOC emissions, more rapid photochemistry and more persistent transport. This pat-tern contrasts with seasonal observations of PAN at more re-mote locations such as northern Japan (Tanimoto et al., 2002) and northern Europe (Beine and Krognes, 2000), which ex-hibit springtime maxima and summertime minima. HNO3
is also generally higher during the summer months, averag-ing around 0.5 ppb, but higher excursions tend to occur dur-ing the winter months. NO2has the weakest seasonal cycle,
likely because of compensatory effects between transport and chemistry. During the hot summer months, strong transport
J. G. Murphy et al.: Diurnal and seasonal trends in nitrogen oxides 5327
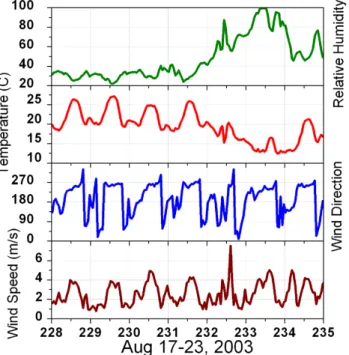
Fig. 6. Observations of relative humidity (%), temperature (◦C), wind direction, and wind speed (m/s) from a typical summer week at Big Hill.
of urban emissions to remote high-elevation sites is offset by rapid photochemical oxidation of NOxto NOy. In the winter,
the plume has barely reached the site before downslope flow carries the urban influence away but a much greater fraction of the total NOyremains as NO2due to reduced
photochem-istry.
Many of the winter season high NOyevents, especially in
November 2003, occurred during prescribed burning events carried out by the U.S. Forest Service or Sierra Pacific Indus-tries, who own much of the nearby forests. Smoke plumes could also be seen from upwind apple orchards and vine-yards. During these nearby burning events, NO2and HNO3
were the most substantial contributions to NOyand
particu-late nitrate was likely an important constituent based on data from the BAM and two week samplers. Some of the low values of reactive nitrogen measured during the winter are the result of precipitation events that scrub soluble forms of NOy, such as HNO3, from the atmosphere.
5.2 Summer and winter timelines at Big Hill
In this section a summer week and a winter week are exam-ined in more detail. Figure 6 shows meteorological data from a typical summer week that starts with hot dry conditions, with a cooler wetter weather pattern moving in on day 232. The pattern of upslope–downslope flow is dominant on all days except the day of the weather shift. Daytime winds are close to 4 m/s, while at night wind speeds average around 1 m/s and are more variable in direction.
Fig. 7. Observations of NOyand O3(ppb) and PM10 (µg/m3)from
a typical summer week at Big Hill.
Figures 7 and 8 show the observations of ozone, total NOy,
PM10and the individual NOyspecies for the same time
pe-riod. The late afternoon maximum observed for most species is consistent with transport of urban pollutants by daytime upslope flow along the western Sierra slopes. Interestingly, while NO2 and 6PNs exhibit the characteristic afternoon
peak on day 230, it is noticeably absent in both O3 and
in 6ANs, which are a co-product of ozone (Darnall et al., 1976). In general, the patterns of NOy and O3 track each
other during the summer months. However, an exception is that total NOyvalues do not decrease significantly at the end
of the week, yet ozone is close to 30 ppb, and there is little apparent photochemical production.
Figure 9 shows the same meteorological variables as Fig. 6, but for a week in late November. Winter condi-tions are less consistent than during the summer, but this data demonstrate some widespread features of winter ob-servations at Big Hill. The weather is cooler and the rela-tive humidity is higher during this time period than in the summer. Several days of strong flow from the southwest are interrupted on day 324 with a return to the more com-mon upslope–downslope pattern but with weaker winds. Fig-ure 10 shows that the diurnal variability of ozone has dimin-ished significantly compared to summer and values for the week all lie between 45 and 65 ppb. Ozone during this period is not correlated with NOy, likely because NOyis influenced
by burning events during days 322–324. Figure 11 shows that strong flow from the west delivered high concentrations of NO2, HNO3(and likely particulate nitrate) to the Big Hill
site, probably due to plumes from upwind burning events. At the end of the weeklong period, a diurnal cycle in NO2,
5328 J. G. Murphy et al.: Diurnal and seasonal trends in nitrogen oxides
Σ Σ
Fig. 8. Observations of NO2, 6PNs, 6ANs and HNO3 from a typical summer week at Big Hill.
°
Fig. 9. Observations of relative humidity (%), temperature ( ˚ C),
wind direction, and wind speed (m/s) from a typical winter week at Big Hill.
and especially 6PNs can be seen with the return to the usual flow pattern. Just as ozone concentrations have ceased to rise significantly above background values in the region, 6ANs remains very low throughout most of the winter.
µ
Fig. 10. Observations of NOyand O3(ppb) and PM10 (µg/m3)
from a typical winter week at Big Hill.
5.3 Summer diurnal profiles of meteorology, trace gases and particles
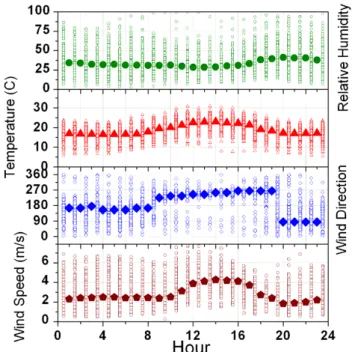
Figure 12 demonstrates the remarkably consistent meteo-rology experienced by the Big Hill site during the summer months (defined as June through October in this analysis). Temperatures were between 10 and 30◦C, with an average swing of approximately 7◦C between night and day. Rain was extremely rare and the relative humidity was generally between 25 and 50%. With the exception of very few days, between roughly 09:00 and 20:00, the wind blows from the west. Wind direction during the night is more variable but is generally from the east or southeast. Wind speed maxi-mizes during the afternoon at about 4 m/s, and is slowest in the early evening when the predominant flow is changing di-rection from upslope to downslope. Wind speeds during the night are more variable but are generally slower than during the day. We exploit the consistency of the transport and cli-mate variables to analyze the data statistically without any prior meteorological filtering and to develop our understand-ing of the important parameters involved in determinunderstand-ing NOy
distribution in the region.
Figure 13 depicts the diurnal cycles of ozone, particulate matter, and total reactive nitrogen at Big Hill. As a result of daytime flow from the Sacramento Valley toward the site, and the photochemical processing that occurs along the way, all three of these variables maximize around 18:00–20:00, just before downslope flow begins. The minimum values in each of the variables occur around 10:00 just after upslope flow begins. The summertime diurnal cycles in the individ-ual reactive nitrogen species are shown in Fig. 14. To gain
J. G. Murphy et al.: Diurnal and seasonal trends in nitrogen oxidesΣ Σ 5329
Fig. 11. Observations of NO2, 6PNs, 6ANs and HNO3from a
typical winter week at Big Hill. Note different axes on NO2panel.
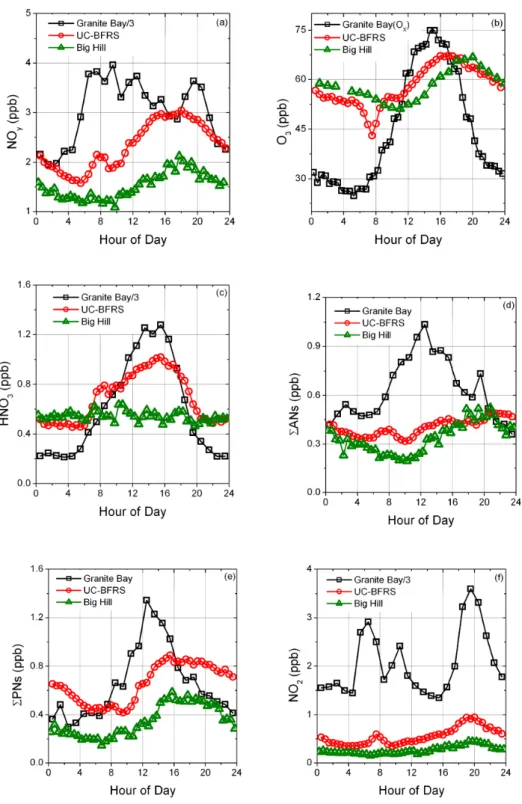
further perspective on the factors controlling the distribution of reactive nitrogen and ozone along the western slope of the Sierras, a comparison can be made between observations at Granite Bay, UC-BFRS, and Big Hill. The diurnal profiles in Fig. 15 are restricted to data acquired during the months of July through September at all sites, because of the more lim-ited temporal coverage of the Granite Bay data set. For NO2,
HNO3, and NOy, measurements from Granite Bay have been
divided by three to put them on the same scale as the remote sites. In contrast concentrations of organic nitrates at all three sites are approximately in the same range. While the sum of species measured by TD-LIF adequately represents NOyat
remote sites like Big Hill and UC-BFRS, NO is a signifi-cant fraction of daytime reactive nitrogen at Granite Bay and has been estimated using chemical and meteorological fac-tors (Cleary et al., 2005) for Fig. 15.
Mobile emissions are the main source of nitrogen oxides in the Sacramento Valley, thus concentrations of NOy
in-crease substantially during morning rush hour, often exceed-ing 10 ppb at Granite Bay (Fig. 15a). The increase in NOy
shortly before noon at the remote sites is consistent with a 5– 6 h upslope transit time of the urban emissions. NOyis better
conserved than any of the individual constituent species and is mainly lost to deposition and dilution. At UC-BFRS, NOy
peaks between 15:00 and 18:00 with concentrations roughly one quarter of the NOyleaving Granite Bay five hours
ear-lier. At Big Hill, peak NOy concentrations occur between
16:00 and 19:00 and have been reduced further to roughly one fifth of the initial concentrations in the plume when it
Fig. 12. Observations of relative humidity (%), temperature (◦C), wind direction, and wind speed (m/s) by hour of day for the entire summer (June through October) at Big Hill. Individual hourly data points for each day (open symbols) are overlaid by the averages (mode for wind direction and mean for other variables) for each hour (solid symbols).
left Sacramento. Emissions during the evening rush hour do not have time to travel far upslope before the sun sets and the flow reverses, preventing these emissions from moving upslope. The small early morning rise in NOyand its
con-stituent species at UC-BFRS has been interpreted to result from the break up of the morning boundary layer, allowing air that has not been subjected to surface losses mix down from above (Day, 2003).
In contrast to NOy, which is a tracer both of primary urban
emission and their secondary photochemical products, ozone is solely a secondary pollutant. For Granite Bay, odd oxygen (Ox≡O3+ NO2)is plotted to account for the effect of recent
NOx emissions on the conversion of ozone (Fig. 15b). At
the remote sites, recent NOxemissions are not important and
NO2accounts for less than 3% of odd oxygen and ozone is
plotted alone. At Granite Bay, the Oxprofile reflects rapid
photochemical production of ozone in the urban and subur-ban environment. Ozone produced in Sacramento is advected upslope, and ozone production also continues during transit. Ozone is lost through deposition and dilution, though the re-gional background is not sufficiently low to make dilution a rapid sink. The dip in ozone between 06:00 and 09:00 at UC-BFRS is associated with the opening of plant stomata coincident with sunrise (Kurpius and Goldstein, 2003). This feature is not observable at Big Hill, likely due to the lack of local vegetation. During upslope flow, Big Hill consistently
5330 J. G. Murphy et al.: Diurnal and seasonal trends in nitrogen oxides
µ
Fig. 13. Diurnal profile of summertime observations of NOyand
O3(ppb) and PM10(µg/m3)at Big Hill. Individual measurements
(open shapes) of O3and PM10were made every hour at Big Hill, and the NOydata have been averaged to half hour points. The
aver-age value for every hour or half hour is overlaid in the solid points.
has less ozone than UC-BFRS, however during periods of downslope flow, O3 concentrations are higher at Big Hill.
This may reflect the fact that nighttime chemical and depo-sition losses for O3are less efficient at the higher elevation,
exposed site.
HNO3has a remarkably flat diurnal profile at the Big Hill
site, in contrast to measurements made by TD-LIF at both the UC-BFRS and Granite Bay, a Sacramento suburb (Fig. 15c). At those sites, the profile of HNO3followed that of the sun,
peaking in the middle of the day and staying relatively flat at low concentrations during the night. During the day, HNO3
at Big Hill is lower because the site is further from the NOx
source and the HNO3produced during plume transit has had
more time to deposit. The continuing loss of NO2in the
day-time plume as it moves eastward likely results in lower OH in remote regions, reducing the local production rate of HNO3
considerably near Big Hill. The deposition rate of HNO3is
rapid (∼hours), so in the absence of production, HNO3 in
an airmass in constant contact with the surface would be ex-pected to go to zero during the night. The photochemical production of nitric acid does not occur at night, however NO3 chemistry and heterogeneous N2O5chemistry can act
as a nighttime source (Geyer et al., 2001; Brown et al., 2006). The heterogeneous production of HNO3is quadratic in NO2,
is favoured by high aerosol surface area, and competes with NO3 reactions with VOC. Wintertime measurements in the
San Francisco Bay Area suggested that under cool, humid conditions the conversion of NOxto HNO3can be equally or
Σ Σ
Fig. 14. Diurnal profile of summertime observations of NO2,
6PNs, 6ANs and HNO3 at Big Hill. Individual half hour data
points for each day (open symbols) are overlaid by the averages for each half hour (solid symbols).
more efficient at night than reactions with OH during the day (Wood et al., 2005). The plateau in HNO3 concentrations
overnight at Granite Bay suggest that nighttime production may be occurring, but this could only be quantified with fur-ther information about aerosol surface area and VOC reactiv-ity toward NO3. At the remote sites, significantly lower
con-centrations of NO2discourage N2O5 production, but again
aerosol surface area and VOC reactivity need to be known to quantify possible production rates.
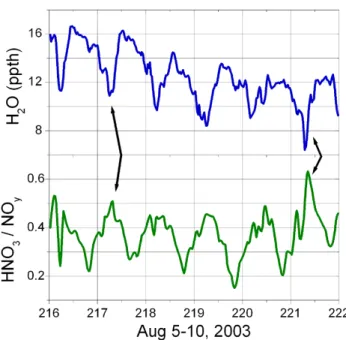
An alternative explanation for the non-zero concentrations of HNO3at these remote surface sites is the mixing down of
airmasses that have not been recently near the surface. At Big Hill, the water vapour mixing ratio frequently decreases abruptly shortly after midnight, suggesting that the site is ex-periencing mixing from above of drier airmasses that have less total NOybut of which HNO3 is a relatively important
constituent. Because of the high elevation at Big Hill, the site appears to sample descending air characteristic of the free troposphere, in which the HNO3formed has not had the
opportunity to deposit. An illustration of this effect can be found in Fig. 16, a time series of absolute water concentration and the ratio of HNO3/NOyobserved at Big Hill.
Observa-tions of relatively high nighttime HNO3at remote sites likely
reflect the presence of descending airmasses rather than a sig-nificant heterogeneous source.
Alkyl nitrates are formed photochemically through the as-sociation of peroxy radicals with nitric oxide. During the
Fig. 15. Diurnal trends in reactive nitrogen species and ozone at three sites along the Sacramento urban plume. Because Granite Bay
measurements were made in the months of July–September, observations from Big Hill and the UC-BFRS are limited to those months also.
night they may also be produced by the oxidation of unsatu-rated VOC by the NO3radical. The RO2+NO reaction also
forms ozone, hence alkyl nitrate concentrations are generally a good indication of ozone production. Alkyl nitrates have
also been observed to be correlated with carbon monoxide at remote sites (Flocke et al., 1991; Shepson et al., 1993) how-ever the CO monitor at Big Hill did not have sufficient sensi-tivity to make measurements during the campaign. In Granite
5332 J. G. Murphy et al.: Diurnal and seasonal trends in nitrogen oxides
Fig. 16. Time series of absolute water vapour (upper panel) and the
fraction of total reactive nitrogen that is nitric acid (lower panel). Arrows indicate two of the periods when sharp decreases in water are associated with an increasing importance of nitric acid in the reactive nitrogen budget.
Bay, 6ANs rise quickly in the morning and then remain rela-tively constant throughout the afternoon (Fig. 15d). At the re-mote sites, alkyl nitrates are at a minimum in the early morn-ing and exhibit peak values in the late afternoon. 6ANs are a significant constituent of NOyin the Sacramento plume at
these downwind locations, while nighttime measurements at Big Hill suggest that the airmasses characteristic of the free troposphere contain relatively low concentrations of 6ANs. TD-LIF observations of 6ANs at these sites are substantially larger than those reported by researchers measuring individ-ual alkyl nitrates by GC-MS (Day et al., 2003; Cleary et al., 2005). Because the TD-LIF technique takes advantage of the characteristic bond energies of organic nitrates, it does not require prior identification of specific organic groups and the measurement represents the sum of all ROxNO2
com-pounds in the atmosphere. The speciation of the alkyl ni-trates observed at Big Hill is unclear, though the dominance of VOC reactivity by isoprene between Sacramento and Big Hill suggests that alkyl nitrates derived from isoprene prod-ucts are likely important. The sinks of complex alkyl nitrates are poorly understood, though their thermal decomposition and photolysis lifetimes exceed several days. The presence of hydroxy-groups or unsaturated bonds in the organic chain may reduce the lifetime of a specific compound (e.g. Gia-copelli et al., 2005, and references therein), though if it reacts to form a different alkyl nitrate, it will not register as a loss of 6ANs as seen by the TD-LIF measurements. Measurements in the western Sierra region suggest that 6ANs are a
sig-° °
Fig. 17. Distribution of NOyduring daytime upslope flow at Big
Hill. The data were separated by temperature such that chart (a) in-cludes data from days on which the daytime maximum temperature at the site exceeds 21◦C, while chart (b) shows data from cooler days on which the temperature was never higher than 21◦C.
nificant fraction of NOyand that they tend to be long-lived,
suggesting that they contribute substantially to the reactive nitrogen that is exported from the region and mixed into the free troposphere. The ability of alkyl nitrates to deposit to surfaces and contribute to nitrogen deposition is poorly un-derstood.
6PNs are formed through the association of a peroxy rad-ical and nitrogen dioxide, but only those derived from acyl peroxy radicals are stable enough to survive in the lower at-mosphere. The most common peroxy nitrate, peroxy acetyl nitrate (PAN), is the result of the photochemical oxidation of oxygenates in the presence of NOx. Acyl peroxy nitrates act
as a thermally labile reservoir for both RO2 and NO2
icals and therefore on cooler days can sequester these rad-icals and reduce photochemical ozone production. Peroxy nitrates can also transport reactive nitrogen far from its orig-inal source, and act as radical sources upon subsequent de-composition (Singh, 1987). Organic nitrates have relatively low water solubility and their contribution to reactive nitro-gen deposition is not well understood. In Granite Bay, the diurnal profile of 6PNs reflects rapid production and an ap-proach to the photostationary state between these reservoir species and their radical precursors (Fig. 15e). The diurnal profiles at UC-BFRS and Big Hill are very similar, broadly peaking between 14:00 and 22:00 at values more than double those observed during early morning hours. While absolute concentrations of 6PNs are consistently lower at Big Hill than at UC-BFRS, there is more 6PNs per unit of precur-sor NO2at the more remote site. The equilibrium between
radicals and 6PNs is extremely temperature dependent and likely the temperatures experienced by the average airmass reaching Big Hill are colder, pushing a greater fraction of the precursor into the reservoir form.
Figure 15f shows that nitrogen dioxide is strongly influ-enced by local traffic patterns at Granite Bay. At the remote
sites, NO2has a strong diurnal cycle and has the latest peak
of all of the reactive nitrogen compounds. The delayed tim-ing of the peak concentrations can be explained by a com-bination of transport and photochemistry. The NO2emitted
into the plume takes around 6 h to arrive at the UC-BFRS and Big Hill sites. Air masses leaving Sacramento in the late morning are advected up the Sierra when photochemical ac-tivity is peaking, and the conversion of NOxto higher NOy
species is maximized. Air leaving Sacramento in the after-noon and arriving at the remote sites in the early evening ex-periences lower levels of actinic radiation and therefore the later part of the plume has a larger fraction of NO2
remain-ing. Peak concentrations in the plume are roughly double the early morning minimum values.
5.4 Summertime distribution of reactive nitrogen and cor-relation with other variables
Changes in climate can be expected to drive differences in both transport and chemistry, affecting the geographical and temporal extent to which the urban plume influences remote sites, and the chemical partitioning with the plume. One of the most important climate variables that governs the distri-bution of reactive nitrogen oxides is temperature. The Big Hill summertime data were divided into two sets of days, half of which had a maximum daytime temperature above 21◦C and half of which did not. The average amount of NOy in
the plume (13:00–20:00) was 1.71±0.04 ppb (twice the stan-dard deviation of the mean) on cold days and 1.91±0.04 ppb on hot days, suggesting that higher local temperatures may indicate a slightly stronger transport efficiency of the plume, a longer photochemical lifetime of NOyin the plume, or
in-creased emissions, possibly from soil. The partitioning of reactive nitrogen among its constituent species is strongly in-fluenced by temperature as shown in Fig. 17. The left panel shows the partitioning among NOyspecies arriving at the site
between 13:00–20:00 on days when the maximum temper-ature exceeded 21◦C. Comparison with cooler temperature data displayed in the right panel shows that while NO2has
undergone similar amounts of photochemical processing un-der both sets of conditions, lower temperatures favour the accumulation of peroxy nitrates over the production of alkyl nitrates. Peroxy nitrates account for over one third of the reactive nitrogen at the cooler temperatures, sequestering a substantial amount of reactive nitrogen in this reservoir. The reduced contribution of alkyl nitrates at lower temperatures is consistent with fewer RO2 and NOxradicals available to
react to form ozone. Indeed, the mean ozone in the plume on the hot days is 64 ppb, while on cool days it is 58 ppb. Another facet of the temperature effect may be the increased emissions of many biogenic VOC at higher temperatures. A shift in the hydrocarbon composition toward longer chain compounds as opposed to carbonyl compounds could favour the production of alkyl nitrates over peroxy nitrates.
The correlation between total reactive nitrogen and the mole fraction of water is strong at Big Hill, as suggested by Fig. 16. The relationship between H2O and NOyis not as
clear at the UC-BFRS, where it is likely that the transpira-tion of nearby vegetatranspira-tion has a strong influence on the water budget at the site. In contrast, water vapour appears to be a good indicator of transport of polluted airmasses at a high elevation site such as Big Hill. This is consistent with nu-merical simulations (Kimura and Kuwagata, 1995) and ob-servations (Ohtani, 2001) in other areas that show thermally induced local circulations that transport water vapour from low elevations to mountainous areas. The absolute humidity of the airmass records the degree of mixing that the relatively moist, polluted urban plume has undergone in transit to the high elevation site. Observations during the night at Big Hill show that the air descending from the free troposphere tends to be much drier and have reduced total reactive nitrogen.
The implication is that nighttime observations at Big Hill allow us to occasionally sample airmasses that have not had recent contact with the surface. These airmasses may have traveled above the boundary layer during the daytime and have subsequently descended to the surface to undergo downslope transport at night. These airmasses have lower concentrations of H2O and NOythan those that are observed
during upslope flow and their concentrations likely reflect the degree to which earlier surface emissions have mixed with cleaner air from the free troposphere. While the fractional contribution of HNO3 to NOy was higher in these
night-time airmasses, the absolute concentration of HNO3was no
higher than in the daytime plumes.
Figure 18 depicts the strong correlation between reactive nitrogen and ozone at the Big Hill monitoring site throughout the summer. Observations made during afternoon upslope flow are highlighted, however the urban plume still appears to influence the site with higher values for ozone and NOy
during the night. Many of these high nighttime values are measured shortly after the wind has shifted direction and the air passing back by the site is still characteristic of plume air. The relationship between NOyand ozone is expected
be-cause both are derived from precursor emissions of nitrogen oxides. While in urban areas with high NOxconcentrations,
ozone can be negatively correlated with NOx, in remote areas
like Big Hill we expected ozone production to be limited by the availability of nitrogen oxides. Minimum values of NOy
(<1 ppb), which occur in the early morning hours, are asso-ciated with ozone levels between 35 and 60 ppb, while maxi-mum values of NOy(>2.5 ppb) are associated with ozone
be-tween 65 and 95 ppb. Clearly the chemistry and transport pat-terns responsible for transforming nitrogen oxides and trans-porting them along the western slope of the Sierra Nevada have similar effects for ozone and total reactive nitrogen.
5334 J. G. Murphy et al.: Diurnal and seasonal trends in nitrogen oxides
Fig. 18. Relationship between ozone (ppb) and reactive nitrogen
(ppb) during summer months at Big Hill. Observations made during upslope flow in the plume are highlighted with open squares.
5.5 Probability distributions of NOyiand ozone
A great deal of insight can be gained by comparing obser-vations made at Big Hill to corresponding measurements at the UC-BFRS site. Table 1 compiles data from the proba-bility distributions shown in Fig. 19 for the two remote sites. As mentioned above, both sites lie along the Sacramento – Lake Tahoe transect, but Big Hill is at a higher elevation, a greater distance from the city, and has less vegetation and cooler temperatures. Our analyses of the diurnal cycles at the two sites suggest that they sample similar airmasses during upslope flow and we restrict the comparison to times between 13:00–20:00 when both sites are strongly influenced by the Sacramento urban plume. Panels (a–f) of Fig. 19 show the normalized probability distributions for 30 min averages of the individual reactive nitrogen species, total NOy, and O3
for both the Big Hill and the UC-BFRS sites. In the case of NO2, Big Hill values (median 0.33 ppb) are on average half
those at the UC-BFRS with significantly fewer observations of more than 1 ppb. This means that the dilution and photo-oxidation of NO2in the plume is quickly reducing its
con-centration several hours downwind of Sacramento. In this region, ozone production is expected to be NOx-limited so
it can also be inferred that instantaneous ozone production rates drop off quickly between the UC-BFRS and Big Hill.
Peroxy nitrates have a wider probability distribution at the UC-BFRS than at Big Hill and higher median observations. While absolute 6PNs concentrations are higher on average at UC-BFRS, the ratio of peroxy nitrates to NO2 is
actu-ally higher at Big Hill during the influence of the plume, likely due to the lower temperatures, stabilizing the reservoir
species. At night, the ratio of 6PNs/NO2 becomes higher
at UC-BFRS. More detailed modeling is required to explain these diurnal patterns quantitatively.
The probability distributions of alkyl nitrates are ex-tremely similar at the two sites, but for different reasons. The breadth in the distribution at Big Hill derives from a stronger diurnal cycle whereas at the UC-BFRS, it results from greater day-to-day variability. Nevertheless, detailed comparison of the observations of alkyl nitrates at the two sites suggests that as a group these compounds are lost very slowly to de-position but are diluted when mixed with air from the free troposphere. Correlations between alkyl nitrates and both CO and O3at UC-BFRS show that they are associated with
polluted, upslope air, which also carries substantial biogenic emissions, and are formed in conjunction with ozone dur-ing photochemical activity. The deposition of most alkyl ni-trates appears to be slow enough that a substantial fraction of what is produced in the plume stays in the atmosphere. From the perspective of nitrogen deposition, not enough is known about the behaviour of these compounds at the surface.
HNO3 concentrations are lower and less variable at Big
Hill compared to the UC-BFRS. The flat diurnal profile for HNO3at Big Hill suggests that this site is far enough from
fresh NOx sources during the day that much of the HNO3
produced during oxidation has already had the chance to deposit before reaching the surface at high elevation sites, and that at night the site is strongly influenced by mixing from above. The UC-BFRS has higher daytime NO2
con-centrations capable of generating strong local production of HNO3. The substantial reduction in daytime
concentra-tions of HNO3as the plume moves from Granite Bay
ups-lope toward UC-BFRS and eventually Big Hill, require that significant amounts of HNO3 are lost from the boundary
layer, either through deposition to the surface or export to the free troposphere.
The distribution of total NOy(Fig. 19e) at the two sites
re-flects the proximity of the UC-BFRS to Sacramento in both the higher average and the greater variability in concentra-tions. At the UC-BFRS, the total NOy in the plume varies
between 1.0–5.5 ppb, whereas at Big Hill it ranges from 0.5– 3.5 ppb. The data used in this analysis were not limited to days on which there was persistent upslope flow, thus some of the lower numbers likely result from days on which the ur-ban plume did not influence the site. The greater variability in total NOycompared to any of its constituent species shows
that the variability in NOyiis governed by the extent to which
the total urban emissions are influencing these remote sites rather than by differences in partitioning among the available reactive nitrogen. For example, days with higher than aver-age 6PNs tend to have higher 6ANs and HNO3also. It is
not clear from the local meteorological observations, which conditions, aside from wind direction and to a much lesser degree temperature, result in higher concentrations of reac-tive nitrogen being transported in the boundary layer along the western slope of the Sierra.
Table 1. Data for June–October, 13:00–20:00 at the UC-BFRS and Big Hill. For each species listed the median, and 5th and 95th percentile
values have been calculated in ppb.
UC-BFRS Big Hill
Species Median 5th 95th Median 5th 95th
(ppb) percentile percentile (ppb) percentile percentile
NO2 0.63 0.30 1.70 0.33 0.16 0.78 6PN 0.79 0.27 1.75 0.55 0.21 1.07 6AN 0.41 0.15 0.77 0.39 0.16 0.78 HNO3 0.79 0.33 1.48 0.53 0.25 0.85 NOy 2.68 1.57 4.92 1.84 1.05 2.99 O3 61.5 40.7 88.4 60 45 82
Finally, the distribution of ozone within the urban plume is shown for each site in Fig. 19f. The median ozone concen-tration at each site is very similar, but the UC-BFRS shows both more low values and more high values. The similar-ity between the two sites results partly from the fact that daytime ozone values are generally not more than a fac-tor of two higher than the regional background, so mixing with the background drives concentrations toward a common value. From a regulatory standpoint, the UC-BFRS site is much more likely to exceed the federal 8-h ozone standard because of the significantly higher number of observations above 84 ppb. Comparison of ozone at the two sites suggests that the efficiency of ozone production has slowed consider-ably by the time the plume has reached the UC-BFRS, and it can no longer match the decreases in ozone due to dilution and deposition as the air moves toward Big Hill. This infor-mation can be used to ascertain the extent of influence of the urban plume on ozone in the region.
6 Conclusions
This paper describes the annual cycle of reactive nitrogen measurements made at Big Hill, a high elevation site on the western slope of the Sierra Nevada mountains in California. Throughout the year, terrain-driven winds bring air from the Central Valley upslope into the Sierra Nevada foothills, re-sulting in increased concentrations of primary and secondary pollutants in the region. The upslope transport is more per-sistent during summer months, resulting in net westerly flow at the surface. The increased radiation and emissions of bio-genic VOC in the summer result in more rapid photochemical oxidation within the plume. During winter, anthropogenic emissions still influence the Big Hill site, but for a smaller portion of the day. In the winter, a more significant fraction of the NOyin the urban plume remains as NO2reflecting the
longer chemical lifetime. Intermittent burning events also
in-fluenced winter measurements and resulted in elevated NO2,
NOy, and PM10concentrations.
This analysis also synthesizes the summertime observa-tions of reactive nitrogen and ozone made at Big Hill with two other sites in the outflow of the Sacramento urban plume. Comparison of the diurnal trends at the three sites shows that the distribution of reactive nitrogen in the region is a complicated function of emissions, photochemistry, mixing, transport and deposition. During daylight hours, the sites are connected by the prevailing westerly upslope flow. When the plume reaches Big Hill it has lower concentrations of NO2, 6PNs, and HNO3 than at UC-BFRS. While the
ab-solute amounts of 6PNs and HNO3 are lower at Big Hill
and Blodgett, the concentrations normalized to the NO2
pre-cursor are higher, showing that the plume has been further oxidized by the time it gets to Big Hill.
The strong diurnal cycles in HNO3at Granite Bay and the
UC-BFRS suggest that a large sink to deposition competes with rapid production in the boundary layer. As the plume reaches Big Hill, a significant fraction of the HNO3produced
along the way has been lost to deposition and dilution and de-creasing concentrations of NO2result in relatively low local
production. During the night, descending air from the free troposphere contains nearly as much HNO3as that found in
the shallow urban boundary layer at Granite Bay. Because peroxy nitrates are in thermal equilibrium with NO2(τ ∼1 h),
changes in concentrations of 6PNs between the UC-BFRS and Big Hill are a balance between increased sequestration due to lower temperatures and release of NO2 to
compen-sate for the rapid loss of NO2 in the plume. Temperature
plays a large role in determining the fraction of nitrogen oxide radicals that are stored as 6PNs in the plume. Low temperatures decrease the rate of ozone production in the re-gional boundary layer, but may result in the export of more NOy in a reservoir form capable of leading to ozone
pro-duction further downwind. A recent analysis of the effect of mountain venting on photochemistry in the free troposphere shows that subsequent production and loss of ozone depends
5336 J. G. Murphy et al.: Diurnal and seasonal trends in nitrogen oxides
Fig. 19. Overlaid normalized probability distributions (frequency of measurements in %) for half hour averages of NOyi, NOyand O3
observations made during the summer plume at the UC-BFRS (red) and Big Hill (black). critically on the concentration of nitrogen oxides and peroxy
acyl nitrates injected from the boundary layer (Henne et al., 2005). Our observations show that at Big Hill, the site fur-ther downwind and upslope, a greater fraction of NO2 has
been sequestered in 6PNs, suggesting these species are an important constituent of the reactive nitrogen that may be ul-timately injected into the free troposphere.
Interestingly, the concentrations of O3 and 6ANs in the
plume at Big Hill are comparable to those at UC-BFRS, perhaps offset by an hour. This can be rationalized by a com-parison of sources and sinks of these compounds, and those of HNO3 and 6PNs. While the production rate of HNO3
falls off sharply as the plume advects and dilutes, the opti-mal range for the production of ozone and organic nitrates
is likely found further downwind, both due to a decrease in nitrogen oxides (to a more optimal value), and an increase in biogenic VOC. The deposition rates of ozone and 6ANs are believed to be significantly lower than that of HNO3so they
persist for longer in the plume once they have been produced. Unlike 6PNs, they have no rapid decomposition pathway back to NOxand therefore, once produced, cannot respond
to decreasing NO2as the plume evolves. The measurements
imply that 6ANs could be a significant fraction of the NOy
exported to the free troposphere, a contribution that is not included in many current analyses (e.g. Parrish et al., 2004; Henne et al., 2005).
Acknowledgements. Measurements at Big Hill were made in
collaboration with the California Air Resources Board under Contract No. 01-327. We gratefully acknowledge that support and the U.S. Department of Energy support for measurements at Granite Bay under contract AC03-76SF0009. Observations at the UC-BFRS were supported by NSF ATM-0138669. We thank M. McKay and A. Goldstein for assistance with meteorological and ozone data from the UC-BFRS and Granite Bay. We are grateful to the Eureka Union School District, Sierra Pacific In-dustries, and the United States Forest Service for the use of the sites. Edited by: A. Hofzumahaus
References
Beine, H. J. and Krognes, T.: The seasonal cycle of peroxyacetyl nitrate (PAN) in the European Arctic, Atmos. Environ., 34, 933– 940, 2000.
Bertram, T. H. and Cohen, R. C.: A prototype instrument for the real time detection of semi-volatile organic and inorganic nitrate aerosol, American Geophysical Union Fall Meeting, San Fran-cisco, A51F-0740, 2003.
Blumenthal, D. L., White, W. H., and Smith, T. B.: Anatomy of a Los-Angeles smog episode - pollutant transport in daytime sea breeze regime, Atmos. Environ., 12, 893–907, 1978.
Brown, S. S., Ryerson, T. B., Wollny, A. G., Brock, C. A., Peltier, R., Sullivan, A. P., Weber, R. J., Dube, W. P., Trainer, M., Meagher, J. F., Fehsenfeld, F. C., and Ravishankara, A. R.: Vari-ability in nocturnal nitrogen oxide processing and its role in re-gional air quality, Science, 311, 67–70, 2006.
Bytnerowicz, A., Carroll, J. J., Takemoto, B. K., Miller, P. R., Fenn, M. E., and Musselman, R. C.: Distribution and transport of air pollutants to vulnerable California ecosystems, in: Integrated Assessment of Ecosystem Health, Ann Arbor Press, Chelsea, MI. 93–118, 2000.
Carroll, J. J. and Dixon, A. J.: Regional scale transport over com-plex terrain, a case study: tracing the Sacramento plume in the Sierra Nevada of California, Atmos. Environ., 36, 3745–3758, 2002.
Cleary, P. A., Wooldridge, P. J., and Cohen, R. C.: Laser-induced fluorescence detection of atmospheric NO2with a commercial
diode laser and a supersonic expansion, Appl. Opt., 41, 6950– 6956, 2002.
Cleary, P. A., Murphy, J. G., Wooldridge, P. J., Day, D. A., Millet, D. B., Goldstein, A. H., and Cohen, R. C.: Observations of total
alkyl nitrates within the Sacramento urban plume, Atmos. Chem. Phys. Discuss., 5, 4801–4843, 2005,
http://www.atmos-chem-phys-discuss.net/5/4801/2005/. Darnall, K. R., Carter, W. P. L., Winer, A. M., Lloyd, A. C., and
Pitts, J. N.: Importance of RO2+NO in alkyl nitrate
forma-tion from C4-C6 alkane photooxidaforma-tions under simulated atmo-spheric conditions, J. Phys. Chem., 80, 1948–1950, 1976. Day, D. A., Wooldridge, P. J., Dillon, M. B., Thornton, J. A.,
and Cohen, R. C.: A Thermal Dissociation-Laser Induced Fluorescence instrument for in situ detection of NO2, Per-oxy(acyl)nitrates, Alkylnitrates and HNO3, J. Geo. Res.-A., 107,
4046, doi:10.1029/2001JD000779, 2002.
Day, D. A.: Observations of NO2, Total Peroxynitrates, Total Alkyl
Nitrates, and HNO3in the Mid-Sierras and Sacramento Plume
Using Thermal Dissociation – Laser Induced Fluorescence, Uni-versity of California, 207 p., 2003.
Day, D. A., Dillon, M. B., Wooldridge, P. J., Rosen, R. S., Wood, E. C., and Cohen, R. C.: On alkyl nitrates, O3and the “missing
NOy”, J. Geo. Res.-A., 108, 4501, doi:10.1029/2003JD003685,
2003.
Dillon, M. B.: The Chemical Evolution of the Sacramento Urban Plume, University of California, 205 p., 2002.
Dillon, M. B., Lamanna, M. S., Schade, G. W., Goldstein, A. H., and Cohen, R. C.: Chemical evolution of the Sacramento ur-ban plume: Transport and oxidation, J. Geo. Res.-A., 107, 4045, doi:10.1029/2001JD000969, 2002.
Fahey, D. W., Hubler, G., Parrish, D. D., Williams, E. J., Norton, R. B., Ridley, B. A., Singh, H. B., Liu, S. C., and Fehsenfeld, F. C.: Reactive Nitrogen Species in the Troposphere – Measurements of NO, NO2, HNO3, Particulate Nitrate, Peroxyacetyl Nitrate
(PAN), O3, and Total Reactive Odd Nitrogen (NOy)at Niwot
Ridge, Colorado, J. Geophys. Res.-A., 91, 9781–9793, 1986. Flocke, F., Volzthomas, A., and Kley, D.: Measurements of Alkyl
Nitrates in Rural and Polluted Air Masses, Atmos Environ., 25, 1951–1960, 1991.
Geyer, A., Alicke, B., Konrad, S., Schmitz, T., Stutz, J. and Platt, U.: Chemistry and oxidation capacity of the nitrate radical in the continental boundary layer near Berlin, J. Geophys. Res.-A., 106, 8013–8025, 2001.
Giacopelli, P., Ford, K., Espada, C., and Shepson, P. B.: Com-parison of the measured and simulated isoprene nitrate distribu-tions above a forest canopy, J. Geophys. Res.-A., 110, D01304, doi:10.1029/2004JD005123, 2005.
Hayden, K. L., Anlauf, K. G., Hastie, D. R., and Bottenheim, J. W.: Partitioning of reactive atmospheric nitrogen oxides at an elevated site in southern Quebec, Canada, J. Geophys. Res.-A., 108, 4603, doi:10.1029/2002JD003188, 2003.
Henne, S., Dommen, J., Neininger, B., Reimann, S., Staehelin, J., and Prevot, A. S. H.: Influence of mountain venting in the Alps on the ozone chemistry of the lower free troposphere and the European pollution export, J. Geophys. Res.-A., 110, D22307, doi:10.1029/2005JD005936, 2005.
Hudman, R. C., Jacob, D. J., Cooper, O. R., Evans, M. J., Heald, C. L., Park, R. J., Fehsenfeld, F., Flocke, F., Holloway, J., Hubler, G., Kita, K., Koike, M., Kondo, Y., Neuman, A., Nowak, J., Olt-mans, S., Parrish, D., Roberts, J. M., and Ryerson, T.: Ozone production in transpacific Asian pollution plumes and implica-tions for ozone air quality in California, J. Geophys. Res.-A., 109, D23S10, doi:10.1029/2004JD004974, 2004.