HEPATOBILIARY-PANCREAS
Quantification of liver iron content with CT
—added value
of dual-energy
Michael A. Fischer&Caecilia S. Reiner& Dimitri Raptis&Olivio Donati&Robert Goetti& Pierre-Alain Clavien&Hatem Alkadhi
Received: 18 January 2011 / Revised: 1 March 2011 / Accepted: 10 March 2011 / Published online: 7 April 2011 # European Society of Radiology 2011
Abstract
Objective To evaluate the value of dual-energy CT (DECT) with use of an iron-specific, three-material decomposition algorithm for the quantification of liver iron content (LIC). Methods Thirty-one phantoms containing liver tissue, fat and iron were scanned with dual-source CT using single-energy at 120 kV (SECT) and DECT at 80 kV and 140 kV. Virtual iron concentration (VIC) images derived from an iron-specific, three-material decomposition algorithm and measurements of fat-free and fat-containing phantoms were compared with the LIC and healthy liver tissue.
Results In the absence of fat significant linear correlations were found between LIC and HU from SECT and VIC (r= 0.984–0.997, p<0.001) with a detection limit of 145.4 μmol/g LIC for SECT, whereas VIC accurately quantified the lowest LIC of 20 μmol/g dry liver. In the presence of fat, no significant correlation was observed between LIC and SECT, whereas significant correlations were found for VIC. Com-pared with fat-free phantoms, significant underestimation of LIC was seen for SECT with increasing amounts of fat (all, p≤0.01). On the other hand, similar HU were seen for VIC of fat-containing compared with fat-free phantoms (p>0.632). Conclusions Virtual iron concentration images generated from DECT provide added value for the quantification of
LIC by disregarding the confounding effect of the natural variation of healthy liver attenuation and of co-existing liver fat.
Keywords Liver iron content . Fat . Computed tomography . Dual-energy
Introduction
Hepatic iron overload, defined as liver iron content (LIC) above 36 μmol/g, is a frequently occurring disorder in Western countries [1]. Primary and secondary haemochro-matosis represent the most common underlying causes of an elevated LIC leading to toxic accumulation of iron in hepatocytes and the reticulo-endothelial system of the liver. The toxicity of iron is believed to involve increased oxidative stress, with reactive oxygen species causing damage to lipids, proteins and nucleic acids. Hepatic iron overload may rapidly progress to end-stage liver disease, being associated with a high incidence of hepatocellular carcinoma [1]. Evidence has also accumulated indicating that even mildly increased LIC can be damaging, particu-larly when occurring together with other hepatotoxic substances such as alcohol or porphyrogenic drugs, or when co-existing with chronic viral hepatitis [2].
Accurate evaluation of LIC is required to establish the diagnosis of haemochromatosis and to guide chelation treatment in transfusion-dependent anaemia. To date, physiochemical measurement of LIC obtained at liver biopsy is the most reliable method for the diagnosis of hepatic iron overload as well as for disease monitoring. However, liver biopsy is invasive and subject to sampling errors, and physiochemical analyses are expensive and time consuming.
M. A. Fischer
:
C. S. Reiner:
O. Donati:
R. Goetti:
H. Alkadhi (*)Institute of Diagnostic and Interventional Radiology, University Hospital Zurich,
Raemistr. 100,
8091 Zurich, Switzerland e-mail: [email protected] D. Raptis
:
P.-A. ClavienClinic of Visceral and Transplant Surgery, University Hospital Zurich,
In past years, several non-invasive means of the quantification of LIC have been pursued. Of those, magnetic resonance imaging (MRI) using gradient-echo sequences with long echo times as well as recently introduced multi-echo gradient-echo sequences have proven to be promising methods [3, 4]. However, MRI showed limitations including an overestimation of the LIC [5], and an inability to quantify LIC above 300 μmol/g owing to the strong paramagnetic effect of iron resulting in signal loss [6].
In clinical practice, computed tomography (CT) repre-sents the most commonly used technique for the initial imaging evaluation of suspected liver disease. With regard to iron, CT can detect an increase in X-ray absorption that is caused by the greater density of iron compared with normal liver tissue. However, conventional CT has short-comings in the quantification of LIC due to normal variations in CT attenuation. This shortcoming is most evident in patients with only a mild iron overload. Moreover, CT fails to detect and quantify iron in the liver in the case of co-existing fat, which shows an inverse effect on attenuation by lowering the CT numbers [7].
One potential solution to overcome the drawbacks of conventional, single-energy CT (SECT) is the application of two energy spectra, i.e. dual-energy CT (DECT). As a matter of fact, studies using DECT for the quantification of liver iron date back to the 1980s [8, 9]. However, the accuracy of DECT in early times was hampered by limitations of early CT generations preventing their introduction into clinical routine. The major problem of initial DECT was the weak power reserve of the low kV images, which did not allow attainment of the same image noise as the data sets acquired at the two energy levels.
The purpose of this ex vivo study was to evaluate the accuracy of CT in quantifying LIC, and to determine the added value of dual-energy.
Materials and methods Phantoms
To evaluate the range of attenuation of healthy liver, 5 livers of 3-month-old veal were cleaned from blood remnants using a heparin/water (10%) solution (Heparin: 25000 IU/5 ml) and were homogenised mechanically in a commercially available mixer (BRAUN PowerBlend MX 2000, Braun GmbH, Germany). Healthiness of the liver was ensured by taking 10 biopsies (2 from each liver) from various locations which were microscopically screened for diffuse liver disease before further processing. Afterwards 10 ml of each liver was put into 5 test tubes (FALCON®, Becton Dickinson and Co., Franklin Lakes, NJ, USA).
To test for the accuracy of DECT for iron quantification, the liver with the lowest attenuation at 120 kV was used for preparation of another 14 polypropylene test tubes. The tubes were filled with 10 ml of mixtures of healthy liver and iron (Fe (NO3)3) at iron concentrations of 0, 20, 40, 60, 80, 100, 120,
140, 160, 180, 200, and 400, 600, 800μmol/g of dry liver. For conversion of LIC of dry liver reported in the literature to that of wet liver used for phantom preparation, a conversion factor of 1/3.33 was applied, as previously shown [10].
To test for the confounding effect of co-existing fat, another 12 test tubes were prepared containing healthy liver and iron mixtures of iron concentrations at 140, 200 and 600 μmol/g simulating mild, moderate and severe haemo-siderosis [1], and additional fat (goose fat) at concentrations of 0%, 10%, 30% and 50% simulating no, mild, moderate and severe steatosis [7].
All three sets of phantoms were separately placed in a grid and were submerged in a 22×30×40 cm tank filled with distilled water, simulating body attenuation. The phantom position in the grid was noted by one radiologist who was not involved in further CT data analysis.
CT data acquisition
All phantoms underwent imaging using a dual-source 128-slice CT system (SOMATOM Definition Flash, Siemens Healthcare, Forchheim, Germany) equipped with a tin filter for improved separation of the two energy spectra [11].
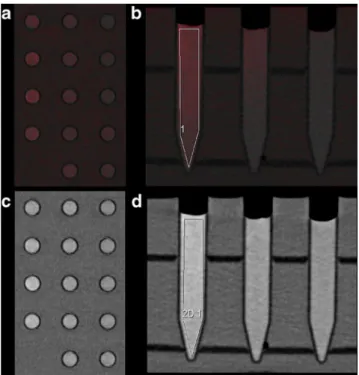
Fig. 1 Virtual iron content (VIC) images derived from dual-energy three-material decomposition of iron and liver tissue (A+B) with corresponding single-energy images (C+D)
First, SECT images were acquired using a tube voltage of 120 kV and a tube current-time product of 210 mAs per rotation (CTDIvol 2.12 mGy). Further imaging parameters were: detector collimation of 64×0.6 mm, slice acquisition of 128×0.6 mm using a flying focus along the z-axis with two different focal spots, gantry rotation time 500 ms, and pitch 0.6.
Then, DECT images were acquired using a tube voltage pair of 140 kV and 80 kV—with tin filtering of the 140 kV
spectrum—and a tube current-time product pair of 150 mAs per rotation and 400 mAs per rotation, respectively, while keeping all other parameters similar to the SECT data acquisition. CTDIvol for this setting was 2.62 mGy. CT image reconstruction
All images were reconstructed by one radiologist who was not involved in CT data analysis. DECT images were reconstructed with a slice thickness of 1.5 mm and an increment of 1 mm using a dedicated dual-energy kernel (D30f), while SECT images were reconstructed with the same slice thickness and increment using a standard medium smooth soft tissue kernel (B30f).
Four sets of data were reconstructed for each phantom: 1) single-energy images acquired at 120 kV (SE120),
2) images acquired at 80 kV (DE80),
3) images acquired at 140 kV (DE140),
4) virtual iron content (VIC) images derived from dual-energy three-material decomposition using DECT data (Fig.1).
Dual-energy three-material decomposition of fat, liver tissue and iron was performed using commercially available post-processing software (“Liver VNC”, syngo Dual Ener-gy, Siemens AG, Forchheim, Germany). Pre-settings of this algorithm are optimised for the decomposition of iodine but can be adjusted for any high atomic number material (such as iron). In order to quantify iron, an iron-specific algorithm was generated as follows:
First, both the liver component and the fat component used for the phantom preparation were calibrated for 80 kV and 140 kV using samples of 100% liver tissue and 100% fat, whereas the“iron-specific” slope of 1.9, derived from relative attenuation differences between 80 kV and 140 kV, was determined using samples containing liver tissue and iron at concentrations of 0μmol/g and 800 μmol/g of dry liver.
Fig. 2 Comparison of CT measurements at 80 kV, 140 kV and 120 kV with virtual iron content (VIC) measurements derived from dual-energy CT for iron quantification in fat-free phantoms. Significant positive linear correlations are seen between liver iron concentration and all CT measurements (r=0.984 to 0.997, p<0.001). Using 66.0 HU as the upper border for healthy liver tissue at 120 kV, the detection limit for single-energy CT was 145.4μmol/g, whereas VIC was able to quantify the lowest titrated iron concentration of 20μmol/g
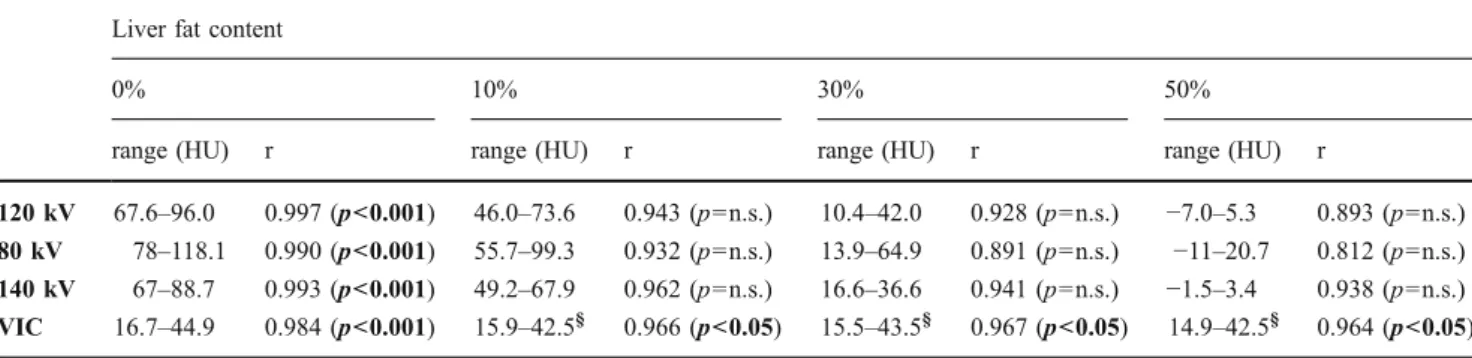
Table 1 CT numbers, correlation coefficients and p values between attenuation and iron concentrations of 140, 200 and 600μmol/g with four different fat contents
Liver fat content
0% 10% 30% 50%
range (HU) r range (HU) r range (HU) r range (HU) r
120 kV 67.6–96.0 0.997 (p<0.001) 46.0–73.6 0.943 (p=n.s.) 10.4–42.0 0.928 (p=n.s.) −7.0–5.3 0.893 (p=n.s.) 80 kV 78–118.1 0.990 (p<0.001) 55.7–99.3 0.932 (p=n.s.) 13.9–64.9 0.891 (p=n.s.) −11–20.7 0.812 (p=n.s.) 140 kV 67–88.7 0.993 (p<0.001) 49.2–67.9 0.962 (p=n.s.) 16.6–36.6 0.941 (p=n.s.) −1.5–3.4 0.938 (p=n.s.) VIC 16.7–44.9 0.984 (p<0.001) 15.9–42.5§ 0.966 (p<0.05) 15.5–43.5§ 0.967 (p<0.05) 14.9–42.5§ 0.964 (p<0.05) HU Hounsfield units, n.s. non-significant, VIC Virtual iron content image reconstructed from dual-energy CT data,§ indicates non-significant differences compared with fat-free phantoms, significant p values are indicated in bold
CT data analysis
Two independent and blinded radiologists (with 3 and 4 years’ experience in radiology, respectively) measured CT numbers (Hounsfield units, HU) on 3-mm-thick reforma-tions of all image sets from all phantoms. Measurements were performed in a random order by placing a polygonal region of interest (ROI) covering the entire long-axis of the phantom, avoiding edges so as to not include partial volume artefacts (Fig.1).
Statistical analysis
Variables are described as mean ± standard deviation or percentages. The data were descriptively analysed and statistically tested for normality using the Kolmogorov-Smirnov test.
Interclass correlation coefficients (ICC) were used to test for the agreement between measurements of both readers.
Correlation between CT measurements and titrated LIC was assessed using Pearson’s correlation analysis. Estimat-ed iron concentrations from SECT and DECT data were determined using the method of least squares. Student’s t-test for related samples was used to t-test for significant differences between LIC measurements of different groups of liver fat content.
Statistical significance was inferred at p values <0.05. Analyses were performed using commercially available software (SPSS, release 17.0, Chicago, IL, USA).
Results
Inter-observer agreement
Inter-observer agreement was excellent in all three phantom sets.
For phantoms containing healthy liver, the ICC was 0.999 for SE120, DE80 and DE140 each. For phantoms
containing different iron concentrations the ICC was 0.998 for SE120, 0.999 for DE80 and DE140 and 0.996 for VIC.
For iron- and fat-containing phantoms, ICC ranged from 0.998 to 0.999 for SE120and from 0.988 to 0.999 for DE80,
DE140and VIC, respectively.
Because inter-observer variability was minimal, the mean of both measurements was taken for further analysis. Iron quantification with CT
Computed tomography numbers of healthy livers ranged from 57.8 to 66.0 HU at 120 kV (Fig.2).
When adding iron to healthy liver, significant positive linear correlations were found between the titrated LIC and
CT numbers of SE120, DE80, DE140and VIC (see Fig.2),
with Pearson correlation coefficients ranging from 0.984 to 0.997 (all, p<0.001). Using 66.0 HU as the upper border for healthy liver tissue at 120 kV, the detection limit for SECT was 145.4 μmol/g of dry liver, whereas absolute scaled VIC measurements accurately quantified the lowest titrated iron concentration of 20 μmol/g dry liver (see Fig. 2).
Iron quantification in the presence of fat
In the presence of fat, no significant correlation was observed between LIC and CT numbers of SE120, DE80
Fig. 3 Liver iron content (LIC) quantification in the presence of 0%, 10%, 30% and 50% liver fat content using single-energy CT (SECT) at 120 kV (a) and virtual iron content images from dual-energy CT (DECT) (b)
and DE140, whereas significant correlations were found for
VIC (Table1).
With increasing amounts of fat, significant underestima-tion of LIC was seen for SE120, DE80 and DE140even at a
low fat concentration of 10% (all, p<0.01). On the other hand, accurate estimation of LIC was seen in VIC images of phantoms with 10% (p=0.948), 30% (p=0.632), and 50% (p = 0.938) fat compared with fat-free phantoms including the same concentrations of iron (Fig. 3, see Table1).
Discussion
Our ex vivo study indicates that—in the absence of fat— both SECT and DECT show a high correlation between attenuation and LIC. However, quantification of small amounts of LIC with SECT is limited by the natural variation of healthy liver attenuation, and SECT fails to quantify the LIC in the presence of fat. Conversely, DECT using an iron-specific, three-tissue decomposition algorithm enables the accurate, absolute LIC quantification irrespec-tive of the confounding effect of normal liver attenuation variation and that of co-existing fat.
In vivo human liver shows a normal variation of attenuation values at unenhanced SECT ranging from 55 to 65 HU [7]. Our ex-vivo experiments are in keeping with these values by showing a range of healthy veal liver tissue from 58 to 66 HU.
The physiological range of healthy liver attenuation, however, results in shortcomings of SECT for quantifica-tion of LIC. SECT fails to discriminate between a normal attenuation within the upper range of healthy liver and an LIC that does not result in an attenuation exceeding the upper threshold of normal liver attenuation. As shown in this study, attenuation measurements from SECT cannot distinguish between healthy liver parenchyma and liver containing smaller amounts of iron up to 145μmol/g.
Dual-energy CT with use of an iron-specific, three-tissue decomposition algorithm enabled the quantification of LIC irrespective of the variations in attenuation of healthy liver parenchyma. Accordingly, DECT allowed for the accurate quantification of the lowest titrated iron concentration used in this study (i.e. 20 μmol/g), which might be clinically relevant considering the hepatotoxic effect of even a low LIC [2]. Moreover, accurate quantification of LIC (μmol/g)
using DECT might aid in the grading and therapy assessment of primary haemochromatosis, since iron deposition in liver or myocardium are important prognostic factors for patient survival [1].
Diffuse liver disease is often associated with fat depositions in addition to an increased iron content. Fat results in a decrease in attenuation of the hepatic
parenchyma confounding the effect of iron. Therefore, SECT shows a lack of sensitivity for iron detection and underestimation of LIC in the presence of fat [7,9]. Our results underline these shortcomings by demonstrating the inability of SECT to quantify LIC even at low fat concentrations of 10%.
Contrary to SECT, DECT using an iron-specific, three-material decomposition algorithm enables the quantification of LIC regardless of the fat content. This was accomplished by reconstructing VIC images that eliminate fat from the data.
The three-material decomposition algorithm used in this study was specifically designed to quantify iron. Similar to iodine, iron shows an energy-dependent change in CT attenuation [9]. X-ray spectral analysis of Fe(NO3)3
revealed a lower slope of CT numbers for iron compared with iodine (1.9 versus 3.2). Use of this algorithm allowed for LIC quantification with a high accuracy even in the presence of fat.
Some study limitations must be acknowledged. First, inherent to an ex vivo study our results might not be generalisable to patients with the same accuracy. Second, the calibration of the dual-energy algorithm proposed in this study was performed on phantoms used for accuracy test procedures, which might lower the general applicability of this method. Finally, we did not investigate the lowest liver iron detection limit of DECT. On the other hand, our lowest titrated LIC of 20 μmol/g is still lower than the threshold of 36μmol/g defining hepatic iron overload [1]. In conclusion, our ex vivo study indicates that DECT provides added value for the quantification of LIC as opposed to SECT by disregarding the confounding effects of the natural variation of healthy liver attenuation and of co-existing liver fat.
References
1. Pietrangelo A (2010) Hereditary hemochromatosis: pathogenesis, diagnosis, and treatment. Gastroenterology 139:393–408. doi:
S0016-5085(10)00872-3, 408 e391-392
2. Bonkovsky HL, Lambrecht RW, Shan Y (2003) Iron as a co-morbid factor in nonhemochromatotic liver disease. Alcohol 30:137–144. doi:S0741832903001277
3. Gandon Y, Olivie D, Guyader D et al (2004) Non-invasive assessment of hepatic iron stores by MRI. Lancet 363:357–362. doi:10.1016/S0140-6736(04)15436-6
4. Bydder M, Shiehmorteza M, Yokoo T et al (2010) Assessment of liver fat quantification in the presence of iron. Magn Reson Imaging 28:767–776. doi:S0730-725X(10)00080-9
5. Castiella A, Alustiza JM, Emparanza JI, Zapata EM, Costero B, Diez MI (2011) Liver iron concentration quantification by MRI: are recommended protocols accurate enough for clinical practice? Eur Radiol 21:137–141. doi:10.1007/s00330-010-1899-z
6. Gandon Y, Guyader D, Heautot JF et al (1994) Hemochromatosis -diagnosis and quantification of liver iron with gradient-echo Mr-Imaging. Radiology 193:533–538
7. Boll DT, Merkle EM (2009) Diffuse liver disease: strategies for hepatic CT and MR imaging. Radiographics 29:1591–U1584. doi:10.1148/Rg.296095513
8. Goldberg HI, Cann CE, Moss AA, Ohto M, Brito A, Federle M (1982) Noninvasive quantitation of liver iron in dogs with hemochromatosis using dual-energy CT scanning. Invest Radiol 17:375–380
9. Raptopoulos V, Karellas A, Bernstein J, Reale FR, Constantinou C, Zawacki JK (1991) Value of dual-energy CT in differentiating
focal fatty infiltration of the liver from low-density masses. Am J Roentgenol 157:721–725
10. Olivieri NF, Saxon BR, NisbetBrown E, Klein NC, Adamkiewicz T, Brittenham GM (1997) Quantitative assessment of tissue iron in patients (pts) with sickle cell disease. Blood 90:1976–1976 11. Karlo C, Lauber A, Gotti RP et al (2011) Dual-energy CT with tin filter
technology for the discrimination of renal lesion proxies containing blood, protein, and contrast-agent. An experimental phantom study. Eur Radiol 21:385–392. doi:10.1007/s00330-010-1926-0