Monomeric and Dimeric Oxidomolybdenum(V and VI) Complexes,
Cytotoxicity, and DNA Interaction Studies: Molybdenum Assisted
C
N Bond Cleavage of Salophen Ligands
Sudarshana Majumder,
†Sagarika Pasayat,
†Alok K. Panda,
‡Subhashree P. Dash,
†,§Satabdi Roy,
†Ashis Biswas,
‡Mokshada E. Varma,
∥Bimba N. Joshi,
∥Eugenio Garribba,
⊥Chahat Kausar,
#Samir Kumar Patra,
#Werner Kaminsky,
¶Aurélien Crochet,
¥and Rupam Dinda*
,††
Department of Chemistry, National Institute of Technology, Rourkela 769008, Odisha, India
‡
School of Basic Sciences, Indian Institute of Technology Bhubaneswar, Bhubaneswar 751013, Odisha, India
§Department of Basic Sciences, Paralamaharaja Engineering College, Sitalapalli, Brahmapur, Odisha 761003, India
∥Bioprospecting Group, Agharkar Research Institute, G.G. Agharkar Road, Pune 411004, India
⊥
Dipartimento di Chimica e Farmacia, Universita
̀ di Sassari, Via Vienna 2, I-07100 Sassari, Italy
#Department of Life Science, National Institute of Technology, Rourkela 769008, Odisha, India
¶
Department of Chemistry, University of Washington, Box 351700, Seattle, Washington 98195, United States
¥Department of Chemistry, Fribourg Center for Nanomaterials, University of Fribourg, CH-1700 Fribourg, Switzerland
*
S Supporting InformationABSTRACT:
Four novel dimeric bis-
μ-imido bridged metal−metal
bonded oxidomolybdenum(V) complexes [Mo
V2O
2L
′
21−4] (1
−4)
(where L
′
1−4are rearranged ligands formed in situ from H
2L
1−4) and
a new mononuclear dioxidomolybdenum(VI) complex [Mo
VIO
2L
5] (5)
synthesized from salen type N
2O
2ligands are reported. This rare series
of imido-bridged complexes (1
−4) have been furnished from
rearranged H
3L
′
1−4ligands, containing an aromatic diimine
(o-phenylenediamine)
“linker”, where Mo assisted hydrolysis followed by
−CN bond cleavage of one of the arms of the ligand H
2L
1−4took
place. A monomeric molybdenum(V) intermediate species [Mo
VO-(HL
′
1−4)(OEt)] (I
d1−4) was generated in situ. The concomitant
deprotonation and dimerization of two molybdenum(V) intermediate species (I
d1−4) ultimately resulted in the formation of a
bis-
μ-imido bridge between the two molybdenum centers of [Mo
V2
O
2L
′
21−4] (1
−4). The mechanism of formation of 1−4 has
been discussed, and one of the rare intermediate monomeric molybdenum(V) species I
d4has been isolated in the solid state and
characterized. The monomeric dioxidomolybdenum(VI) complex [Mo
VIO
2
L
5] (5) was prepared from the ligand H
2L
5where the
aromatic
“linker” was replaced by an aliphatic diimine (1,2-diaminopropane). All the ligands and complexes have been
characterized by elemental analysis, IR, UV
−vis spectroscopy, NMR, ESI-MS, and cyclic voltammetry, and the structural features
of 1, 2, 4, and 5 have been solved by X-ray crystallography. The DNA binding and cleavage activity of 1
−5 have been explored.
The complexes interact with CT-DNA by the groove binding mode, and the binding constants range between 10
3and 10
4M
−1.
Fairly good photoinduced cleavage of pUC19 supercoiled plasmid DNA was exhibited by all the complexes, with 4 showing the
most promising photoinduced DNA cleavage activity of
∼93%. Moreover, in vitro cytotoxic activity of all the complexes was
evaluated by MTT assay, which reveals that the complexes induce cell death in MCF-7 (human breast adenocarcinoma) and
HCT-15 (colon cancer) cell lines.
■
INTRODUCTION
The interesting coordination behavior and structural integrity
of metal
−metal bonded molybdenum(V) complexes make their
chemistry a subject of enthusiastic research.
1,2In the past two
decades, there have been extensive studies on binuclear and
polynuclear molybdenum(V) complexes containing metal
−
metal bonds, where molybdenum is found to be bridged
through oxido,
3sulfido,
4telluro,
5chloride,
6or methoxido
7functionalities and the d-electrons of the Mo
Vcenter are
localized into Mo
V−Mo
Vsingle bonds.
8However, examples of
bis-
μ-imido bridged metal−metal bonded
oxidomolybdenum-(V) complexes are few in the literature
9although
molybdenum-(V) complexes with terminal imide groups
10have been long
known.
http://doc.rero.ch
Published in "Inorganic Chemistry56(18):11190–11210, 2017"
which should be cited to refer to this work.
On the other hand, despite the tremendous success of
platinum anticancer drugs,
11,12there is an acute need for the
development of alternative chemotherapeutic agents in cancer
therapy, due to the severe side effects and resistance
phenomena of the established drugs.
13−16Generally anticancer
agents which damage or block DNA synthesis are approved for
clinical use.
17In this regard, the oxidative nature of metal
complexes of salens have encouraged biochemists to develop
novel DNA/RNA modi
fiers as well as biomolecular
probes.
18−21It has been established that the DNA interaction
and antiproliferative potential of the metallo−salen complexes
depend on the type of the central metal and the position and
nature of the substituents present on the salen moiety.
18,21,22In
addition, the bridging aliphatic or aromatic diimine moiety of
salen type ligands has also been reported to signi
ficantly
in
fluence their cytotoxic efficiencies.
22a,d,23In recent times, the studies on DNA interactions and
antiproliferative activities of molybdenum complexes have
gained substantial interest.
24−34However, structural reports
on oxidomolybdenum complexes with salen type ligands are
few
35−37and their pharmacological properties remain
practi-cally unexplored.
Our research group has been involved in the synthetic,
structural, and biological studies of transition metal complexes
in the recent few years.
38In continuation of our research,
herein we have reported four novel dimeric bis-
μ-imido bridged
metal
−metal bonded oxidomolybdenum(V) complexes
[Mo
2VO
2L
′
21−4] (1
−4) (where L′
1−4are rearranged ligands;
discussed later) and a new monomeric
dioxidomolybdenum-(VI) complex [Mo
VIO
2
L
5] (5) synthesized from salen type
N
2O
2ligands. As the site speci
fic imine reduction of salen type
ligands is quite unusual in the literature
39and it has been
reported that molybdenum assisted reduction of aromatic
imines is more feasible than that of aliphatic imines,
40in this
work an aromatic and an aliphatic diamine were judiciously
chosen for preparing ligands to study their in
fluence on the
control of molecular structure of oxidomolybdenum complexes,
as well as to investigate their impact on DNA interactions and
cytotoxicity studies. It was observed that, during metalation
with MoO
2(acac)
2, the salophen ligands H
2L
1−4containing the
aromatic diimine bridges transformed to new rearranged
ligands H
3L
′
1−4through molybdenum assisted hydrolysis
followed by
−CN bond cleavage of one of the arms of the
salophen ligands. The corresponding molybdenum(V)
inter-mediate [Mo
VO(HL
′
1−4)(OEt)] (I
d1−4) was generated from an
i n i t i a l l y f o r m e d d i o x i d o mo l y b d e n u m ( V I ) s p e c i e s
[Mo
VIO
2
(HL
1−4)(EtOH)(acac)] (I
1−4) during the course of
the reaction (one of the molybdenum(V) intermediate species
I
d4has been isolated and characterized). Finally, the
molybdenum(V) intermediate (I
d1−4) underwent
deprotona-tion and concomitant dimerizadeprotona-tion to form bis-
μ-imido bridged
metal
−metal bonded oxidomolybdenum(V) complexes
[Mo
2VO
2L′
21−4] (1−4). In contrast, the ligand H
2L
5with an
a l i p h a t i c i m i n e c o m p o n e n t p r o d u c e d a s i m p l e
dioxidomolybdenum(VI) complex [Mo
VIO
2L
5] (5) where no
such ligand rearrangement took place. The key role of
molybdenum in the ligand transformation can be elucidated
by taking into account the reports of several other transition
metal complexes
41using similar ligands, where no such
−CN
bond cleavage takes place.
All the ligands and complexes have been characterized by
various physicochemical techniques, and the structural features
of 1, 2, 4, and 5 have been solved by X-ray crystallography. It is
relevant to mention that, to the best of our knowledge, this is
the
first report of some bis-μ-imido bridged dimeric
oxidomolybdenum(V) complexes [Mo
2VO
2L
′
21−4] (1
−4)
synthesized from partially reduced salophen ligands, which
have been structurally characterized. 1
−5 were tested for their
potential of exhibiting DNA binding and cleavage activity, and
their in vitro antiproliferative activity was assayed against the
MCF-7 and HCT-15 cell lines.
■
EXPERIMENTAL SECTION
Materials and Methods. All chemicals were procured commer-cially and used as received. [MoO2(acac)2] was synthesized according
to a reported procedure.42A Vario EL cube CHNS elemental analyzer was used for elemental analysis measurement. A PerkinElmer Spectrum RX I spectrophotometer was employed for recording IR spectra. A Bruker Ultrashield 400 MHz spectrometer was used for measuring 1H and 13C NMR spectra where SiMe
4 was used as the
internal standard. A PerkinElmer Lambda 25 spectrophotometer was employed to measure the electronic spectra. A Sherwood Scientific AUTOMSB sample magnetometer was used for measuring magnetic susceptibility. Conductivity was measured with a Eutech CON 700 conductivity meter. ESI-MS were recorded on a SQ-300 MS instrument operating in ESI mode. Electrochemical data were recorded using a CH-Instruments (model no. CHI6003E) electro-chemical analyzer. The cyclic voltammetry experiments were performed using Pt working and auxiliary electrodes, SCE as reference electrode, and TBAP as supporting electrolyte. TBAP (tetrabutylam-monium perchlorate) was purchased from commercial sources, dried properly, and used as a supporting electrolyte for cyclic voltammetry experiments. EPR spectra were recorded from 0 to 8000 G at 298 K (room temperature) with an X-band (9.4 GHz) Bruker EMX spectrometer equipped with an HP 53150A microwave frequency counter; the microwave frequency used was in the range 9.40−9.41 GHz. The supercoiled (SC) pUC19 DNA from Escherichia coli DH5α cells was purified by using a GeneJET Plasmid Isolation Kit (Thermo Scientific, USA). Calf thymus (CT) DNA (biochemistry grade) was procured from SRL (India). Agarose (molecular biology grade) was procured from Sigma-Aldrich (USA). MCF-7 (human breast adenocarcinoma cell line), HCT-15 (colon cancer cell line), and HaCaT (immortalized human keratinocytes) were purchased from NCCS, Pune. Penicillin, streptomycin, DMEM, and fetal bovine serum were procured from Invitrogen, and MTT was procured from Spectrochem. Propidium iodide was purchased from Sigma-Aldrich (USA). Caution! Although no difficulties were encountered during the course of this work, attention is drawn to the potentially hazardous nature of perchlorates.
Synthesis of Ligands H2L1−5. The salophen ligands H2L1−4were
prepared in a fair yield by the condensation of o-phenylenediamine with the corresponding aldehydes (salicylaldehyde (H2L1), o-vanillin
(H2L2), 5-bromosalicylaldehyde (H2L3), and
2-hydroxy-1-naphthalde-hyde (H2L4)) in a 1:2 ratio in ethanol by a adapting a reported
procedure.43The resulting dark orange compounds werefiltered and then washed with ethanol andfinally dried over fused CaCl2. H2L5was
synthesized by condensing 1,2-diaminopropane with o-vanillin as reported in the literature.44 Elemental analysis results and NMR (1H
and13C) and IR data for all of these confirmed their preparation. The 1H NMR data of H
2L1−5have been included inTable S1.
H2L1. Yield: 65%. Anal. Calcd for C20H16N2O2: C, 75.93; H, 5.10;
N, 8.86. Found: C, 75.92; H, 5.17; N, 8.81. IR (KBr pellet, cm−1): 3320ν(O−H), 1623 ν(CN).13C NMR (100 MHz, DMSO-d
6):δ
(ppm) = 164.51, 160.84, 142.72, 133.91, 132.91, 128.28, 120.21, 119.94, 119.55, 117.13.
H2L2. Yield: 67%. Anal. Calcd for C22H20N2O4: C, 70.20; H, 5.36;
N, 7.44. Found: C, 70.23; H, 5.34; N, 7.41. IR (KBr pellet, cm−1): 3484ν(O−H), 1611 ν(CN).13C NMR (100 MHz, DMSO-d 6):δ (ppm) = 161.33, 157.54, 151.59, 146.37, 129.37, 127.65, 122.48, 121.67, 120.86, 118.19, 79.57.
http://doc.rero.ch
H2L3. Yield: 62%. Anal. Calcd for C20H14Br2N2O2: C, 50.66; H,
2.98; N, 5.91. Found: C, 50.62; H, 2.95; N, 5.90. IR (KBr pellet, cm−1): 3480ν(O−H), 1611 ν(CN).13C NMR (100 MHz,
DMSO-d6):δ (ppm) = 162.67, 159.92, 142.45, 136.15, 134.23, 128.64, 121.88,
120.11, 119.63, 110.36.
H2L4. Yield: 68%. Anal. Calcd for C28H20N2O2: C, 80.75; H, 4.84;
N, 6.73. Found: C, 80.71; H, 4.82; N, 6.70. IR (KBr pellet, cm−1): 3488ν(O−H), 1619 ν(CN).13C NMR (100 MHz, DMSO-d
6):δ
(ppm) = 169.06, 157.82, 138.93, 137.27, 133.46, 129.46, 128.66, 127.89, 127.34, 124.11, 121.95, 121.06, 120.17, 109.70.
H2L5. Yield: 64%. Anal. Calcd for C19H22N2O4: C, 66.65; H, 6.48;
N, 8.18. Found: C, 66.63; H, 6.45; N, 8.12. IR (KBr pellet, cm−1): 3692ν(O−H), 1627 ν(CN).13C NMR (100 MHz, DMSO-d6):δ
(ppm) = 167.54, 165.68, 152.01, 151.66, 148.43, 148.37, 123.62, 123.56, 118.70, 118.61, 118.33, 118.20, 115.17, 115.04, 64.44, 63.84, 56.14, 56.02, 20.33.
Synthesis of Complexes [Mo2VO2L′21−4] (1−4). [MoO2(acac)2]
(1 mmol) was added to a refluxing solution of the appropriate ligand H2L1−4(1 mmol) in 20 mL of ethanol; the color initially changed to
pale blue and then to dark red. The change of color from pale blue to red was very fast for 1−3, while for 4 the color remained blue until 15 min. The reflux was continued for 3 h and filtered. A dark red residue was obtained. Red crystals of 1, 2, and 4 were obtained by recrystallizing the residue in DMSO. The X-ray quality crystals obtained were filtered and washed with ethanol. Due to the poor quality of the crystals of 3, its X-ray structure could not be solved. Elemental analysis results and IR, NMR (1H,13C), UV−vis, and
ESI-MS data for all of the complexes verified their preparation. The 1H
NMR data of [Mo2VO2L′21−4] (1−4) and [MoVIO2L5] (5) have been
included inTable S1.
[Mo2VO2L′21] (1). Yield: 34%. Anal. Calcd for C26H18Mo2N4O4: C,
48.62; H, 2.82; N, 8.72. Found: C, 48.60; H, 2.81; N, 8.73. Main IR peaks (KBr pellet, cm−1): 1601ν(CN), 951, 855 ν(MoO). UV− vis (DMSO):λmax, nm (ε, dm3mol−1cm−1): 465 (2824), 368 (6422),
320 (13313), 290 (18595). 13C NMR (100 MHz, DMSO-d 6): δ
(ppm) = 177.30, 172.51, 161.61, 147.74, 142.03, 137.44, 136.87, 133.79, 122.48, 121.97, 116.76, 112.23, 111.97. ESI-MS: m/z 642.15 [M]+.
[Mo2VO2L′22] (2). Yield: 32%. Anal. Calcd for C28H22Mo2N4O6: C,
47.88; H, 3.16; N, 7.98. Found: C, 47.84; H, 3.12; N, 7.94. IR (KBr pellet, cm−1): 1598 ν(CN), 946, 912 ν(MoO). UV−vis (DMSO): λmax, nm (ε, dm3 mol−1 cm−1): 483 (11914), 395
(20699), 328 (46037), 275 (52678).13C NMR (100 MHz,
DMSO-d6):δ (ppm) = 155.28, 153.70, 151.87, 148.94, 134.32, 129.02, 126.17,
122.34, 118.89, 118.21, 116.53, 115.70, 115.57, 55.74. ESI-MS: m/z 702.16 [M]+.
[Mo2VO2L′23] (3). Yield: 35%. Anal. Calcd for C26H16Br2Mo2N4O4:
C, 39.03; H, 2.02; N, 7.00. Found: C, 39.01; H, 2.00; N, 7.02. IR (KBr pellet, cm−1): 1597 ν(CN), 911, 883 ν(MoO). UV−vis (DMSO):λmax, nm (ε, dm3mol−1cm−1): 484 (9759), 383 (17993),
276 (57553).13C NMR (100 MHz, DMSO-d6):δ (ppm) = 162.90,
154.61, 152.45, 137.33, 136.86, 134.63, 129.94, 124.63, 121.76, 119.02, 116.30, 116.22, 110.88. ESI-MS: m/z 800.64 [(M− H)+].
[Mo2VO2L′24] (4). Yield: 26%. Anal. Calcd for C34H22Mo2N4O4: C,
55.00; H, 2.99; N, 7.55. Found: C, 55.02; H, 2.94; N, 7.52. IR (KBr pellet, cm−1): 1565 ν(CN), 937, 912 ν(MoO). UV−vis (DMSO): λmax, nm (ε, dm3 mol−1 cm−1): 486 (15710), 397
(17833), 349 (30945), 279 (55015).13C NMR (100 MHz,
DMSO-d6):δ (ppm) = 193.30, 169.13, 157.79, 138.91, 138.86, 137.30, 133.46,
129.47, 129.30, 128.66, 127.89, 127.32, 124.72, 124.11, 121.98, 121.07, 109.68. ESI-MS: m/z 742.28 [M]+.
Synthesis of the Intermediate Species [MoVO(HL′4)(OEt)]
(Id4). [MoO2(acac)2] (1 mmol) was added to a refluxing solution of
H2L4(1 mmol) in ethanol. The solution turned pale blue, the reaction
was stopped after 15 min when the solution was still blue, and the mixture was filtered. Blue residue of Id4 was obtained. Elemental
analysis results and IR, UV−vis, EPR, ESI-MS, and cyclic voltammetry data for the complex verified its preparation. The corresponding intermediates [MoVO(HL′1−3)(OEt)] (I
d1−3) could not be isolated
because of their very fast conversion into the dimeric species [Mo2VO2L′21−3] (1−3).
In an alternative strategy, when [MoO2(acac)2] (1 mmol) was
added to a refluxing solution of H2L4 (1 mmol) in ethanol in the
presence of few drops of water, the solution remained blue for 30 min and blue crystalline residue of Id4was now obtained in a higher yield.
[MoVO(HL′4
)(OEt)] (Id4). Yield: 15%. Anal. Calcd for
C19H17MoN2O3: C, 54.69; H, 4.11; N, 6.71. Found: C, 54.64; H,
Table 1. Crystal Data and Refinement Data of Complexes 1, 2, 4, and 5
1 2 4 5
formula C26H18Mo2N4O4 C28H22Mo2N4O6 C34H22Mo2N4O4 C19H20MoN2O6
M 642.32 702.38 742.44 468.31
cryst sym triclinic triclinic monoclinic triclinic
space group P1̅ P1̅ P21/n P1̅ a (Å) 8.5389(13) 9.4562(5) 8.9152(3) 11.9576(11) b (Å) 10.4521(14) 9.6471(5) 17.7572(6) 12.8243(13) c (Å) 13.565(2) 14.4626(7) 17.7893(6) 13.8984(14) α (deg) 88.732(9) 79.619(2) 90 76.348(8) β (deg) 80.213(9) 79.536(3) 104.473(3) 77.430(8) γ (deg) 70.999(9) 88.060(2) 90 78.140(8) V (Å3) 1127.3(3) 1276.17(11) 2726.84(16) 1994.6 (3) Z 2 2 4 4 Dcalc(g cm−3) 1.892 1.828 1.808 1.556 μ(Mo Kα) (mm−1) 1.156 1.036 7.948 0.695 F(000) 636 700 1480 952 max/min transm 0.988/0.893 0.9597/0.9125 0.933/0.793 0.933/0.793 θ (max) (deg) 26.77 28.36 73.97 25.00 temp (K) 110 100 100 200 reflns collected 10634 54801 8414 9605 Ra[I > 2σ(I)] 0.0538 0.0250 0.0487 0.0513 Rwb[all data] 0.1103 0.0629 0.1336 0.1035 S [goodness offit] 0.974 1.062 1.040 0.826 max/min res (e Å−3) 0.914/−0.895 0.658/−0.670 1.549/−0.662 0.483/−0.692 a = ∑ || | − | || ∑ | | R Fo( )F Fc o . bR = ∑[ (w F −F ) ]/ [ ( ) ]∑ w F w o2 c2 2 o2 2 .
http://doc.rero.ch
4.10; N, 6.73. IR (KBr pellet, cm−1): 3062ν(−NH), 1568 ν(−CN), 949 ν(MoO). UV−vis (DMSO): λmax, nm (ε, dm3 mol−1cm−1):
607 (4692), 562 (2917), 519 (1466), 323 (14222), 274(46436). ESI MS: m/z 421.64 [(M + 2H)+].
Synthesis of [MoVIO
2L5] (5). [MoO2(acac)2] (1 mmol) was added
to a refluxing solution of H2L5 (1 mmol) in 20 mL of ethanol; the
color changed to orange. The solution was refluxed for 3 h. Dark orange crystalline residue of 5 was obtained onfiltering the solution. Some of the crystals were of good quality and were used directly for X-ray analysis. Elemental analysis results and IR, NMR (1H,13C), UV−
vis, and ESI-MS data for the complex verified its preparation. [MoVIO2L5] (5). Yield: 42%. Anal. Calcd for C19H20MoN2O6: C,
48.73; H, 4.30; N, 5.98. Found: C, 48.71; H, 4.29; N, 5.94. IR (KBr pellet, cm−1): 1607 ν(CN), 907, 874 ν(MoO). UV−vis (DMSO):λmax, nm (ε, dm3 mol−1 cm−1): 438 (1871), 323 (7254),
278 (12155).13C NMR (100 MHz, DMSO-d 6):δ (ppm) = 164.21, 159.45, 150.85, 150.71, 149.61, 148.93, 132.08, 129.14, 126.65, 126.29, 124.98, 124.47, 123.62, 123.55, 122.39, 121.74, 121.67, 121.60, 121.29, 118.72, 118.64, 118.34, 118.20, 117.68, 117.24, 116.91, 116.78, 116.54, 115.18, 115.05, 67.85, 64.51, 63.90, 62.64, 38.51, 30.24, 28.82, 22.87. ESI-MS: m/z 468.12 [M]+.
Crystallography. Clear inclusion free single crystals of 1, 2, 4, and 5suitable for X-ray diffraction studies were mounted on loops with oil. Crystallographic data and details of refinement are collected inTable 1. The compounds 1, 2, and 5 crystallize in the triclinic space group P1̅, and 4 crystallizes in monoclinic space group P21/n. The unit cell
parameters and the intensity data were recorded for complexes 1 and 2 on a Bruker APEX II employing graphite monochromated Mo Kα radiation (λ = 0.71073 Å) at ∼110 K and ∼100 K respectively. The data for complex 4 were collected on SuperNova AS2 Data Collections using high intensity of SuperNova microfocus Cu Kα source (λ = 1.54184 Å) and a highly sensitive Atlas CCD detector at ∼100 K. Single crystals of complex 5 were mounted on a Stoe IPDS 2 diffractometer equipped with an Oxford Cryosystem open flow cryostat employing a graphite monochromated Mo Kα radiation (λ = 0.71073 Å) at∼200 K. The intensity data were corrected for Lorentz, polarization, and absorption effects. The data was integrated and scaled using SAINT, SADABS within the APEX2 software package by Bruker.45a The structures were solved using the SHELXS9745b and refined using SHELXL9746
computer programs. Hydrogen atoms were set in geometrically idealized positions and constrained to ride on their parent atoms with C−H distances in the range 0.95−1.00 Å. Isotropic thermal parameters Ueq were defined such that they were 1.2Ueq of
their parent atom Ueqfor CH’s and 1.5Ueqof their parent atom Ueqin
the case of methyl groups. All the non-hydrogen atoms were refined anisotropically by full-matrix least-squares.
DNA Binding Experiments. Using Absorption Spectroscopy. The binding of the dimeric oxidomolybdenum(V) and monomeric dioxidomolybdenum(VI) complexes to calf thymus DNA (CT-DNA) was examined as previously described.38c−g Briefly, the UV−vis titration experiments were carried out with variable CT-DNA concentrations (0−50 μM) against a fixed concentration of molybdenum complex (25 μM) in 10 mM Tris−HCl buffer (pH 8.0) containing 1% DMF using a Lambda 35 PerkinElmer (USA) spectrophotometer. The binding of ligands to CT-DNA was also studied. To do this the concentration of ligand wasfixed at 25 μM and was titrated with variable DNA concentration (0−250 μM) in 10 mM Tris−HCl buffer (pH 8.0) containing 1% DMF. The data obtained from the titration experiments were thenfit to the following equation to obtain binding constant Kb:
38c−g
ε −ε = ε −ε + K ε −ε
[DNA] [DNA] 1
( )
a f b f b b f (1)
where [DNA] is the concentration of DNA base pairs,εa,εf, andεb
correspond to apparent extinction coefficients for the complex, i.e., Abs/[complex] in the presence of DNA, in the absence of DNA, and fully bound DNA, respectively. A plot of [DNA]/(εa− εf) vs [DNA]
resulted in a slope and intercept equal to 1/(εb− εf) and 1/Kb(εb−
εf), respectively; Kb is determined from the ratio of the slope to the
intercept.
Using Thermal Denaturation Technique. Thermal denaturation studies of CT-DNA (100 μM) in the absence and presence of molybdenum complexes (25μM) were carried out by monitoring the absorbance at 260 nm in the temperature range of 30−90 °C in 10 mM Tris−HCl buffer (pH 8.0) containing 1% DMF. The ramp rate for each of the experiments was 0.5°C/min. All the experiments were carried out in absorbance mode using a Chirascan CD spectropo-larimeter (Applied Photophysics, U.K.) equipped with a Peltier temperature controller. The melting temperature (Tm) was
determined from the derivative plot (dA260/dT vs T) of the melting
profile.47a
Using Circular Dichroism Spectroscopy. Circular dichroism (CD) spectroscopy was studied using a Chirascan CD spectropolarimeter (Applied Photophysics, U.K.) at 25°C. CD spectra of CT-DNA (100 μM) in the absence and presence of molybdenum complexes (25 μM) were obtained in the wavelength range of 240−400 nm in 10 mM Tris−HCl buffer (pH 8.0) containing 1% DMF using quartz cell with 10 mm path length.38c−g
Fluorescence Experiments. The fluorescence spectra of the complexes 1−5 (100 μM) as well as ligands (100 μM) in 10 mM Tris−HCl buffer (pH 8.0) containing 1% DMF at 25 °C were recorded using a spectrofluorimeter using Fluoromax 4P (Horiba Jobin Mayer, USA).
DNA Cleavage Experiments. For all experiments, 300 ng of supercoiled (SC) pUC19 DNA was used, in the presence of 50 mM Tris−HCl buffer (pH 8.0) containing 1% DMF.
Chemically Induced DNA Cleavage. For chemical nuclease studies, the cleavage experiments were executed in the dark employing hydrogen peroxide (0.5 mM) as the oxidizing agent in the absence and presence of the molybdenum complexes (1−100 μM). The incubation temperature wasfixed at 37 °C for 3 h and analyzed for DNA cleaved products by agarose gel electrophoresis.
Photoinduced DNA Cleavage. The photoinduced DNA cleavage studies were carried out according to literature procedures.38c−g Briefly, the photolytic DNA cleavage experiments were performed on supercoiled (SC) pUC19 DNA (300 ng) with 1−5 (1−100 μM) in 50 mM Tris HCl buffer (pH 8.0) containing 1% DMF. The extent of DNA cleavage was calculated from the intensities of the bands using the UVP Gel Documentation System (Gel Doc It2). The error observed in determining the band intensities was between 3−6%. Four different additives (two singlet oxygen quenchers (sodium azide andL -histidine) and two hydroxyl radical quenchers (KI andD-mannitol))
were used to discern the mechanistic aspect behind the DNA cleavage. These additives were added to the reaction mixture before the addition of the complex. The concentration of each of the additives was 0.5 mM.
Cytotoxicity Studies. MTT Assay. MCF-7 cells were cultured in DMEM having 10% FBS and penicillin (100 U/mL) and streptomycin (100μg/mL) in a humidified 5% CO2incubator at a temperature of
37°C. HCT 15 cells were cultured in RPMI 1640 containing 10% FBS and penicillin (100 U/mL) and streptomycin (100 μg/mL) in a humidified 5% CO2incubator at 37°C. HaCaT cells were cultured in
DMEM having 10% FBS and penicillin (100 U/mL) and streptomycin (100μg/mL) in a humidified 5% CO2incubator at a temperature of
37°C. The cytotoxicity was assayed by determining the viability of MCF-7, HCT-15, and HaCaT cells after treatment by 1−5 through MTT assay. Briefly, the cells (105cells/well) were seeded in 96-well
plates in DMEM containing 10% FBS. After cells reached confluency, treatment was given with varying concentrations (5μM, 10 μM, 25 μM, and 50 μM) of the molybdenum complexes. The complexes were dissolved in DMSO, and working solutions were prepared by diluting the stock of a 5 mM concentration of each compound with plain DMEM. Final working concentration of DMSO in assay was less than 2%. Untreated cells were taken as 100% survival. After the treatment, medium was removed and cells were incubated with MTT (5 mg/mL) for 4 h. The crystals formed were dissolved in DMSO, and absorbance was read at 570 nm. IC50 was calculated for each compound by
treating the cells for 48 h.
Propidium Iodide Staining. Propidium iodide (or PI) is an intercalating agent which has thefluorescence excitation maximum is 535 nm, and the emission maximum is 617 nm.47bPI staining was carried out to visualize the morphology of the nuclei after the treatment with 1−5. The MCF-7 (human breast cancer cells), HCT-15 (colon cancer cells), and HaCaT (immortalized human keratinocytes) cells were grown in the 96-well plate. After reaching approximately 90% confluency, the cells were treated with varying concentrations (5, 10, 25, 50μM) of 1−5 and were incubated for 48 h. Cells were observed under an invertedfluorescence microscope after treatment to check for morphological changes, during cell death. Then the cells were washed twice with PBS (pH 7.4) and fixed after incubation for 15 min with 3.7% of formaldehyde. The cells were further washed twice with PBS and treated with 0.2% Triton X-100 in PBS for 30 s. Again, the washing was repeated with PBS and PI solution (10μg/mL) was added, and the sample was kept in the dark for 15 min. At the end, the cells were further washed with PBS and imaged under a fluorescence microscope (FLoid, Life Technologies and Olympus IX 70).
■
RESULTS AND DISCUSSION
Synthesis.
Scheme 1
portrays the synthesis of four dimeric
oxidomolybdenum(V) complexes [Mo
2VO
2L
′
21−4] (1
−4),
where L
′
1−4indicates the rearranged form of the ligands
H
2L
1−4, and a monomeric dioxidomolybdenum(VI) complex
(5), via two di
fferent reaction pathways (path a and path b),
from salen type ligands (H
2L
1−5).
When the ligands were subjected to re
flux in the presence of
MoO
2(acac)
2, H
2L
1−4(which contained the aromatic diimine)
followed the reaction path a (
Scheme 1
) which involved a
Mo(V) intermediate, [Mo
VO(HL
′
1−4)(OEt)] (I
d1−4
), and
finally dimeric bis-μ-imido bridged oxidomolybdenum(V)
complexes [Mo
2VO
2L
′
21−4] (1
−4) were formed, containing
rearranged ligands H
3L
′
1−4furnished by Mo assisted hydrolysis
and
−CN bond cleavage (
Scheme 2
). One of the
intermediates, I
d4, has been isolated in the solid state and
characterized by UV−vis, IR, EPR, ESI-MS, and cyclic
voltammetry.
The detailed mechanism of the formation of [Mo
2VO
2L
′
21−4]
(1
−4) is shown in
Scheme 3
, taking H
2L
2as a representative
among the four ligands, which illustrates that at
first a
dioxidomolybdenum(VI) species [Mo
VIO
2(HL
2)(acac)-(EtOH)] (I
2) is formed, and then a molybdenum assisted
hydrolysis of one of the coordinated
−CN bonds of the
salophen ligand leads to the formation of I
b2,via the formation
of I
a2and release of Hacac.
47c
The pendant phenolic OH then
coordinates to the metal center, and removal of the aldehyde
(o-vanillin) as an acid (o-vanillic acid)
47dtakes place in lieu of
the reduction of Mo(VI) species (I
b2) to Mo(IV) species (I
c2).
The Mo(IV) species, I
c2, then undergoes a fast
comproportio-nation
47ereaction with a Mo(VI) species present in the
reaction medium to form a Mo(V) intermediate I
d2. Finally
deprotonation and dimerization of I
d2occurs with the loss of
ethanol, and
μ-imido bridges between two molybdenum
fractions are furnished to yield [Mo
2VO
2L
′
22] (2).
In the above reaction, water plays a signi
ficant role. In fact,
when the same reaction is carried out in the presence of few
drops of water, it has been found that the yield of 2 increases
Scheme 1. Synthesis of Dimeric Oxidomolybdenum(V) Complexes [Mo
2VO
2L′
21−4] (1−4) and Monomeric
Dioxidomolybdenum(VI) Complex [Mo
VIO
2L
5] (5)
Scheme 2. Schematic Pathway for the Formation of [Mo
2VO
2L
′
21−4] (1
−4) via the Intermediate [Mo
VO(HL
′
1−4)(OEt)] (I
d1−4)
signi
ficantly. There are reports of vanadium complexes of
similar ligands where such hydrolysis and
−CN bon cleavage
of salophens did not take place in the presence of VO(acac)
2(
Scheme 3
).
41a,bIt has also been found in the literature that, in
the presence of several other transition metals (Ti,
41cCr,
41dMn,
41eFe,
41fCo,
41gNi,
41hCu,
41iZn,
41jW,
35cOs,
41kand Pt
41l),
−CN bond cleavage of salophens does not take place, which
proves that the hydrolysis and
−CN bond cleavage of
salophens in complex 1
−4 is molybdenum assisted. X-ray
crystallography (discussed later) revealed the presence of a
localized metal
−metal single bond between the two
molybdenum(V) centers of all the oxidomolybdenum(V)
complexes [Mo
2VO
2L
′
21−4] (1
−4). The formation of the
monomeric dioxidomolybdenum(VI) complex [Mo
VIO
2L
5]
(5) took place via path b (
Scheme 1
), where no such
hydrolysis and
−CN bond cleavage of H
2L
5occurred in the
presence of MoO
2(acac)
2owing to the fact that, during the
−CN bond cleavage, the corresponding intermediate,
[Mo
VIO
2
(HL
5)(EtOH)(acac)(H
2O)] (I
a5), would not get any
resonance stabilization due to the absence of aromatic
backbone in the ligand environment, which is available in the
case of I
a1−4. 1−5 were completely soluble in DMF and DMSO
and partly soluble in CH
3CN, CH
2Cl
2, and H
2O. The
complexes were stable in both solution and solid phases. The
solution phase stability of the complexes for the biological
assays was con
firmed by electronic absorption and NMR
studies (
Figure S1A
−C
). From the magnetic susceptibility and
molar conductivity data, it could be concluded that all the
Scheme 3. Proposed Mechanistic Pathway of Formation of Dimeric Oxidomolybdenum(V) Complex [Mo
2VO
2L′
22] (2) and the
Corresponding Oxidovanadium(IV) Complex, [V
IVOL
2]
41a,bcomplexes (1−5) are diamagnetic and electrically
nonconduct-ing in solution. The oxidomolybdenum(V) complexes (1
−4)
are silent in electron paramagnetic resonance (EPR)
spectros-copy, which may be attributed to the antiferromagnetic
coupling
48aof electron spins of the two 4d
1Mo(V) ions and
the formation of an Mo
−Mo bond.
1,3i,48b,cIR Spectroscopy. Selected IR data of all the ligands
(H
2L
1−5) and the complexes 1
−5 are given in the
Experimental
Section
. The ligands showed a minimum intensity IR band in
the range of 3320
−3692 cm
−1due to
ν(OH) stretching.
43Distinct bands within the range of 1611
−1627 cm
−1due to
ν(CN) of azomethine groups of the salen type ligands
32,43(H
2L
1−5) were noticed. In the complexes (1
−5), the ν(CN)
stretching was shifted to lower frequencies (1565
−1607 cm
−1),
which might be attributable to the lower C
N bond order due
to the coordination to the metal atom.
33In addition, the
complexes 1
−5 display a pair of sharp strong peaks in the range
855
−951 cm
−1due to
ν(MO) stretch.
49a−cThe intermediate
[Mo
VO(HL
′
4)(OEt)] (I
d4), which has been isolated, showed a
strong oxido peak at 949 cm
−1due to a single
ν(MO)
stretch.
49a−cAbsorption at 3062 cm
−1is observed which can be
attributed to the
ν(NH) stretching;
38dthe peak at 1568 cm
−1is
due to the
−CN stretching
38aof the imine bond of the
salophen ligand. Representative spectra of complex 4 and its
corresponding intermediate I
d4are given in
Figure S2
.
UV
−Vis Spectroscopy. The electronic absorption spectra
of the complexes 1
−5 and I
d4were recorded in DMSO. The
spectral data are summarized in the
Experimental Section
. The
spectra of 1
−5 display a shoulder in the 438−486 and two
strong absorptions in the 275−397 nm range which are
assignable to LMCT and intraligand transitions,
respective-ly.
49a−cThe absorption spectrum of [Mo
VO(HL
′
4)(OEt)] (I
d4
)
exhibits peaks at 607, 562, 519, 323, and 274 nm. The band at
323 and 274 nm is attributed to the intraligand charge transfer
band; the bands at 562 and 519 nm are assigned as LMCT
bands.
49a−cThe low energy transition band at 607 nm is
located in the d
−d transition region as evidenced from previous
reports of oxidomolybdenum complexes.
49c−eHowever, the
unusually high intensity of this band (
ε
max, 4692 dm
3mol
−1cm
−1), which is too high for a pure d
−d transition,
38aand
analogy with other molybdenum(V) complexes
49fsuggest that
this transition may be due to the presence of a mixture of
LMCT and d
−d transitions. The representative spectra of
complex 4 and I
d4are given in
Figure S3
.
NMR Spectroscopy.
1H and
13C NMR of all the
compounds were recorded in DMSO-d
6. The
1H NMR data
are collected in
Table S1
, and the
13C NMR data are given in
the
Experimental Section
. The coordinating modes of H
2L
1−5were confirmed by comparing their
1H NMR spectral patterns
with those of the corresponding complexes. The representative
Figure 1.ESI-MS spectrum of [MoVO(HL′4)(OEt)] (I d4).
1
H NMR spectra of H
2
L
2, [Mo
2VO
2L
′
22] (2), and
[Mo
2VO
2L
′
23] (3) are given in
Figures S4a, S4b, and S5
,
respectively. The
1H NMR spectrum of the free ligands exhibits
resonance in the range
δ = 12.96−15.13 ppm due to phenolic
OH and at
δ = 8.52−9.68 ppm due to the azomethine −CH
protons, respectively.
50aThe signals for the aromatic protons
from ligands are observed in the expected region
δ = 6.75−8.54
ppm. Singlets for the
−OCH
3protons of H
2L
2and H
2L
5are
observed at around 3.74 ppm. The aliphatic protons of H
2L
5appear as two doublets at 3.73 and 1.31 ppm for
−CH
2and
−CH
3respectively, and a multiplet is observed at 3.77 ppm for
−CH proton.
50In the NMR spectra of complexes, the peak for
the aromatic
−OH proton was not observed due to the
deprotonation of phenolic group. The NMR spectrum of
complex 5 exhibits double the number of protons due to the
presence of two entities in one unit.
In the
13C NMR spectra of the ligands H
2
L
1−5, spectral
signals for the aromatic carbons are found in the range of
δ =
109.70
−169.06 ppm.
50bThe signals for the aliphatic carbons of
H
2L
5are found in the range
δ = 20.33−64.44 ppm, and the
signal for
−OCH
3carbon of H
2L
2appears at 79.57 ppm, while
in the
13C NMR spectra of complexes 1
−5, signals for the
aromatic carbons are found in the down
field region in the range
δ = 109.68−193.30 ppm.
50The signals for
−OCH
3carbon and
aliphatic carbons of the complexes 2 and 5 appear in the range
δ = 22.87−67.85 ppm.
Figure S6
shows the
13C NMR spectrum
of 3.
ESI-MS. ESI-MS spectra of 1
−5 and I
d4have been recorded
in DMSO. The characteristic molecular ion peaks for 1
−5
appear at 642.15 [M]
+, 702.16 [M]
+, 800.64 [(M
− H)
+],
742.28 [M]
+, and 468.12 [M]
+, respectively, while the
molecular ion peak for I
d4appears at 421.64 [(M + 2H)
+].
The representative ESI-MS spectra of I
d4and 3 are given in
Figure 1
and
Figure S7
, respectively.
EPR Spectroscopy of the Intermediate Monomeric
Mo(V) Compound [Mo
VO(HL
′
4)(OEt)] (I
d4
). EPR spectra
were recorded at room temperature (298 K) as a function of
the time on I
d4(
Schemes 2
and
3
), dissolved in a degassed
DMSO solution. These are shown in
Figure 2
. The spectra
consist of a strong central signal due to the coupling between
an unpaired electron with the nonmagnetic nuclei
92Mo,
94Mo,
96Mo,
98Mo, and
100Mo (I = 0; total natural abundance 74.5%)
and six hyper
fine lines due to the coupling with
95Mo and
97Mo
nuclei (I = 5/2; total abundance 25.5%), indicated by the
asterisks in
Figure 2
. No signals below 3250 G and above 3650
G were revealed. These features demonstrate that the oxidation
state of Mo is +V with only one electron in the 4d orbitals
(con
figuration 4d
1).
51aThe examination of the EPR spectra
indicates the presence of only one species in the organic
solution (I
d4), characterized by g
iso= 1.955 and A
iso= 40.4
×
10
−4cm
−1. These spin Hamiltonian parameters are consistent
with a Mo(N
2^O
2) equatorial coordination mode
51b
and fall in
the range expected by the correlation between g
isoand A
isoproposed some years ago by Enemark and co-workers.
51cAs it can be observed, the spectral signals decrease
signi
ficantly in the time range 0−26 min (at t = 26 min, only
the central absorption is detected and the signal-to-noise ratio
is very low) and disappear completely for time longer than 30
min, suggesting a probable antiferromagnetic
48acoupling
between the unpaired electrons of the Mo(V) centers in the
bis-
μ-imido bridged oxidomolybdenum(V) complex (4)
formed upon the dimerization of two intermediate I
d4species
(
Scheme 3
).
Electrochemical Properties. Electrochemical properties of
the complexes 1
−5 have been studied by cyclic voltammetry in
DMF solution, and that of I
d4has been studied in DMSO (0.1
M TBAP). The CV traces of all the binuclear
oxidomolybdenum(V) complexes [Mo
2VO
2L
′
21−4] (1
−4) are
of similar pattern, and a representative voltammogram of
[Mo
2VO
2L
′
24] (4) is discussed herein. The redox potentials of
all the complexes are summarized in
Table 2
. It is observed that
4
exhibits a single electron quasi-reversible reductive response
at E
1/2value of
−0.63 V and an irreversible reductive response
at
−1.37 V (
Figure 3
a) which can be assigned to the reduction
of Mo(V)
→ Mo(IV) of the two corresponding molybdenum
centers.
52Further, two single electron quasi-reversible oxidative
responses at E
1/2value of 0.78 and 1.14 V can be attributed to
the oxidation of Mo(V)
→ Mo(VI) in the binuclear species.
In the CV trace of the monomeric dioxidomolybdenum(VI)
complex [Mo
VIO
2L
5] (5), a single electron quasi-reversible
response at E
1/2value of
−0.89 V and an irreversible reductive
response at
−1.69 V are observed (
Figure 3
b). The response at
E
1/2=
−0.89 V can be attributed to the Mo(VI) → Mo(V)
Figure 2.EPR spectra recorded at 298 K as a function of the time onId4dissolved in a degassed DMSO solution: (a) t = 7 min; (b) t = 14
min; (c) t = 20 min; (d) t = 26 min. With the asterisks the six hyperfine lines due to the coupling between the unpaired electron with
95Mo and97Mo nuclei are indicated.
Table 2. Cyclic Voltammetric Results for 1
−5 and (I
d4) at
298 K
a complex Ec 1/2(V), Epc(V) ΔEp (mV) Ea 1/2(V) ΔEp (mV) [Mo2VO2L′21] (1) −0.61, −1.36 372 0.76, 1.14 300, 130 [Mo2VO2L′22] (2) −0.63, −1.33 340 0.75, 1.11 300, 120 [Mo2VO 2L′23] (3) −0.62, −1.35 365 0.76, 1.13 310, 140 [Mo2VO2L′24] (4) −0.63, −1.37 370 0.78, 1.14 310, 110 [MoVIO 2L5] (5) −0.89, −1.69 270[MoVO(HL′4)(OEt)]
(Id4)
−0.91 286
aSolvent: DMF for 1−5 and DMSO for I
d4. Pt working and auxiliary
electrodes and SCE as reference electrode and TBAP as supporting electrolyte. Scan rate: 50 mV/s. E1/2= (Epa+ Epc)/2, where Epaand Epc
are anodic and cathodic peak potentials vs SCE, respectively.ΔEp =
Epa− Epc.
reduction, while the peak at
−1.69 V is due to the reduction of
the salen type ligand.
53aThe CV trace of I
d4(
Figure 4
) shows a single electron
quasi-reversible reductive response at E
1/2value of
−0.91 V due to
the reduction of Mo(V)
→ Mo(IV).
49f,53b,cNo metal centered
oxidation peaks were observed during the anodic scans,
indicating that I
d4is not electrochemically oxidizable to
Mo(VI) species under these conditions.
49f,53bAn irreversible
peak at 1.16 V is observed (
Figure S8
) which may be attributed
to the oxidation of the ligand.
53dUnder identical experimental
conditions, the single electron processes were veri
fied by
comparing its current height with that of the standard
ferrocene
−ferrocenium couple.
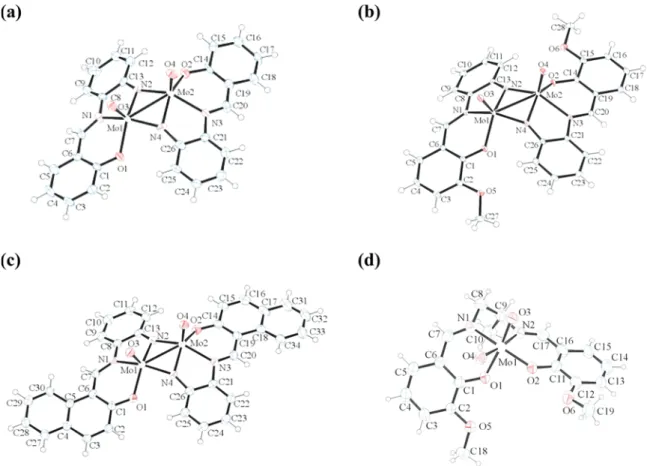
Description of X-ray Structure of Dinuclear Mo(V),
[Mo
2VO
2L
′
21,2,4] (1, 2, and 4), and Mononuclear Mo(VI),
[Mo
VIO
2
L
5] (5), Complexes. The molecular structure of the
dinuclear [Mo
2VO
2L
′
21,2,4] (1, 2, and 4) and mononuclear
[Mo
VIO
2
L
5] (5) complexes was determined by the single
crystal X-ray di
ffraction technique, and ORTEP representations
for the complexes are shown in
Figure 5
. The relevant bond
distances and angles are collected in
Tables 3
and
4
.
The structures of 1, 2, and 4 contain dinuclear [Mo
2VO
2]
6+cores with Mo
−Mo bonds. The rearranged ligands (H
3L
′
1,2,4)
coordinate each molybdenum atom through one phenoxido
oxygen, one imino nitrogen, and one bridging imido nitrogen in
a tridentate chelating manner (formation of [Mo
2VO
2L
′
21−4]
(1
−4) is given in
Scheme 2
). Disregarding the metal
−metal
bond, each molybdenum atom exists in a distorted
square-pyramidal geometry where the MoN
3O
2coordination
environ-ment comprises two imido-bridged nitrogen atoms, one imino
nitrogen atom, and one phenoxido oxygen atom describing the
equatorial plane, and one oxido oxygen as an axial group.
Distortion of the square plane is observed from the di
fference
in the Mo
−O(1)/O(2), Mo−N(1)/N(3), Mo−N(2), and
Mo
−N(4) bond lengths as well as the difference in the bond
angles at the Mo atom [74.6(7) to 109.4(2)
°]. The lengths of
the Mo
O, Mo−O, Mo−N
imino, and Mo
−N
imidobonds are
usual.
1,9e,49a−c,54Both Mo acceptor centers are displaced from
the average equatorial plane described by O(1)/O(2)−N(1)/
N(3)
−N(2)−N(4) toward the axial oxido oxygen atom O(3)/
O(4) by about 0.63(1) Å, the distance of O(3)/O(4) from the
same plane being about 2.3 Å. In the aldehyde oxidoreductase
of Desulfovibrio gigas, similar displacement of the Mo atom from
the equatorial plane toward the apical oxido oxygen atom is also
found.
55Due to this displacement, the Mo
Vacceptor center
becomes somewhat inaccessible to the donor approaching from
the opposite direction. Therfore, it is evident that
[Mo
2VO
2L
′
21−4] (1
−4) has a square-pyramidal structure with
the sixth position, trans to the oxido oxygen atom O(3)/O(4),
vacant. The shorter length of the Mo
−N
imidobond compared to
the Mo−N
iminebond indicates that the deprotonated bridging
imido-N coordinates more strongly to the metal center than the
imino group. The main reason for the structural distortion of
complexes 1, 2, and 4 from the ideal geometry is their observed
average bite angle of the tridentate ligands (79.15
°), which are
signi
ficantly deviated from 90°. The Mo(1)−Mo(2) bond
distance in 1, 2, and 4 ranging between 2.64 and 2.66 Å
indicates the formation of a localized metal
−metal single
bond.
1,3i,j,48b,c,56Here, it is worth mentioning that this is the
first structural evidence of metal−metal bonded
oxidomolybdenum(V) complexes synthesized from salen type
ligands containing an aromatic imine group. Earlier there have
been reports on molybdenum complexes of similar ligands
where molybdenum(VI) oxido
35a−cor peroxido
35dstructures
were proposed on the basis of assumptions from spectral data.
However, the structures of 1, 2, and 4 clearly indicate that in
situ hydrolysis and
−CN bond cleavage of one of the arms of
the salophen ligands, containing an aromatic imine moiety,
takes place in the presence of molybdenum acetylacetonate
leading to the formation of dimeric oxidomolybdenum(V)
complexes.
Figure 3.Cyclic voltammograms of (a) [Mo2VO2L′24] (4) and (b) [MoVIO2L5] (5).
Figure 4.Cyclic voltammogram of [MoVO(HL′4)(OEt)] (I d4).
The mononuclear dioxidomolybdenum(VI) complex (5)
shows a distorted octahedral geometry involving NO
3donors
as the basal plane occupied by one tertiary nitrogen N(1) and
two phenolate oxygen atoms O(1) and O(2), all from the
tetradentate ligand (L
5)
2−, together with a terminal oxido ligand
O(3). Another terminal oxido oxygen atom O(4) and one
tertiary nitrogen N(2), from the ligand, are attached to the
metal atom to
fill its two axial sites and form a trans O(4)−
Mo
−N(2) angle of 167.0(2)°. The Mo atom shifts 0.315(3) Å
out of this mean meridional plane toward the O(4) atom. The
rather long Mo
−N distance 2.28(8) Å of the tertiary nitrogen
N(2), from the ligand, to the sixth coordination position lying
trans to the oxido-oxygen O(4) may be due to the displacement
of the Mo atom from the equatorial mean plane toward O(4).
The Mo
−O(3) and Mo−O(4) bond distances of the MoO
22+group are unexceptional.
38b,47e,57All these structural features as
well as bond length and angle values are in good accordance
with similar cis-MoO
2L complexes of related N
2O
2ligands
reported earlier.
58a,bThe evaluation of structure of 5 involves
application of SQUEEZE to remove the contribution of
disordered solvent from the re
finement, which was finished
before the new SHELX version was available (see also the
Figure 5.ORTEP representations of compounds (a) [Mo2VO2L′21] (1), (b) [Mo2VO2L′22] (2), (c) [Mo2VO2L′24] (4), and (d) [MoVIO2L5] (5) with
displacement parameters of 1, 2, and 4 at 50% and 5 at 30% probability.
Table 3. Selected Bond Distances (Å) and Angles (deg) for
Complexes 1, 2, and 4
1 2 4 Bond Distances (Å) Mo1−O1 2.028(4) 2.016(2) 2.034(3) Mo2−O2 2.020(5) 2.020(2) 2.035(5) Mo1−O3 1.683(4) 1.693(2) 1.698(4) Mo2−O4 1.687(5) 1.696(2) 1.703(4) Mo1−N1 2.170(7) 2.167(2) 2.163(4) Mo1−N2 1.947(5) 1.961(2) 1.974(4) Mo2−N2 1.938(5) 1.962(2) 1.979(4) Mo2−N3 2.175(5) 2.187(2) 2.153(4) Mo1−N4 1.935(6) 1.948(2) 1.963(4) Mo2−N4 1.955(5) 1.960(2) 1.966(4) Mo1−Mo2 2.650(1) 2.656(3) 2.640(6)Bond Angles (deg)
O1−Mo1−N1 83.7(2) 82.7(7) 82.6(1) O2−Mo2−N3 84.1(2) 82.9(6) 82.6(1) O3−Mo1−O1 106.9(2) 108.5(7) 109.0(2) O4−Mo2−O2 106.8(2) 109.2(7) 109.4(2) N2−Mo1−N1 75.2(2) 75.7(7) 75.0(2) N4−Mo2−N3 75.4(2) 74.6(7) 75.8(2) Mo1−N2−Mo2 86.0(2) 85.2(7) 83.8(2) Mo1−N4−Mo2 85.9(2) 85.6(7) 84.4(2) N4−Mo1−O1 87.1(2) 85.7(7) 87.7(2) N2−Mo2−O2 87.6(2) 86.8(7) 86.4(2) O3−Mo1−Mo2 106.7 (2) 108.9(6) 105.4(1) O4−Mo2−Mo1 105.6(2) 108.0(5) 105.4(1)
Table 4. Selected Bond Distances (Å) and Angles (deg) for
Complex 5
bond distances (Å) bond angles (deg)
Mo1−O1 2.101(4) O1−Mo1−N1 89.4(2)
Mo1−O2 1.918(4) O2−Mo1−N2 167.0(2)
Mo1−O3 1.689(5) O5−Mo1−N2 82.3(2)
Mo1−O4 1.701(5) O4−Mo1−N2 167.0(2)
Mo1−N1 2.133(7) N1−Mo1−N2 71.9(2)
Mo1−N2 2.279(8) O1−Mo1−O2 102.9(2)
related B-level CheckCIF alert). Also, recently a
dioxidouranium(VI) complex with a similar tetradentate salen
ligand as H
2L
5has been reported in the literature where the
metal is bound to the N
2O
2donors in the same fashion.
58cDNA Binding Studies. In order to understand the binding
of the molybdenum complexes 1−5 to CT-DNA, different
spectroscopic techniques were used.
Absorption Spectroscopic Studies. The absorption
bands of the complexes 1
−5 originating in the regions 430−
485 and 275
−390 nm are attributed to L−Mo(dπ) LMCT and
intraligand transitions, respectively.
49aThe equilibrium binding
constant (K
b) of the complexes to CT-DNA was determined by
UV
−vis titration experiments (
Table 5
and
Figure 6
). On
addition of CT-DNA to the complex solution, the UV
−vis
absorption bands in the region 275
−390 nm showed a
hypochromic shift for 1
−5 and an appreciable hyperchromic
shift in the LMCT band for complex 5 (
Figure 6
). Both the
hypochromism for 1
−5 and hyperchromism for 5 indicate the
interaction between the oxidomolybdenum complexes and
CT-DNA. The hypochromic shift due to the intraligand transition
for the complexes 1
−5 was taken to calculate the binding
a
ffinity of the complexes with CT-DNA. The resulting
hypochromicity of 1
−5 in the intraligand transition band is
possibly due to the interaction between the electronic states of
the chromophores of the ligands and the DNA bases.
59−61aThe binding a
ffinity of the interaction between CT-DNA and
each of the molybdenum complexes 1
−5 is indicated by the
binding constant, K
b, which was calculated using
eq 1
. The data
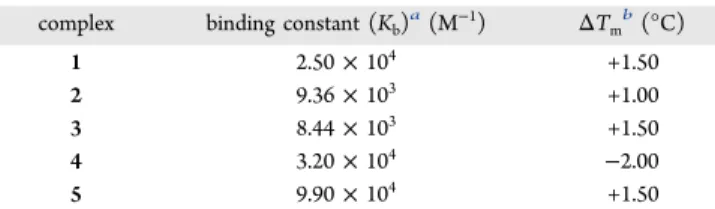
reported in
Table 5
reveal that the DNA binding strengths of
the molybdenum complexes are in the order 5 > 4 > 1 > 2 > 3,
with the K
bvalues of 1
−5 ranging from 9.90 × 10
4to 8.44
×
10
3M
−1. The binding a
ffinity of the ligands to CT-DNA gave
values lower than their corresponding molybdenum complexes
(
Figure S9 and Table S2
). The order of the binding a
ffinity can
mainly be attributed to the small size of the complexes and
incorporation of the electron donating groups attached to the
aromatic rings in the ligands.
61b,cApart from this, both the
phenyl and the naphthyl groups in these ligands may also play
an important role in the interaction of the complexes with
CT-DNA.
61dThermal Denaturation Studies. In order to investigate
the stability of the CT-DNA in the presence and absence of the
molybdenum complexes 1
−5, DNA melting experiments were
performed.
47aThe melting temperature (T
m) of CT-DNA in
the absence of any complex was
∼66 °C, which is in accordance
with our previous reports.
38c−gUpon interaction with 1
−3 and
5, the T
mof CT-DNA increased very slightly (
∼1.00−1.50 °C),
whereas, upon interaction with 4, the same was decreased
slightly (
∼2.0 °C) in
Figure 7
and
Table 5
. The low
ΔT
mvalues
indicate that 1
−3 and 5 may possibly bind to CT-DNA by
groove binding mode rather than an intercalative mode, which
usually gives a large positive
ΔT
mvalue.
62Complex 4 showed a
slightly negative
ΔT
mvalue of
−2.00 °C (
Table 5
and
Figure 7
)
possibly due to the destabilization of the DNA double helix.
63Circular Dichroism Studies. In order to study the
conformational changes in CT-DNA upon the interaction
with complexes, circular dichroism (CD) spectroscopy was
used.
64Two conservative CD bands in the UV region are
observed for CT-DNA: a positive band at 275 nm due to base
stacking interaction and a negative band at 245 nm due to
right-handed helicity.
65aInteraction of small molecules by groove
binding mode shows less or no perturbation on the base
stacking and helicity bands, whereas, during intercalation mode,
intensity changes of both bands can be induced, therefore
modulating the right-handed B-conformation of DNA.
64The
CD spectra of CT-DNA (100
μM) upon the interaction with
1
−5 showed very minute changes, for the positive band at 275
nm as well as for the negative band at 245 nm (
Figure S10
),
which suggests that the interaction of the oxidomolybdenum
complexes 1
−5 were groove binding (possibly minor groove
binding mode) in nature. From the above DNA binding studies
it may be depicted that the naphthyl group interacts with the
DNA by groove binding mode, possibly by van der Waals
forces of interaction, apart from this the naphthyl group can
also interact with the DNA by hydrophobic interactions.
65b,cCompetitive DNA Binding Studies. Competitive DNA
binding studies by
fluorescence measurements using DAPI
could not be performed as the complexes 1
−4 as well as the
ligands H
2L
1−4exhibited an intense
fluorescence in the same
region. In order to assess the major groove and intercalative
binding mode, competitive binding experiments were carried
out with methyl green (MG) and ethidium bromide (EB),
respectively.
38eBut, we did not observe any quenching in the
fluorescence of MG and EB bound to CT-DNA (672 and 597
nm, respectively) upon the successive addition of the
complexes 1
−5.
38eHence, the complexes do not interact
with CT-DNA either by major groove or intercalative mode of
binding. In another way, these two competitive binding results
hinted toward the possibility of interaction of these complexes
with the CT-DNA via minor groove binding mode. In fact,
thermal denaturation and circular dichroism
findings also
indicated a similar possibility, i.e., the complexes 1
−5 possibly
interact with the CT-DNA by minor groove binding mode.
DNA Cleavage Studies. Chemically Induced DNA
Cleavage. The chemically induced DNA cleavage activity of
1
−5 (1−100 μM) was performed in the dark, using supercoiled
pUC19 DNA (300 ng) in 50 mM Tris
−HCl buffer (pH 8.0) in
1% DMF, in the presence of hydrogen peroxide (500
μM) as
the oxidizing agent. The molybdenum complexes do not exhibit
any chemically induced DNA cleavage activity.
Photoinduced DNA Cleavage. To evaluate whether 1
−5
possess photonuclease activity, a photoinduced DNA cleavage
activity assay was carried out. The photoinduced DNA nuclease
activity of 1
−5 on irradiation of UVA light of 350 nm for 3 h in
the absence and presence of the complexes was studied using
supercoiled (SC) pUC19 DNA (300 ng) in 50 mM Tris
−HCl
bu
ffer (pH 8.0) containing 1% DMF (
Figure S11
). The extent
of the DNA cleavage was confirmed by the decrease in the
supercoiled pUC19 DNA (form I) and subsequent formation
of nicked circular DNA (form II) and linear DNA (form III).
The percentage of net DNA cleavage by the complexes was
estimated using the following equation:
Table 5. DNA Binding Parameters for 1
−5
complex binding constant (Kb)a(M−1) ΔTmb(°C)
1 2.50× 10⁴ +1.50
2 9.36× 10³ +1.00
3 8.44× 10³ +1.50
4 3.20× 10⁴ −2.00
5 9.90× 10⁴ +1.50
aDNA binding constants were determined by the UV−vis spectral
method.bChange in the melting temperature of CT-DNA.
= + ×
+ + ×
− + ×
+ + ×
Net DNA cleavage %
form II 2 form III form I form II 2 form III
form II 2 form III form I form II 2 form III
s s
s s s
c c
c c c (2)
The subscripts s and c refer to the sample and control,
respectively.
65Since we did not observe a DNA band
corresponding to form III in our photonuclease studies, the
concentration of form III is put as zero for both
“control” and
“sample”. The DNA cleavage activity of the molybdenum
complexes 1
−5 was carried out in a concentration dependent
manner from 1 to 100
μM. The net DNA cleavage percent by
1−5 was plotted with increasing concentration of the
molybdenum complexes (
Figure 8
). Approximately 1
−5%
DNA cleavage was observed in the presence of 1
μM of 1−3
and 5 whereas at the same concentration 4 showed a DNA
cleavage of
∼37% (
Figure 8
). The DNA cleavage activity for
each of the complexes was saturated at a concentration of 50
μM. At this concentration, the photonuclease activity of 1, 2, 3,
4, and 5 was approximately, 17, 26, 36, 93, and 4%, respectively.
This indicated that 4 has the most promising photonuclease
activity among the complex series. Cleavage activity of 1
−5
varies due to the different functional groups present in the
ligand moieties.
38c−gComplex 4 exhibits the highest
photo-nuclease activity, which may be due to the presence of extended
aromatic ring on the naphthyl group
61dpresent in the ligand
moiety. Apart from this, the presence of the phenyl group and
the electron donating groups on the aromatic rings might also
in
fluence the DNA cleavage activity of the complexes.
61cFrom
Figure 6.Electronic absorption spectra of 1 (a), 2 (b), 3 (c), 4 (d), and 5 (e) (25μM) upon the titration of CT-DNA (0−50 μM). The experiments were performed in 10 mM Tris−HCl buffer (pH 8.0) containing 1% DMF. Arrow indicates the changes in absorbance with respect to an increase in the CT-DNA concentration. The linearfit of [DNA]/(εa− εf) vs [DNA] is given in the inset. The binding constant (Kb) was calculated usingeq 1.
Figure 7. Derivative plot of thermal denaturation of CT-DNA (100 μM) in the absence and presence of 1−5 (25 μM) in 10 mM Tris− HCl buffer (pH 8.0) containing 1% DMF. The ΔTm (°C) of the
complexes as compared to CT-DNA is shown in the inset.
![Table 2. Cyclic Voltammetric Results for 1 − 5 and (I d 4 ) at 298 K a complex E c 1/2 (V),E pc (V) Δ E p (mV) E a 1/2 (V) Δ E p (mV) [Mo 2 V O 2 L′ 2 1 ] (1) −0.61, −1.36 372 0.76, 1.14 300, 130 [Mo 2 V O 2 L ′ 2 2 ] (2) − 0.63, − 1.33 340 0.75, 1.11 300,](https://thumb-eu.123doks.com/thumbv2/123doknet/14883240.645486/8.892.470.833.698.830/table-cyclic-voltammetric-results-and-complex-δ-δ.webp)
![Figure 3. Cyclic voltammograms of (a) [Mo 2 V O 2 L ′ 2 4 ] (4) and (b) [Mo VI O 2 L 5 ] (5).](https://thumb-eu.123doks.com/thumbv2/123doknet/14883240.645486/9.892.98.815.109.362/figure-cyclic-voltammograms-mo-v-o-mo-vi.webp)