Comparative Evaluation of Pelvic Allograft Selection Methods
H
ABIBB
OUSLEIMAN,
1L
AURENTP
AUL,
2L
UTZ-P
ETERN
OLTE,
1and M
AURICIOR
EYES11
Institute for Surgical Technology and Biomechanics, University of Bern, Stauffacherstrasse 78, 3014 Bern, Switzerland; and 2
Department of Orthopaedic Surgery, Saint-Luc University Hospital (UCL Universite´ Catholique de Louvain), Brussels, Belgium
(Received 27 September 2012; accepted 2 January 2013; published online 9 January 2013)
Associate Editor Xiaoxiang Zheng oversaw the review of this article.
Abstract—This paper presents a firsthand comparative eval-uation of three different existing methods for selecting a suitable allograft from a bone storage bank. The three examined methods are manual selection, automatic volume-based registration, and automatic surface-volume-based registration. Although the methods were originally published for different bones, they were adapted to be systematically applied on the same data set of hemi-pelvises. A thorough experiment was designed and applied in order to highlight the advantages and disadvantages of each method. The methods were applied on the whole pelvis and on smaller fragments, thus producing a realistic set of clinical scenarios. Clinically relevant criteria are used for the assessment such as surface distances and the quality of the junctions between the donor and the receptor. The obtained results showed that both automatic methods outperform the manual counterpart. Additional advantages of the surface-based method are in the lower computational time requirements and the greater contact surfaces where the donor meets the recipient. Keywords—Tumor resection, Orthopedic oncology, Allo-graft selection, Surface registration, Volume registration, Computer-assisted surgery.
INTRODUCTION
Bone allograft reconstruction is an accepted proce-dure for the recovery of the original anatomy following a pathological or traumatic defect. Biological and prosthetic implants are among the various existing reconstruction methods. The choice of treatment is mostly a case-specific decision.17 Despite their high complication rate and their slow incorporation into the host bed, biological massive allografts are recom-mended for great defects such as traumatic or
patho-logical defects of the pelvis. Clinical reports suggest that this approach preserves the long-term bone stock and limb functionality.6,11,14–17,21 Furthermore, long-term follow-up studies support and promote the use of allografts instead of prosthetic implants especially in younger patients.14,21
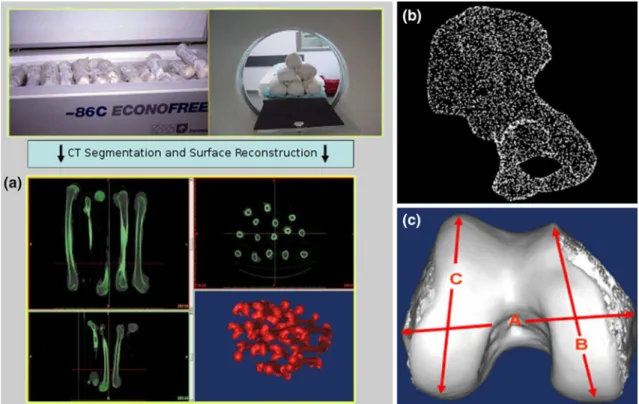
A poor anatomical matching between the host and the donor can alter the joint kinematics and load dis-tribution, leading to articular fractures or joint degeneration.12,15 Therefore, size and shape determi-nation is critical to obtain an appropriate allograft.22 Moreover, optimal handling of the bone bank ensures minimal loss of the usually scarce cadaver bone stock. Access to bone allografts was facilitated with the development of centralized bone banks where bones are collected from cadavers, fresh-frozen for storage, and distributed to medical centers.13The bank systems sometime digitally store three-dimensional copies of the bones and use them for the selection process. However, the task of selecting a suitable allograft remains a major challenge.4 Typically, bone banks select an appropriate donor by manually measuring anatomical dimensions on 2D radiographs.18 Such a manual approach is rather subjective, time-consuming, and prone to errors. This calls for the need to intro-duce automated and more accurate techniques for this specific task. Figure 1a illustrates the major functions of a bone banking facility in which donors are scanned and reconstructed in 3D.22
This work is a joint collaboration between the authors of three allograft selection methods aiming to provide a comprehensive comparison and evaluation of their respective performance and reliability. Although the methods were originally published for different bones, they were adapted to be systematically applied on the same data set of hemi-pelvises. The overall experimental design is illustrated in Fig.2. The
Address correspondence to Habib Bousleiman, Institute for Surgical Technology and Biomechanics, University of Bern, Stauf-facherstrasse 78, 3014 Bern, Switzerland. Electronic mail: habib. [email protected]
Annals of Biomedical Engineering, Vol. 41, No. 5, May 2013 (Ó2013)pp. 931–938 DOI: 10.1007/s10439-013-0739-0
0090-6964/13/0500-0931/0Ó2013 Biomedical Engineering Society 931
paper starts by briefly reintroducing the methods. The evaluation protocol is then described. The results and statistical analysis are subsequently listed and dis-cussed.
MATERIALS AND METHODS Evaluated Allograft Selection Methods
Recent efforts aimed at developing methods capable of reliably selecting a bone fragment that matches the resection-specific anatomy of the patient. Of interest to
this work are three conceptually different methods that share the same purpose. The first allograft selection method is mostly manual but uses a computerized virtual environment.22The second bases the search on image-to-image- or volume-registration.19 Whereas, the third method utilizes surface-to-surface registra-tion.2
All three methods share the same objective, that is to find among a set of healthy bones (hereafter desig-nated as donors), the fragment(s) that closely resem-ble(s) the morphology of the bone to be reconstructed (hereafter designated as recipient). The methods also delineate the bone regions where the donor bone has to be cut to assist with the extraction of the allograft. The following paragraphs offer a brief description of the three methods under scrutiny.
Manual Selection
Manual selection based on 2D template comparison is the current gold standard for selecting an appro-priate allograft.18 A more advanced method for man-ual selection based on a 3D reconstruction of CT images of the available donors was proposed by Ritacco et al.22 The computer tools and virtual envi-ronment used might vary, but the approach is unchanged. The user interacts with the virtual models and tries to adequately position and align the recipient
FIGURE 1. (a) Bone bank system showing the different steps of freezing the bones, acquiring CT images, segmenting the volumes, and reconstructing the surfaces in 3D. (b) Surface representation of the hemi-pelvis using a dense cloud of surface points. (c) Landmark configuration for morphological measurements.
to all donors in the bank. A subsequent visual assess-ment is carried out to select the most appropriate donor(s). The computer system used for this purpose consists of a dual core 2.00 GHz processor with 2 GB of RAM, running under WindowsÒ XP. In Ritacco et al.,22 the authors augment the morphological information by adding three anatomical distances measured between manually placed landmark points. Figure1c shows the landmark configuration system used in Ritaccoet al.22
Volume-Based Registration
Volume-based or image-to-image registration was used in this method19 to match similar objects (recipient and donor). Only rigid registration was applied in order to preserve the morphology of the bones. A similarity metric composed of intensity-based difference between voxels of two images is computed and used for the optimization of the registration. Surface-to-surface distance was used to rank the do-nors and as a selection criterion. A 64-bit 8-core IntelÒ i7 1.60 GHz with 8 GB of RAM running under Win-dowsÒ7 was used for the application of this method. Figure3 illustrates how the rigid registration algo-rithm transforms one image to fit another. The authors concluded that this method is faster and more reliable than the gold standard method that they used in their previous study.18 In Paul et al.,18 a two-dimensional template is printed on a transparent sheet and manu-ally aligned with radiographs of the donors.
Surface-Based Registration
This method2 is directly applied on surface repre-sentations of the bones of interest. The surfaces are composed of a dense set of points generated by seg-menting CT (computed tomography) images and 3D reconstructing the individual bones (Fig. 1b). An ICP-based (iterative closest point1) algorithm is applied in order to compute the transformation that results in the best fit between the recipient and a donor bone. The process is repeated until the recipient is registered to all
bones in the database. Surface distance metrics are then used to select the best matching allograft(s). A 32-bit architecture, 3.00 GHz IntelÒ CoreTM 2 Duo CPU with 3.25 GB of RAM was used for the auto-matic selection method. The allograft sorting and selection metric is the same used for the volume-based method. Figure4 shows an example from the original work showing a sample result of the surface-based registration method applied on the distal femur. Sur-face distances are illustrated in the form of color maps for the best two and worst donors. The authors reported a significant improvement over the manual method in terms reliability and repeatability while keeping a good agreement with the gold standard. For the particular bones, the reported computation time is also considerably lower than that of the manual selection22 and volume registration.19 However, the study2 was not meant as a comprehensive evaluation and the dataset used for the evaluation was not con-sistent among the different methods.
Experimental Data
As mentioned in the previous section, and in order to present an unbiased evaluation and comparison, the three methods were applied on the same dataset. The dataset consists of ten left hemi-pelvises extracted from CT images of cadaveric specimens (1.0 mm slice spacing, 2.7 mm slice thickness, 1.0 s per 360° rotation, peak 90 kV). Each segmented hemi-pelvis was recon-structed to obtain a three-dimensional point cloud (Fig. 1b). The points were triangulated to form a sur-face mesh of each instance for enhanced visualization. This dataset is considered as the common ground data to be treated as donors by all three methods. An experienced surgeon applied cuts on each one of the ten hemi-pelvises in order to divide them into three separate fragments. The fragments correspond to
FIGURE 3. Visualization of the volume- or image-based registration result. The 2D views (a) presents the donor (or-ange/red) merged with the recipient (light gray). The 3D view (b) shows the general shape of both bones (white is the re-cipient, blue is the donor).
FIGURE 4. Three-dimensional view of a sample result of the surface registration method. The surface distance between the recipient and the donors from the databank is represented as color-coded surface maps. The leftmost sample is the best match, the middle one is the second best, whereas the right-most bone is the one with the highest surface error metric (Source Bou Sleiman et al.2).
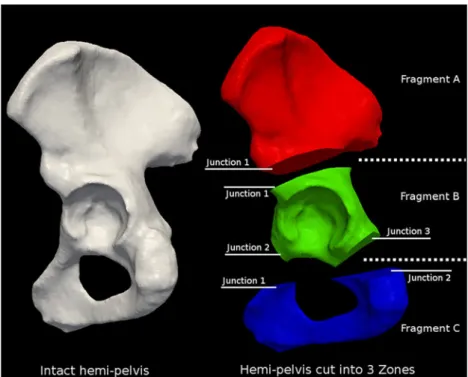
common clinical scenarios of resection and grafting and consistent with the guidelines presented in Enne-kinget al.7The three fragments are assigned the letters A, B, and C for the iliac, acetabular, and pubic regions, respectively. The cuts are carried out using virtual planes in a 3D environment. This resulted in a total of four categories, each made of ten recipients. The first is the data set with the intact hemi-pelvis. The other three are composed of either one of the three cut out frag-ments. Figure5 shows one example of the cutting configuration and the resulting junctions. A junction is defined as the contact surface between the recipient and the corresponding potential donor. In the current configuration, fragment A has one junction, whereas fragments B and C have three and two junctions, respectively. Fragments A and C are slightly less realistic as the sacroiliac and the pubic joints are not included in our analysis. However, slight relative motion is allowed at the level of these joints, a smooth and rigid transition is not as crucial as it is at the level of bone-to-bone junctions.
Testing Protocol
The three allograft selection methods, namely manual selection, volume-based registration, and sur-face-based registration were applied on the datasets described earlier. An experiment is defined as the regis-tration of every recipient to all donors in the databank and the subsequent sorting of donors in descending
order of similarity to each recipient. Having four cate-gories of recipients and one category of donors, four registration experiments were performed by each method. The first experiment considers the intact hemi-pelvis as a recipient, whereas the other three experiments use the individual fragments as recipients.
In all experiments, the databank of donors is com-posed of the set of intact hemi-pelvises. The measure of similarity is a method-specific quantity. The direction of the registration (definition of fixed and moving entities) also depends on the method being applied. However the results reported herein are rearranged for consistency. In total, 10 9 10 (= 100) individual reg-istrations are carried out for every experiment.
Since the recipients are extracted from the same set of donors, there will be one registration per recipient that is expected to result in a virtually perfect overlap. This hemi-pelvis will be referred to as a trap graft and was also included in the experiments. A random spatial transform (translation and rotation) was applied to all donors prior to starting the process in order to eliminate subjective biases caused by already overlapping trap grafts. The datasets were then stored under modified file names for complete experimental blindness.
Following each registration process, we used the initial cutting planes used to separate the individual fragments to extract the interfaces between the donor and recipient. For every junction, the surface area of the junctions from either side, as well as that of their inter-section, was computed. Dice coefficients5 quantifying
FIGURE 5. Cutting configuration of the hemi-pelvis into three fragments. Zone I, II, and III in (FA) red, (FB) green, and (FC) blue
according to the guidelines presented in Enneking et al.7Depending on its anatomical location and cutting planes, each fragment presents different number of donor-recipient junctions.
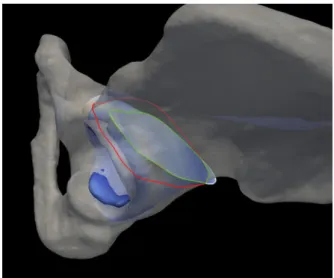
the quality of the contact surfaces at the interface between the donor and the recipient were calculated. Dice coefficients can take values within the range [0, 1], and describe the amount of overlap between two areas. Figure6shows an example of overlapping contact sur-faces at the junction area.
We also computed surface distance metrics between the donors and the recipients. The mean surface distance consists of the average value of the individual Euclidean distances between corresponding surface points (generated using a space dividingkd-tree). It provides information about the overall global similarity between the two sur-faces. The Hausdorff surface distance9 is the largest amongst the individual Euclidean distances and it indicates the largest possible distance between the two surfaces.
Comparative Evaluation and Statistical Analysis In order to present a comprehensive evaluation and comparison of the methods, a set of statistical tests was designed and applied on the final outcome of the methods.20 The first test is aimed to compare the ability of the different methods to correctly detect and classify the trap graft. For this purpose, Fisher’s exact test was applied to check for differences between the various outcomes. The v2-test was not used because some of the expected frequencies in the contingency tables were smaller than 5. A significance level of 0.05 was chosen for this and all subsequent tests.
The level of resemblance among the spectrum of results of the various methods was assessed. For every analogous pair of results, the agreement over identi-fying the best three donors was determined by calcu-lating the corresponding Cohen’s j.3 The levels of
agreement are classified according to the standard interpretation of Cohen’s j.10
In order to measure the statistical significance of the differences between different corresponding measure-ments, methods using analysis of variance or ANOVA were applied. Except for the processing time, the evaluation measurements were applied exclusively on the three best ranked candidate donors by each of the methods. The processing time indicates the time required by the manual or automatic selection only, without taking into account the time needed to load and unload the data from the system’s memory.
RESULTS
In most cases, all methods were successfully able to detect the trap graft. Only for the case of fragment A (FA), the manual method failed to detect the trap graft four out of ten times. Fisher’s exact test resulted in an overall p value of 0.116, indicating a difference that is not statistically significant between the groups and therefore all three methods were able to detect the trap graft with similar performance.
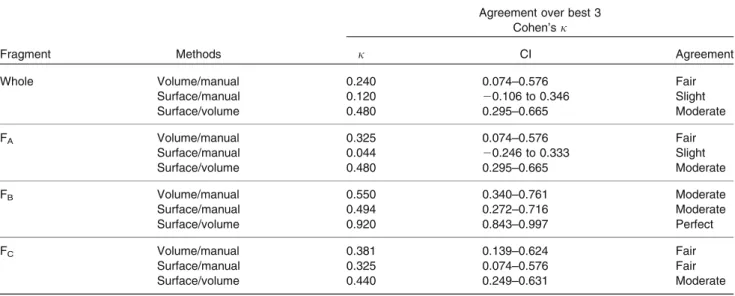
Cohen’sj was used to assess the level of agreement of the three methods in selecting the best three candi-date donors and the corresponding results are listed in Table 1. There is a general agreement between the different methods with varying levels. We did not record any cases where a clear disagreement or acci-dental agreement in the selection was obtained.
In terms of time requirement, the manual and the volume registration methods required approximately the same amount of time without evidence of signifi-cant difference. However, the manual method requires continuous user input, whereas the volume-based method can be ran as a background process. The surface-based method performed substantially faster. The average time for a single registration required by each of the methods is compared and illustrated in Fig. 7. Both automatic methods have an overhead time of loading and unloading the data into memory which was not included in the analysis. However, this time depends on the specific hardware being used and the type of data (images or surface representations).
Figure8shows a comparison of the resulting surface distances, namely, the mean and the Hausdorff surface distances, between the donors and the recipients. For all cases, the manual method resulted in higher surface-to-surface distances and both automatic methods yielded statistically significant improvement. However, mostly not significant differences are measured between the results of the two automatic algorithms, with the exception of the Hausdorff distance at fragment A.
FIGURE 6. Overlap of the contact surfaces at one junction between the donor and the template. The contours of the (white) template, (red) donor, and (green) intersection area at the junction are shown in colors.
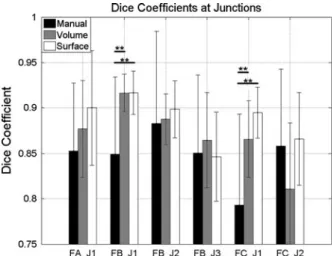
Of high interest to the outcome of the intervention is the quality of the contact surface overlap at the level of the junctions between the donor and the recipient bones. The corresponding measurements are shown in Fig. 9 for all junctions described in Fig.5. Interest-ingly, in most cases the automatic methods outperform the manual counterpart, and the surface-based method is often yielding the best overlap. Moreover, statisti-cally significant differences between the qualities of the overlap were obtained in two cases, in particular at junction 1 of fragment B and junction 1 of fragment C.
DISCUSSION
In this paper we presented a comparative evaluation of the performance of three different allograft selection
FIGURE 7. Comparison of the time required for a single registration. FA, FB, and FC indicate the different fragments
(***p < 0.001).
TABLE 1. Agreement between the different methods on the choice of the best three candidate donors using Cohen’s j test.
Fragment Methods
Agreement over best 3 Cohen’s j
j CI Agreement
Whole Volume/manual 0.240 0.074–0.576 Fair
Surface/manual 0.120 20.106 to 0.346 Slight Surface/volume 0.480 0.295–0.665 Moderate FA Volume/manual 0.325 0.074–0.576 Fair Surface/manual 0.044 20.246 to 0.333 Slight Surface/volume 0.480 0.295–0.665 Moderate FB Volume/manual 0.550 0.340–0.761 Moderate Surface/manual 0.494 0.272–0.716 Moderate Surface/volume 0.920 0.843–0.997 Perfect FC Volume/manual 0.381 0.139–0.624 Fair Surface/manual 0.325 0.074–0.576 Fair Surface/volume 0.440 0.249–0.631 Moderate
FA, FB, and FCindicate the different fragments.
FIGURE 8. Comparison of the post-registration (left) Hausdorff surface distance and (right) mean surface distance between the recipient and the candidate donors. FA, FB, and FCindicate the different fragments (*p < 0.05, **p < 0.01, ***p < 0.001).
methods. One manual and two automatic methods were the subject of this study. We used the pelvis as a target site due to its complex morphology, prevalence (around 30 malignant pelvis tumors per year in Argentina, 75 massive bone allografts per year in Belgium out of which 15 of the pelvis) of the procedure, and the difficulty of bone grafting in this specific location. Several criteria were used for the assessment. In particular, the ability of the methods to detect the trap grafts, the agreement between the methods over the selection and ranking of candidate donors, surface-to-surface distances between the donor and the recipient, quality of the overlap at junction levels, and required processing time. Input data was standardized for all three methods and subjective bias was eliminated.
The obtained results clearly indicated that both automatic methods outperformed the manual selection in all measured aspects while maintaining the agreement about the best three ranked donors. In contrast to the standard 2D template search,18all methods were able to accurately detect the trap graft with exceptions that are not statistically significant. This finding indicates that the manual method based on comparison of 3D models performs better than the manual method based on 2D templates,18 which failed in consistently detecting the trap graft. Surface distances were largely reduced with the automatic methods. This is mostly due to the human factor while manually aligning the donor and recipient. Moreover, there were some instances where the surface-based method resulted in statistically significant improvement over the volume-based counterpart. This result is inherent to the volume-based method that uses intensity values of images to perform the matching. The algorithm tends to be more affected by the high-intensity
cortical bone than the remaining structures which might produce slight biases and misalignments. Furthermore, the image matching is done using the whole image vol-ume where the high proportion of background voxels reduces the accuracy and increases computational time. In an actual clinical setup, the images would be cropped to cover only the volume of interest.
Moreover, our quantitative results showed a general trend where the surface-based approach results in the best quality of the overlap, whereas the manual method often comes last. The quality of surface over-lap at the junctions between the donor and recipient is a major aspect that dictates the outcome of the surgery and the difficulty of the transplantation procedure. Furthermore, a smoother transition between the bones facilitates the placement of reconstruction plates and might have positive impact on the incorporation of the allograft into the host bed, thus might decrease the non-union rate. Registering a fragment to a whole pelvis will result in contact regions analogous to the junctions between the recipient and the allograft at the contact points.
Based on the obtained results, we can conclude that bone banking centers and allograft selection services could adopt the novel automatic methods. Among the direct advantages are improved quality of the selected donors and faster case processing and therefore reduced costs and higher throughput. The computational nature of the automatic methods can provide further benefits. For instance, they can be incorporated into the surgical planning pipeline to guide the clinician in extracting the graft and performing the resection, and to pre-opera-tively visualize the possible outcomes of the surgery. One could develop a fully or partially automatic system capable of managing the problem of allograft selection with features ranging from the collection of donor bones and archiving them to accurately planning the flow of the surgery. Moreover, the application of the automatic methods is not limited to the selection of allografts. With minor adaptation, they can be used for other surgical procedures such as bone augmentation using auto- or allografts. Bone augmentation is a common technique applied in several surgical specialties such as dentistry and craniomaxillofacial.8
Our evaluation was thorough in terms of the experimental setup and the clinical relevance of the criteria used in the analysis. However, further studies could include other anatomical regions where bone transplantation is commonly performed such as the proximal tibia or distal femur. Additionally, mechan-ical studies simulating the in vivo performance of the grafts could be carried out in order to complement and further validate the design criteria presented in this and the original papers.
FIGURE 9. Comparison of the dice coefficients at the junc-tions between the recipient and candidate donors. FA, FB, and
FCindicate the difference fragments, J1, J2, and J3 indicate
the different junctions (**p < 0.01).
ACKNOWLEDGMENTS
We would like to thank Dr. Pierre-Louis Docquier, Dr. Salman Alaraibi for carrying out the manual selec-tion. We also thank Dr. Lucas E. Ritacco for partici-pating in the application of the manual method and pre-processing the data. This work was carried out within the frame of the National Centre of Competence in Research, Computer-Aided and Image-Guided Medical Interventions (NCCR Co-Me), supported by the funds of the Swiss National Science Foundation (SNSF).
REFERENCES
1Besl, P., and N. McKay. A method for registration of 3-D shapes. IEEE Trans. Pattern Anal. Mach. Intell. 14:239–256, 1992.
2
Bou Sleiman, H., L. E. Ritacco, L. Aponte-Tinao, D. L. Muscolo, L.-P. Nolte, and M. Reyes. Allograft selection for transepiphyseal tumor resection around the knee using three-dimensional surface registration. Ann. Biomed. Eng. 39:1720–1727, 2011.
3
Cohen, J. A coefficient of agreement for nominal scales. Educ. Psychol. Measur.20:37–46, 1960.
4
Delloye, C., X. Banse, B. Birchard, P.-L. Docquier, and O. Cornu. Pelvic reconstruction with a structural pelvic allo-graft after resection of a malignant bone tumor. J. Bone Jt. Surg. Am.89:579–587, 2007.
5
Dice, L. R. Measures of the amount of ecologic association between species. Ecology 26:297–302, 1945.
6
Donati, D., C. Di Bella, T. Frisoni, L. Cevolani, and H. DeGroot. Alloprosthetic composite is a suitable recon-struction after periacetabular tumor resection. Clin. Ort-hop. Relat. Res.469:1450–1458, 2011.
7Enneking, W. F., and W. K. Dunham. Resection and reconstruction for primary neoplasms involving the innominate bone. J. Bone Jt. Surg. 60:731–746, 1978. 8
Greenberg, A. M., and J. Prein (eds.). Craniomaxillofacial Reconstructive and Corrective Bone Surgery. New York: Springer, 2002.
9
Huttenlocher, D. P., G. A. Klanderman, and W. J.
Rucklidge. Comparing images using the Hausdorff
distance. IEEE Trans. Pattern Anal. Mach. Intell. 15:850–863, 1993.
10
Landis, J. R., and G. G. Koch. The measurement of ob-server agreement for categorical data. Biometrics 33:159– 174, 1977.
11
Malhotra, R., and V. Kumar. Acetabular revision using a total acetabular allograft. Indian J. Orthop. 43:218–221, 2009. 12
Mankin, H. J., M. C. Gebhardt, L. C. Jennings, D. S. Springfield, and W. W. Tomford. Long-term results of allograft replacement in the management of bone tumors. Clin. Orthop. Relat. Res.324:86–97, 1996.
13Mankin, H., M. Gebhardt, and W. Tomford. The use of frozen cadaveric allografts in the management of patients with bone tumors of the extremities. Orthop. Clin. N. Am. 18:275–289, 1987.
14
Matejovsky, Z., and I. Kofranek. Massive allografts in tumour surgery. Int. Orthop. 30:478–483, 2006.
15
Muscolo, D. L., M. A. Ayerza, L. Aponte-Tinao, and G. Farfalli. Allograft reconstruction after sarcoma resection in children younger than 10 years old. Clin. Orthop. Relat. Res.466:1856–1862, 2008.
16
Muscolo, D. L., M. A. Ayerza, L. Aponte-Tinao, and M. Ranalletta. Partial epiphyseal preservation and intercalary allograft reconstruction in osteosarcoma of the knee. J. Bone Jt. Surg.86:2686–2693, 2004.
17
Ozger, H., M. Bulbul, and L. Eralp. Complications of limb salvage surgery in childhood tumors and recommended solutions. Strateg Trauma Limb Reconstr. 5:11–15, 2010. 18Paul, L., P.-L. Docquier, O. Cartiaux, O. Cornu, C.
Del-loye, and X. Banse. Inaccuracy in selection of massive bone allograft using template comparison method. Cell Tissue Bank.9:83–90, 2008.
19Paul, L., P.-L. Docquier, O. Cartiaux, O. Cornu, C. Del-loye, and X. Banse. Selection of massive bone allografts using shape-matching 3-dimensional registration. Acta orthopaedica81:252–257, 2010.
20
Petrie, A. Statistics in orthopaedic papers. J. Bone Jt. Surg. Br.88:1121–1136, 2006.
21
Ramseier, L. E., T. I. Malinin, H. T. Temple,
W. A. Mnaymneh, and G. U. Exner. Allograft recon-struction for bone sarcoma of the tibia in the growing child. J. Bone Jt. Surg. Br.88:95–99, 2006.
22
Ritacco, L. E., A. A. Espinoza Orı´as, L. Aponte-Tinao, D. L. Muscolo, F. G. B. de Quiro´s, and I. Nozomu. Three-dimensional morphometric analysis of the distal femur: a validity method for allograft selection using a virtual bone bank. Stud. Health Technol. Inform. 160: 1287–1290, 2010.