S U P P L E M E N T A R T I C L E
Potential Market for Novel Tuberculosis
Diagnostics: Worth the Investment?
Sandra V. Kik,1Claudia M. Denkinger,1,2Carole Jefferson,3Janet Ginnard,4and Madhukar Pai1
1McGill International TB Centre and Department of Epidemiology and Biostatistics, McGill University,2Foundation for Innovative New Diagnostics (FIND), Geneva, Switzerland,3Independent Consultant, Pennsylvania; and4UNITAID, Geneva, Switzerland
Background. The potential available market (PAM) for new diagnostics for tuberculosis that meet the specifi-cations of the high-priority target product profiles (TPPs) is currently unknown.
Methods. We estimated the PAM in 2020 in 4 high-burden countries (South Africa, Brazil, China, and India) for tests that meet the specifications outlined in the TPPs. The yearly PAM was estimated for the most likely application of each TPP.
Results. In 2020 the PAM for all 4 countries together was estimated to be (1) 12M tests/year with a value of 48M-71M USD for a sputum smear-replacement test; (2) 16M tests/year with a value of 65M–97M USD for a biomarker test; (3) 18M tests/year with a value of 18M–35M USD for a triage test; (4) 12M tests/year with a value of 59M– 2238M USD for a tuberculosis detection plus drug susceptibility test (DST) all-in-one or 1.5M tests/year for a DST that follows a positive tuberculosis detection test with a corresponding value of 75M–121M for both tubercu-losis detection and DST.
Conclusions. Although there is a considerable potential market for novel tuberculosis diagnostics that fit the specification of the TPPs in the 4 high-burden countries, the actual market for an individual product remains uncertain.
Keywords. tuberculosis; diagnostics; market analysis; market projection; cost; tests; target product profiles.
Recently the World Health Assembly adopted the post-2015 global tuberculosis strategy setting the target for a world free of tuberculosis [1].
Without the introduction of new tools that can cause a more rapid decline in tuberculosis incidence than the cur-rent global decline of 2% per year, it is obvious that the post-2015 targets will not be achieved. The development and implementation of new tools and interventions, such as a more effective tuberculosis vaccine, and tuberculosis treatment regimens or more accurate diagnostics that reach more patients are therefore urgently needed.
Recently the tuberculosis community identified the highest needs for new tuberculosis diagnostics [2,3].
Four of these detailed target product profiles (TPPs) were developed, and the tuberculosis community reached consensus on the most important specifications laid out in each of these TPPs [4,5]. The 4 TPPs, described in de-tail elsewhere in this supplement [4] included (1) A point of care sputum-based test as a replacement for smear-microscopy (‘smear replacement test’); (2) A point of care, non-sputum-based test capable of detecting all forms of tuberculosis via the identification of characteris-tic biomarkers or biosignatures, ideally suitable for use at levels below microscopy centers (“non-sputum based bi-omarker test”); (3) A simple, low cost, point of care triage test, for use byfirst-contact health care providers as a rule-out test, ideally suitable for use by community health workers (“triage test”); and (4) A rapid drug sus-ceptibility test (DST) that either combines tuberculosis detection and DST into one step (“tuberculosis detection plus DST upfront”) or performs tuberculosis detection first and is followed by DST as a second step whenever tuberculosis (or tuberculosis and rifampicin resistance) is detected (“DST after tuberculosis detection test”).
Test developers have indicated that apart from clearly specified product requirements, key drivers for them to
Conference meeting: Preliminary results of this work have been presented at the 7th FIND symposium“Partnerships driving innovative diagnostic solutions in support of TB elimination” in Barcelona, Spain on 29 October 2014.
Correspondence: Sandra Kik, PhD, KNCV Tuberculosis Foundation, PO Box 146, 2501 CC The Hague, The Netherlands ([email protected]).
The Journal of Infectious Diseases®
2015;211(S2):S58–66
© The Author 2014. Published by Oxford University Press on behalf of the Infectious Diseases Society of America. All rights reserved. For Permissions, please e-mail: [email protected].
DOI: 10.1093/infdis/jiu817
start or continue product development are the time to return on investment, the global market size, the market size on a country level, and the market dynamics [6].
Thus far, several analyses of the tuberculosis diagnostic market have been done, either on a global level or on a country level [7– 9]. The tuberculosis diagnostic market has been determined for South Africa and Brazil, and others are underway for China and India [7,9]. Those assessments focused on the current, served available market of existing tuberculosis diagnostics and did not make any inferences on the potential market of novel tests that target other (new) populations now or in the near future.
In this article, we estimate the potential available market (PAM) for the 4 novel high-priority tests, for which TPPs are in place. This market is described for 4 high-burden countries, being South Africa, Brazil, China, and India, which are part of the BRICS countries (including Russia). The BRICS countries amount to 60% of the total burden of tuberculosis in the 22 high-burden countries and therefore are of special interest for test developers and for tuberculosis control.
METHODS
The potential market in 2020 was estimated both in terms of volume and value for the following 4 selected countries; South Africa, Brazil, China, and India. These countries are emerging economies that are of interest for test manufacturers and have a high tuberculosis burden (they account for 46% of the 6 million tuberculosis cases detected in 2012). The potential market value was calculated by multiplying the projected volume for each of the tests by its lowest and highest price as indicated in the TPP. How-ever, the prices indicated in the TPP are ex-works costs which in-clude the manufacturers’ price but do not include any costs related to shipping, import, tax, and distribution. Because there was no consensus reached on the price of the rapid DST TPP, we assumed that the price of the “tuberculosis detection plus DST upfront test” would lie in the range of US$5 to US$20 per test, similar to what was assumed by Pantoja et al [10]. When DST would only follow a positive tuberculosis detection (or rifampicin resistant) test, we assumed that the price of the tuber-culosis detection test would be similar to that of a sputum smear-replacement test outlined in TPP 1 (US$5) and that the price of the DST would be between US$10 and US$40 (corresponding with a total of US$15–US$45 for tuberculosis detection and DST). Using country-specific notification data and prevalence esti-mates [11], wefirst determined the potential market per country for each of the TPPs for the year 2012 as a base. For each country, the proportion of tuberculosis patients with pulmonary tuber-culosis (PTB), extrapulmonary tubertuber-culosis (EPTB), and children with tuberculosis (assumed to be unable to provide a sputum sample and therefore not included in the number of PTB pa-tients), were estimated separately. Next, the number of prevalent tuberculosis patients in 2012 in each of these categories was
determined, using the World Health Organization’s (WHO) es-timated prevalence data.
To calculate the number of individuals with signs and symp-toms suggestive of tuberculosis that need to be tested tofind all prevalent tuberculosis, we applied a country specific “suspect-to-case” ratio, defined as the number of individuals that is being tested in order tofind 1 tuberculosis case. For each of the countries this ratio was calculated based on PTB cases and was then extrapolated to other non-PTB cases due to lack of infor-mation for the latter. This ratio was either determined based on country specific data on the number of individuals that were screened in 2012 with smear (and/or the Xpert MTB/RIF® assay“Xpert”) as the initial test (South Africa and India) or number of smears done for the initials diagnosis (China and Brazil) and the number of notified PTB cases in 2012 dependent on the availability of data.
Because no novel tests that meets the specification outlined in the TPPs is on the market yet, but tests are anticipated to be-come available within the next 5 years, we estimated the poten-tial market for each of the novel products for the year 2020. The number of prevalent tuberculosis cases in 2020 was estimated based on the 3-year average decline in the tuberculosis preva-lence rate and multiplied by the expected population size in 2020 according to the World Bank [12].
For each TPP, the potential market of the base case scenario represented the most likely use of the test with regard to where in the health-care system it would be implemented and its pur-pose and intended target population (eg, adults and children suspected of PTB, EPTB). In addition, the potential market was determined for alternative scenarios where the test would, for instance:
1. be used on more or less individuals with presumptive tu-berculosis than the current estimate by assuming a lower or higher “suspect-to-case” ratio (applicable for all tests but shown for the smear replacement test);
2. be deployed at a lower level of the health-care system and therefore reach a larger population (applicable for the bio-marker and triage test); or
3. only be able to test a subset of the intended target popu-lation (applicable for the biomarker test or triage test if these would not detect EPTB but only test individuals with presump-tive PTB and children with tuberculosis, such as for instance a breath test); or
4. for the DST detection test, would be done after a more sensitive tuberculosis detection test or be done in a staged ap-proach only after rifampicin resistance is found (eg, after Xpert MTB/RIF testing up-front). The different scenarios of each TPP for which we determined the potential market size and value are explained in Table1. The method we describe and applied for estimating and projecting the potential market size could be used to estimate the potential market in other countries. Market for Novel Tuberculosis Diagnostics
•
JID 2015:211 (Suppl 2)•
S59RESULTS
In 2012 a total of 17 million individuals with presumptive PTB were evaluated for the initial diagnosis of active tuber-culosis using the current tests for detection available (smear
microscopy or Xpert) in the four countries (Table 2). We estimated that approximately 46% of the individual with pre-sumptive PTB were not tested (range between 12% and 57% for the individual countries). Based on the country specific Table 1. Base Case and Alternative Scenarios of the Target Product Profiles (TPPs) for Which the Potential Market is Determined
Scenario Description
TPP1: smear replacement test
Base case Sputum-based smear replacement test, deployed at microscopy centers, used for the initial diagnosis in individuals with presumptive PTB Plus treatment monitoring Sputum-based smear replacement test, deployed at microscopy centers,
used for the initial diagnosis as well as for treatment monitoring in individuals with PTB. Two additional tests were assumed per diagnosed PTB case for treatment monitoring.
Low suspect-to case ratio Sputum-based smear replacement test, deployed at microscopy centers, used for the initial diagnosis in individuals with presumptive PTB. A ‘suspect-to-case’ ratio of 5 was used to estimate the number of individuals tested to find one PTB case instead of the country specific ratio. High suspect-to-case ratio Sputum-based smear replacement test, deployed at microscopy centers,
used for the initial diagnosis in individuals with presumptive PTB. A ‘suspect-to-case’ ratio of 15 was used to estimate the number of individuals tested to find one PTB case instead of the country specific ratio.
TPP2: biomarker test Base case Non-sputum-based biomarker test, deployed at microscopy centers and health-care clinics with a lab attached (equal to a 10% increase compared to deployment at microscopy centers only), used for the initial diagnosis in individuals with presumptive PTB, EPTB or children with tuberculosis. Deployment at health posts Non-sputum-based biomarker test, deployed at health posts (without the
necessity of a lab), used for the initial diagnosis in individuals with presumptive PTB, EPTB or children with tuberculosis. An increase of 20% in the number of individuals that get tested was assumed compared to when this test would only be deployed at microscopy centers. Deployment at microscopy centers,
excluding EPTB testing
Non-sputum-based biomarker test, deployed at microscopy centers and health-care clinics with a lab attached (equal to a 10% increase compared to deployment at microscopy centers only), used for the initial diagnosis in individuals with presumptive PTB or children with tuberculosis. TPP3: triage test Base case Non-sputum-based triage test, deployed at health posts (20% increase in
number of individuals tested compared to use at a microscopy centre), used to rule out tuberculosis in individuals with presumptive PTB, EPTB or children with tuberculosis.
Sputum based test, deployment at health posts
Sputum-based triage test, deployed at health posts (20% increase in number of individuals tested compared to use at a microscopy centre), used to rule out tuberculosis in individuals with presumptive PTB. Non-sputum based test, deployment
at community
Non-sputum-based triage test, deployed at community care (30% increase in number of individuals tested compared to use at a microscopy centre), used to rule out tuberculosis in individuals with presumptive PTB, EPTB or children with tuberculosis.
TPP 4A: tuberculosis detection plus DST upfront
Scenarios are equal to those described for TPP1. This TPP is not shown separately.
Sputum-based tuberculosis detection and DST in one, deployed at microscopy centers, used for the initial diagnosis of PTB and drug susceptibility testing of at least 1 drug in individuals with presumptive PTB. TPP4B: DST after
tuberculosis detection test
Base case, DST after tuberculosis detection
Sputum-based DST, deployed at microscopy centers, used to test for drug susceptibility in individuals who are diagnosed with PTB. An 80% sensitivity was assumed for the diagnosis of PTB.
Increased sensitivity of PTB detection (95%)
Sputum-based DST, deployed at microscopy centers, used to test for drug susceptibility in individuals who are diagnosed with PTB. An increased sensitivity of 95% was assumed for the diagnosis of PTB.
DST detection after detection of RIF resistance
Sputum-based DST, deployed at microscopy centers, used to test for drug susceptibility in individuals who are diagnosed with RIF resistant PTB. A 80% sensitivity was assumed for the diagnosis of PTB. Country-specific prevalence of MDR tuberculosis was used as indicator for RIF resistance prevalence.
Abbreviations: DST, drug susceptibility test; EPTB, extrapulmonary tuberculosis; MDR, multidrug resistant; PTB, pulmonary tuberculosis; RIF, rifampicin.
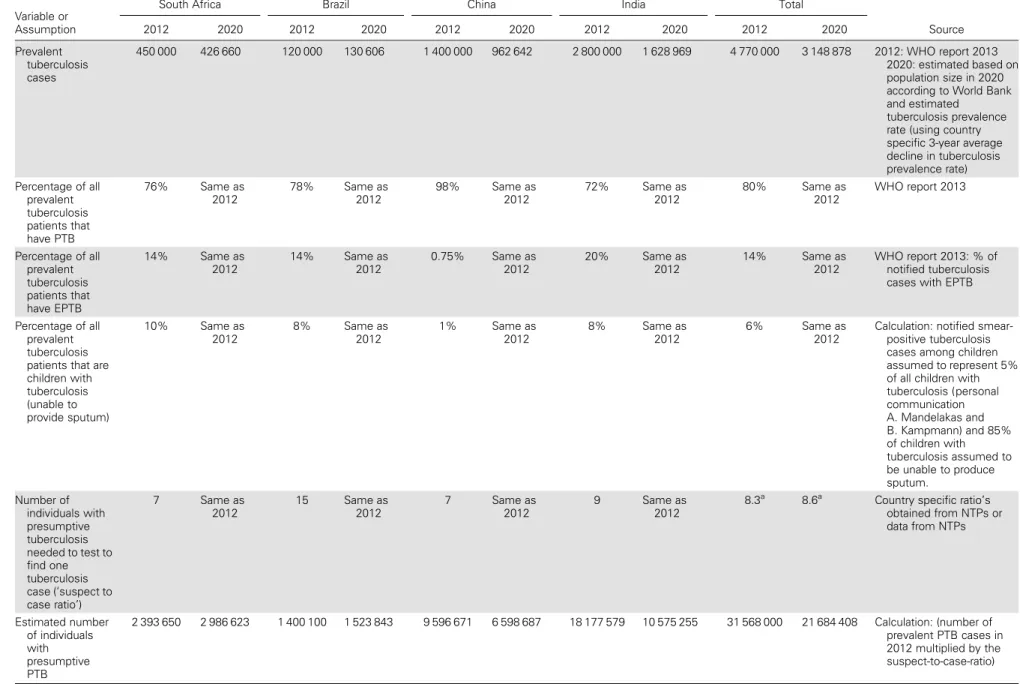
Table 2. Key Variables and Assumptions per Country
Variable or Assumption
South Africa Brazil China India Total
Source 2012 2020 2012 2020 2012 2020 2012 2020 2012 2020 Prevalent tuberculosis cases 450 000 426 660 120 000 130 606 1 400 000 962 642 2 800 000 1 628 969 4 770 000 3 148 878 2012: WHO report 2013 2020: estimated based on population size in 2020 according to World Bank and estimated
tuberculosis prevalence rate (using country specific 3-year average decline in tuberculosis prevalence rate) Percentage of all prevalent tuberculosis patients that have PTB 76% Same as 2012 78% Same as 2012 98% Same as 2012 72% Same as 2012 80% Same as 2012 WHO report 2013 Percentage of all prevalent tuberculosis patients that have EPTB 14% Same as 2012 14% Same as 2012 0.75% Same as 2012 20% Same as 2012 14% Same as 2012 WHO report 2013: % of notified tuberculosis cases with EPTB
Percentage of all prevalent tuberculosis patients that are children with tuberculosis (unable to provide sputum) 10% Same as 2012 8% Same as 2012 1% Same as 2012 8% Same as 2012 6% Same as 2012
Calculation: notified smear-positive tuberculosis cases among children assumed to represent 5% of all children with tuberculosis (personal communication A. Mandelakas and B. Kampmann) and 85% of children with tuberculosis assumed to be unable to produce sputum. Number of individuals with presumptive tuberculosis needed to test to find one tuberculosis case (‘suspect to case ratio’) 7 Same as 2012 15 Same as 2012 7 Same as 2012 9 Same as 2012
8.3a 8.6a Country specific ratio’s
obtained from NTPs or data from NTPs Estimated number of individuals with presumptive PTB 2 393 650 2 986 623 1 400 100 1 523 843 9 596 671 6 598 687 18 177 579 10 575 255 31 568 000 21 684 408 Calculation: (number of prevalent PTB cases in 2012 multiplied by the suspect-to-case-ratio) Mark et for No ve l T uber culosis Diagnos tics
•
JID 2015:211 (Suppl 2)•
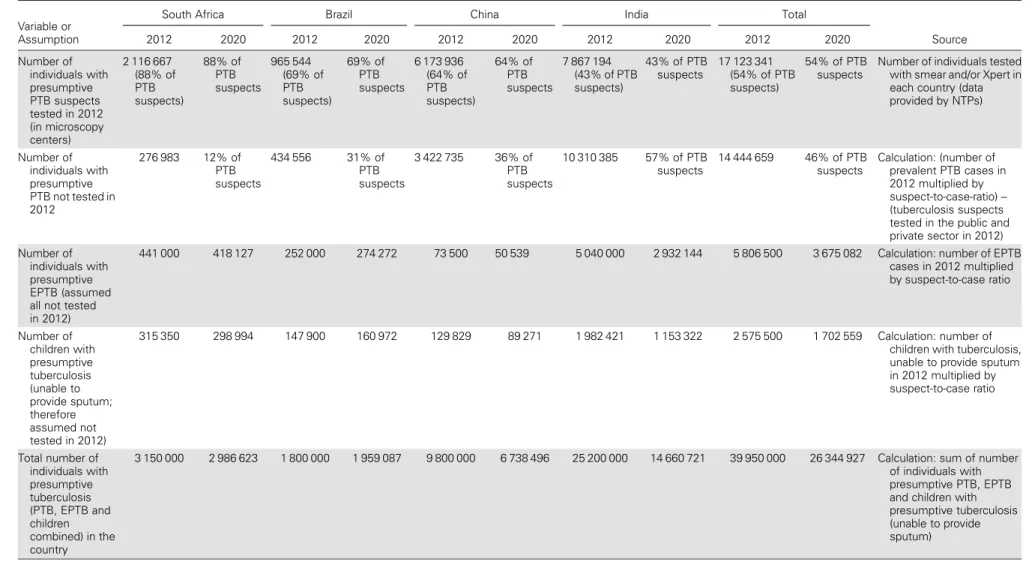
S61Table 2 continued.
Variable or Assumption
South Africa Brazil China India Total
Source 2012 2020 2012 2020 2012 2020 2012 2020 2012 2020 Number of individuals with presumptive PTB suspects tested in 2012 (in microscopy centers) 2 116 667 (88% of PTB suspects) 88% of PTB suspects 965 544 (69% of PTB suspects) 69% of PTB suspects 6 173 936 (64% of PTB suspects) 64% of PTB suspects 7 867 194 (43% of PTB suspects) 43% of PTB suspects 17 123 341 (54% of PTB suspects) 54% of PTB suspects
Number of individuals tested with smear and/or Xpert in each country (data provided by NTPs) Number of individuals with presumptive PTB not tested in 2012 276 983 12% of PTB suspects 434 556 31% of PTB suspects 3 422 735 36% of PTB suspects 10 310 385 57% of PTB suspects 14 444 659 46% of PTB suspects Calculation: (number of prevalent PTB cases in 2012 multiplied by suspect-to-case-ratio)– (tuberculosis suspects tested in the public and private sector in 2012) Number of
individuals with presumptive EPTB (assumed all not tested in 2012)
441 000 418 127 252 000 274 272 73 500 50 539 5 040 000 2 932 144 5 806 500 3 675 082 Calculation: number of EPTB
cases in 2012 multiplied by suspect-to-case ratio Number of children with presumptive tuberculosis (unable to provide sputum; therefore assumed not tested in 2012) 315 350 298 994 147 900 160 972 129 829 89 271 1 982 421 1 153 322 2 575 500 1 702 559 Calculation: number of
children with tuberculosis, unable to provide sputum in 2012 multiplied by suspect-to-case ratio Total number of individuals with presumptive tuberculosis (PTB, EPTB and children combined) in the country
3 150 000 2 986 623 1 800 000 1 959 087 9 800 000 6 738 496 25 200 000 14 660 721 39 950 000 26 344 927 Calculation: sum of number
of individuals with presumptive PTB, EPTB and children with presumptive tuberculosis (unable to provide sputum)
Abbreviations: EPTB, extrapulmonary tuberculosis; NTP, national tuberculosis programmes; PTB, pulmonary tuberculosis; WHO, World Health Organization. a Weighted averages. S62
•
JID 2015:2 11 (Suppl 2)•
Kik et al“suspect-to-case” ratio, which ranged between 7 in South Africa and China up to 15 in Brazil, we estimated that an additional 5.8 million individuals with presumptive EPTB and another 2.6 million children with presumptive sputum-scarce tuberculosis could have been evaluated in these countries in 2012.
The absolute number of prevalent tuberculosis cases is expected to decline in the coming years in all 4 countries be-cause the population growth rate is smaller than the decline in the tuberculosis incidence rate. The total number of prevalent cases in these 4 countries in 2020 was estimated to be around 3.1 million.
Potential Available Market for a Smear Replacement Test in 2020
For a novel smear replacement test with increased sensitivity for the detection of PTB on sputum that can be deployed at micros-copy centers with quick turnaround time, the potential market size in 2020 was estimated at 2.0 million in South Africa, 1.1 million in Brazil, 4.3 million in China, and 4.6 million in
India. This amounts to a total of 12 million tests in that year (Figure1A). If the smear replacement test could also be used
for treatment monitoring and on average 2 additional tests per diagnosed PTB case would be conducted during therapy, the potential market size would grow to 15 million tests per year in all four countries combined. Considering changes in the as-sumed number of individuals that is tested in order tofind one tuberculosis case (eg, lower or higher “suspect-to-case-ratio”) the potential market size would vary between 7.7 million (ratio of 5 in all countries) and 23 million tests (ratio of 15 in all countries). The potential market value for a smear replacement test under the base scenario will range between US$48 million for a US$4 test up to US$71 million for a US$6 test in all 4 coun-tries together (Figure2).
Potential Available Market for a Biomarker Test in 2020 According to its TPP, a novel biomarker test that uses a non-sputum based sample should ideally detect all forms of tubercu-losis and be feasible to conduct at least in microscopy centers or Figure 1. Potential available market (volume) for novel tuberculosis diagnostics in 2020 in 4 example countries. A, Smear replacement test (TPP 1 and TPP 4A). B, Biomarker test (TPP 2). C, Triage test (TPP 3). D, drug susceptibility test (DST) after tuberculosis detection test (TPP 4B). Abbreviations: PTB, pulmonary tuberculosis; RIF, rifampicin; TPP, target product profile.
health-care clinics with some form of a laboratory attached. Due to its wider applicability, both in terms of target population and in the number of facilities where the test can be conducted, the PAM size in 2020 was estimated at 16.1 million tests for all 4 countries (Figure 1B). Obviously, the market size would
in-crease if the test could be deployed at lower levels of the health-care system such as health posts without a laboratory (total estimated at 17.6 million). On the other hand, if the bio-marker test would not be able to diagnose EPTB but would de-tect only PTB and tuberculosis in children, its market size would be reduced by 13% compared to the base scenario (total market size 14 million tests).
The potential market value for a biomarker test, for the base case scenario, will range between US$65 million for a US$4 test and US$97 million for a US$6 test in total in all 4 countries. Potential Available Market for a Triage Test
A non-sputum based triage test that is easy to conduct at health posts that do not have a laboratory attached and be used to rule
out tuberculosis in individuals with presumptive tuberculosis could have a potential market size of 17.6 million tests in the 4 example countries combined (Figure1C). In essence, the
tri-age test is expected to have about 10% larger market size than the biomarker test because the test aims to reach difficult to reach populations that did not have access to tuberculosis test-ing before. Although the potential market size for the TPPs de-scribed here is largest for a triage test, its market value is lowest (range between US$18 and US$35 million in total for all 4 coun-tries under the base scenario) because the optimal price range anticipated is US$1 to US$2 per test.
Potential Available Market for a DST in 2020
For a novel (sputum-based) rapid DST there are 2 possible op-tions. First, the test can combine tuberculosis detection and DST into one step (as in the case of Xpert) and test both for the presence ofMycobacterium tuberculosis as for resistance against at least one anti-tuberculosis drug in the same sample and in the same test run. For such a test, the potential market Figure 2. Potential available market (PAM) (value) for novel tuberculosis diagnostics in 2020 in 4 example countries. PAM in 2020 is presented for the base case TPPs at their 2 price points. TPP1 shows the potential market value in 2020 for a TPP for a smear replacement test, deployed at microscopy centers, used for the initial diagnosis of individuals with presumptive pulmonary tuberculosis, and at a price per test of US$4 and US$6. TPP2 shows the potential market value in 2020 for a TPP for a biomarker based test, deployed at microscopy centers and health-care clinics with a lab, used for the initial diagnosis of individuals with presumptive active tuberculosis (all forms), and at a price per test of US$4 and US$6. TPP3 shows the potential market value in 2020 for a TPP for a community triage test, deployed at health posts, used for the screening of individuals with presumptive active tuberculosis (all forms), and at a price per test of US$1 and US$2. TPP4A shows the potential market value in 2020 for a TPP of a tuberculosis detection and drug susceptibility test (DST) in one, deployed at microscopy centers, used for the detection of drug susceptibility in individuals with pulmonary tuberculosis, and at a price per test of US$5 and US$20 for tuberculosis detection and DST combined. TPP4B shows the potential market value in 2020 for a TPP where the DST is conducted after a positive tuberculosis detection. Both tests are deployed at microscopy centers, used for the detection of drug susceptibility in individuals with pulmonary tuberculosis, and at a price of US$5 per tuberculosis detection test and US$10 or US$40 for the DST is assumed. Abbreviation: TPP, target product profile.
size is equal to that of the smear replacement test (Figure1A),
but because this test may cost slightly more, its potential market value in 2020 in all 4 countries is estimated between US$59 and US$238 million for a US$5 to US$20 test (Figure2).
The second option is that DST only is done after a positive tu-berculosis detection test. In this case, the potential market size for the DST would be much smaller with a total of 252 000 tests in South Africa, 70 000 in Brazil, 606 000 in China, and 616 000 in India (Figure1D; a total of 1.5 million tests). Nevertheless,
the potential market value for both tuberculosis detection at an average price of US$5 per test followed by DST (at least one drug but preferably morefirst-line drugs) at a price range between US$10 and US$40 for DST would amount between US $75 million and US$121 million (Figure2).
DISCUSSION
In this study, we described the PAM in 2020 for 4 novel diagnos-tics that meet the specification outlined in the TPPs described elsewhere in this supplement [4,5]. This PAM was determined both in size and in value for 4 countries (South Africa, Brazil, China, and India) that have a high tuberculosis burden but also are emerging economies that can invest in the implementa-tion and rollout of new, modern technologies that have the po-tential to lead to increased testing and enhanced case detection and which are therefore of interest for test developers.
Product developers need data on issues such as potential global market size, the potential country specific market size, and return on investment, but such information is often lack-ing (D. Dollack-inger, FIND, personal communication) [6]. We showed a general approach for estimating the PAM for novel products when used in their intended target population and at their intended level of the health-care system, which can be adapted for other countries or for other assumptions.
Our results indicate that, of the 4 TPPs, the greatest PAM in terms of value would be for a (sputum-based) tuberculosis de-tection and DST upfront test although this is mainly a result of the high cost per test that we assumed (up to US$20). Such a test, essentially, would be a more sensitive “Xpert”-like test that not only tests for the presence ofM. tuberculosis and rifam-picin resistance but also resistance against additional drugs. Al-though the potential market looks promising, it is questionable if such a test would be affordable for all countries at this price point [10]. Cost-effectiveness studies on an individual country level are recommended which can take the local epidemiology (eg, prevalence of MDR-tuberculosis) and current testing algo-rithms in place into account to assess which test strategies are most effective and least costly. Tests that can be deployed at lower levels of the health-care system and which could be used for the detection (or rule-out) of all forms of tuberculosis, such as a biomarker test or a triage test would have the largest potential market volume. And a triage test algorithm might
even be cost-effective even at an even higher price point than what we have used here [13].
In this study, we determined the total PAM for novel tests under the assumption that these would be implemented through-out the whole country and cover 100% of the intended health-care facilities. When different products will reach the market thatfit within the same TPP, obviously these products would compete for a share of the same potential available market. Prod-ucts that meet more of the criteria listed under the“optimal” sce-nario of the TPPs might account for a larger market share.
In addition, there is interplay between the different TPPs. Al-though the tuberculosis community has expressed a need for each of the TPPs, and there will be a market for each of them, there is potential overlap in the target populations of some of the tests. Although a triage test and rapid DST are unlikely to compete, a biomarker test for instance will likely replace a smear-replacement test. As a result, there may not only be com-petition for products thatfit the same TPP, but competition could also occur between products that meet different TPPs. The time that novel products will enter the market, the strength of evidence on the test, the recommended use by national and international guidelines of these products in global or local di-agnostics algorithms, but also the local epidemiology and pref-erences will therefore greatly determine the actual market size and penetration.
Several limitations should be taken into consideration when interpreting our results. First, one of the main assumptions in our analysis was the country-specific “suspect-to-case” ratio. Upon changes in this ratio either to a higher or lower number the estimated market size and consequently its volume fluctuat-ed considerably (−35% or +96% when all 4 countries were com-bined). Although we determined country specific ratios, these were based on the number of individuals with presumptive PTB tested in order tofind one PTB case and were assumed to be equal for EPTB and children with tuberculosis (unable to provide sputum), which might not be true. Moreover, we as-sumed that this ratio would remain constant and not change when tests would be applied at lower levels of the health-care system, while in fact this ratio is likely to increase over time when the prevalence decreases.
In our estimates we used the prevalence estimates according to the WHO. Although these estimates are yearly updated and refined, there is uncertainty around the precise prevalence rates and therefore also the estimates that we presented here for the potential market size for novel test.
Another limitation is that we assumed that an additional 10%, 20%, and even 30% of individuals would get tested when a test would be conducted in health-care clinics with a lab attached, health posts, or in the community besides its use in microscopy centers. Although we did not have accurate data to underpin this assumption, a study conducted by Girosi and Olmsted et al in 2006 estimated that up to 25% of the Market for Novel Tuberculosis Diagnostics
•
JID 2015:211 (Suppl 2)•
S65population in Africa had access to facilities with no infrastruc-ture, 47% to infrastructure with minimal infrastrucinfrastruc-ture, and 28% to facilities with moderate to advanced infrastructure [14,15]. Finally, there is uncertainty around the prices of novel tests. The prices used in our calculations should be con-sidered purely indicative as it is hard to predict real prices (which are based on donor investments, special pricing and ac-cess agreements, volume-based discounts, etc.).
By 2020, it is highly like that new tuberculosis drug regimens will be available. Because newer drug regimens are critically de-pendent on companion diagnostics for scale-up, there are ongo-ing efforts to achieve convergence between diagnostics and new drug regimens [16]. The introduction of newer regimens is not expected to affect the PAM estimates outlined here, unless these will affect current testing practices and for instance lead to an increase in testing during treatment.
In conclusion, we showed that there is a great PAM in the 4 example high-burden countries for novel diagnostics such as a smear replacement test, a biomarker test, a triage test, and DST when these would meet the specifications outlined in the TPPs. Notes
Financial support. This work was supported by UK aid from the UK government to FIND and by grants from the Bill and Melinda Gates Foun-dation, grant OPP1018924 to FIND, and grant OPP1061487 to McGill University. C. M. D. was supported during her time at McGill University by a fellowship of the Burroughs–Wellcome Fund from the American So-ciety of Tropical Medicine and Hygiene. The funders had no role in the analysis of data and decision to publish.
Potential conflicts of interest. No financial or industry conflicts. C. M. D. is employed by FIND, a nonprofit organization that collaborates with industry partners, including Cepheid and Hain diagnostics among oth-ers, for the development, evaluation, and demonstration of new diagnostic tests for poverty-related diseases. M. P. serves as a consultant to the Bill and Melinda Gates Foundation, and on the Scientific Advisory Committee of FIND, Geneva. He has received grant funding from BMGF (OPP1061487) to develop target product profiles for new tuberculosis diagnostics, and to conduct market analyses around existing and new tuberculosis diagnostics. All other authors report no potential conflicts.
All authors have submitted the ICMJE Form for Disclosure of Potential Conflicts of Interest. Conflicts that the editors consider relevant to the con-tent of the manuscript have been disclosed.
References
1. World Health Organization. WHA approves Post-2015 Global TB Strat-egy and Targets. Geneva 19 May2014.http://who.int/tb/features_archive/ globaltb_strategy/en/. Accessed 20 October 2014.
2. Dowdy DW, Houben R, Cohen T, et al. Impact and cost-effectiveness of current and future tuberculosis diagnostics: the contribution of model-ling. Int J Tuberc Lung Dis2014; 18:1012–8.
3. Kik SV, Denkinger CM, Casenghi M, Vadnais C, Pai M. Tuberculosis diagnostics: which target product profiles should be prioritised? Eur Respir J2014; 44:537–40.
4. Denkinger CM, Kik SV, Cirillo DM, et al. Defining the needs for next generation assays for tuberculosis. J Infect Dis2015; 211(suppl 2): S29–38.
5. World Health Organization. Meeting report. High-priority target product profiles for new tuberculosis diagnostics: report of a consensus meeting. 28-29 April 2014. Geneva, Switzerland,2014.http://apps.who.int/iris/ bitstream/10665/135617/1/WHO_HTM_TB_2014.18_eng.pdf?ua=1. Accessed 24 October 2014.
6. Pai M. Diagnostics for tuberculosis: what test developers want to know. Expert Rev Mol Diagn2013; 13:311–4.
7. TB Diagnostics Market Analysis Consortium. Market assessment of tuberculosis diagnostics in Brazil in 2012. PloS One2014; 9:e104105. 8. Special Programme for Research & Training in Tropical Diseases (TDR)
and Foundation for Innovative New Diagnostics (FIND). Diagnostics for tuberculosis. Global demand and market potential. Geneva: World Health Organization,2006:1–203.
9. TB Diagnostics Market Analysis Consortium. Market Assessment of Tuberculosis Diagnostics in South Africa in 2012–2013. Int J Tuberc Lung Dis2015; 19(2):216–22.
10. Pantoja A, Kik SV, Denkinger CM. Costs of novel TB diagnostics—will countries be able to afford it? J Infect Dis2015; 211(suppl 2):S67–77. 11. World Health Organization. Global Tuberculosis Report 2013: WHO
report 2013. Geneva: WHO,2013:1–289.
12. Worldbank. Data from database: Health Nutrition and Population Statistics: Population estimates and projections.http://data.worldbank. org/indicator/SP.POP.TOTL. Accessed 26 September 2014.
13. van’t Hoog AH, Cobelens F, Vassall A, et al. Optimal triage test charac-teristics to improve the cost-effectiveness of the Xpert MTB/RIF assay for TB diagnosis: a decision analysis. PloS One2013; 8:e82786. 14. Girosi F, Olmsted SS, Keeler E, et al. Developing and interpreting
models to improve diagnostics in developing countries. Nature2006; 444(suppl 1):3–8.
15. Olmsted SS, Petkin Derose K, Beighley C. Determining access to care and user requirements for diagnostic tests in developing countries. Working paper. Nature2006; S1:3–8, supportive material.
16. Wells WA, Boehme CC, Cobelens FG, et al. Alignment of new tubercu-losis drug regimens and drug susceptibility testing: a framework for action. Lancet Infect Dis2013; 13:449–58.