www.elsevier.com / locate / cardiores
21
Real time, confocal imaging of Ca
waves in arterially perfused rat
hearts
*
¨
´
´
Andreas P. Baader, Lorenz Buchler, Lilly Bircher-Lehmann, Andre G. Kleber
¨
University of Bern, Department of Physiology, Buhlplatz 5, 3012 Bern, Switzerland Received 1 February 2001; accepted 30 July 2001
Abstract
21
Objective: The aim of this study was to characterize the spatio-temporal dynamics of slow Ca waves (SCW’s) with cellular resolution in the arterially-perfused rat heart. Methods: Wister rat hearts were Langendorff-perfused with Tyrode solution containing
21
bovine-albumine and Dextran. The heart was loaded with the Ca sensitive dye Fluo-3 AM. Intracellular fluorescence changes reflecting
21
changes in [Ca ] were recorded from subepicardial tissue layers using a slit hole confocal microscope with an image intensified videoi camera system at image rates of up to 50 / s. Results: SCW’s appeared spontaneously during cardiac rest or after trains of electrical stimuli. They were initiated preferentially in the center third of the cell and propagated to the cell borders, suggesting a relation between
21 21
the cell nucleus and wave initiation. They were suppressed by Ca transients and their probability of occurrence increased with the Ca
21
resting level. Propagation velocity within myocytes (40 to 180 mm / s) decreased with the resting Ca level. Intercellular propagation was mostly confined to two or three cells and occurred bi-directionally. Intercellular unidirectional conduction block and facilitation of SCW’s was occasionally observed. On average 10 to 20% of cells showed non-synchronized simultaneous SCW’s within a given area in the
21
myocardium. Conclusions: SCW’s occurring at increased levels of [Ca ] in normoxic or ischemic conditions are mostly confined toi
two or three cells in the ventricular myocardium. Spatio-temporal summation of changes in membrane potential caused by individual SCW’s may underlie the generation of triggered electrical ectopic impulses. 2001 Published by Elsevier Science B.V.
Keywords: Arrhythmia (mechanisms), Calcium (cellular), Conduction system, Signal transduction
21
1. Introduction reactivation of L-type Ca currents during a prolonged
duration of the action potential plateau (early afterdepolari-21
zations, EAD’s) and as the result of electrogenic extrusion Changes of cytoplasmic [Ca ] during the cardiac cycle
21 21
of Ca via the Na / Ca exchanger after repolarization of are characterized by a complex interplay of Ca entering
21
the action potential (delayed afterdepolarizations, DAD’s). from the extracellular space, Ca released from the
21 21 21
intracellular stores, Ca pumped into intracellular stores, Additionally, Ca bound to Troponin C can induce Ca 21
and Ca transferred from the cytoplasm to the extracellu- transients in the case of rapid force changes [1]. While lar space. Since some of these processes induce changes in these events necessitate coordinated action of many transmembrane voltage by affecting transmembrane ionic myocytes to produce a source for electrical excitation,
21 21
channels and transporters, fluctuations in intracellular Ca Ca changes in the cytoplasm have been reported to can contribute to repetitive depolarizations, and conse- occur in discrete entities that appear to relate to the special quently, to arrhythmias. Thus, oscillations of transmem- compartment structure of the SR. The overall increase of
21
brane potential have been reported as a consequence of cytoplasmic Ca during a contraction cycle then results from the independent and discrete summation of local
21
Ca releases (sparks). When reaching a critical cellular
*Corresponding author. Tel.: 141-31-631-8740; fax: 141-31-631- 21
cytoplasmic [Ca ] of about 500 nM [2], local sparks can
8785.
E-mail addresses: [email protected] (A.P. Baader), ´
[email protected] (A.G. Kleber). Time for primary review 29 days. 0008-6363 / 01 / $ – see front matter 2001 Published by Elsevier Science B.V.
21
turn into propagating waves. Analysis of Ca waves, and myocytes of the whole heart over a relatively large area of especially their propagation and co-ordination within and cardiac tissue.
among cells is important for our understanding of initiation of arrhythmias. It was not until recently that the first
21
studies described Ca waves in multicellular cardiac 2. Methods
muscle preparations [3–6]. In trabeculae muscles,
prop-agating waves were found to originate from mechanically The investigation conforms with the Guide for the Care damaged muscle fiber regions [7–9]. These waves could and Use of Laboratory Animals published by the US
travel into undamaged myocardium areas to cause trig- National Institutes of Health (NIH Publication no. 85-23, gered propagated contractions (TCP’s) of the sarcomeres. revised 1996).
But the probability that this intercellular propagation
occurred was found to be rather low [10]. Spontaneous 2.1. Langendorff hearts and experimental setup 21
Ca oscillations were also reported in whole rat hearts.
Minamikawa et al. [5] described multifocal waves, the After anesthesia 3–6-day-old Wister rats were decapi-21
activity of which increased with Ca overload and which tated. The excised hearts (weight: 40–60 mg) were brought had propagation velocities of 60–100 mm / s. Hama et al. to a Langendorff-chamber. Time from excision to cannula-[11] gave a qualitative description of wave propagation in tion was less than 5 min. In the perfusion chamber the ventricular myocytes. Most recently, the interactions be- heart was equilibrated with perfusion solution containing
21 21
tween Ca waves and transients and the intra- and Tyrode solution with 1.8 mM Ca , bovine-albumine (2 21
intercellular propagation characteristics of Ca waves g / l) and Dextran (40 g / l) [14]. The preparations were were studied in perfused rat hearts (Kaneko et al. [12]) and stimulated at 2 Hz by means of two platinum wires (20
in Purkinje cells [13]. mm diameter) inserted into the ventricular myocardium.
In the present study, we investigated the occurrence of Temperature inside the chamber was set to 35–378C. A 21
slow Ca waves (SCW’s) in arterially-perfused whole rat subsequent equilibration period of 30 min allowed the 21
hearts in dependence of different cytosolic Ca . The aim heart to recover and to adjust constant pressure and was to provide a detailed intracellular characterization of temperature conditions in the chamber.
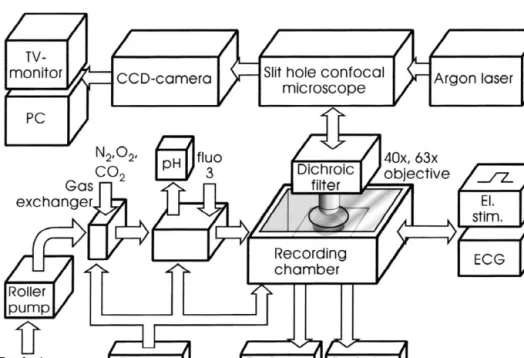
the temporal and spatial dynamics of SCW’s. A slit hole The perfusion system has been described previously in confocal imaging system was used for real time acquisition detail [15]. In brief, it consisted of a roller pump, a silicone
21
of intracellular Ca changes that had both a high sen- membrane gas exchanger and a Perspex recording chamber sitivity and a high speed of up to one frame every 20 ms. (Fig. 1). The roller pump generated a sustained perfusion
21
This allowed us to investigate Ca fluctuations in pressure of 40 to 55 mm Hg. N -, CO - and O -levels in2 2 2
21
Fig. 1. Experimental setup for the recording of myocardial Ca fluctuations in rat hearts. The Langendorff-perfused heart is positioned left ventricle up in a sealed recording chamber under constant temperature and full H O saturation conditions. It is paced electrically (El. Stim.) by means of platinum wires2
21
inserted into the left ventricle. The Ca sensitive dye Fluo-3 AM is loaded into the myocardium through the perfusion system. Fluorescence excitation of Fluo-3 dye is provided by a 488-nm Argon laser and recorded through a slit hole confocal microscope by an image-intensified video camera system.
the solution and in the surrounding H O-saturated atmos-2 image intensifier was routinely adjusted at the beginning of 21 phere of the chamber were adjusted to maintain an oxygen each experiment so that electrically induced Ca -trans-concentration of $99% and a pH of 7.4. In the perfusion ient-peaks produced non-saturated pixel values. During chamber, the heart was mounted on a wax platform with image acquisition the laser beam continuously illuminated the left ventricle up. A 150 mm thick glass cover slip was recording the preparation. Interlaced video images were mounted in a 30 mm wide circular opening in the lid, acquired in series of up to 80 frames using the video directly above the heart gently depressing the myocardial grabbing board and / or were recorded continuously on surface. It sealed the recording chamber completely and videotape. During these (up to 3.2 s) recording periods no
prevented excessive movements. bleaching of signals were observed. With recording times
Neonatal rat hearts were chosen because loading of the $5 s bleaching produced a gradual reduction in fluores-21
myocytes with Ca -sensitive dyes via arterial perfusion cence intensity (see Fig. 2). Largest recorded regions of was faster and provided more homogenous staining than interest (ROI’s) were 150–2503235 mm with the 403 adult rat hearts. Neonatal hearts differ from adult myocar- objective and 100–1503150 mm with the 633 objective, dium by a somewhat different cellular structure with a and depended on the deflection amplitude of the oscillating smaller density and a less regular organization of cells. mirror in the confocal microscope. From these images, Although the distribution of some membrane channels was sub-ROI’s were off-line selected for analysis using NIH
21
also found to be different [16,17], the major ion channels Image software. Ca -induced fluorescence changes were and gap junctions present in adult hearts are fully ex- calculated from image series. Background fluorescence pressed, and neonatal myocytes show a stable intracellular (Fback) was determined from a 144-pixel-area within the
21
Ca concentration between P1 (postnatal day 1) and P7 recording region where no myocyte was discerned. Non-21
[17]. The hearts beat in normal sinus rhythm and can be ratiometric estimation of Ca changes was expressed overdriven by ventricular stimulation. either as arbitrary units (a.u.), derived directly from the As another morphological characteristic neonatal rat 8-bit gray level contents of the images after subtraction of myocytes are predominantly mononucleic while adult the background fluorescence, or as ratio with F /F 50 myocytes have two nuclei per cell. We stained neonatal (FmaxFback) /(Fbase2 Fback) or DF /F 5 (FmaxFbase) / ventricles with eosine and glutaraldehyde, and found (FbaseFback) [19]. Fmax is the peak fluorescence of the
21
virtually no binucleate cells at P3 and a very low propor- Ca -mediated signal and Fbaserepresents the fluorescence tion of binucleate myocytes in P6-ventricles, the oldest level of the myocyte during rest. For the calculation of the
21
postnatal state used in our experiments. We also found that velocities of individual Ca waves a look-up table (LUT) all nuclei were consistently located within the center third of 12 colours representing levels of F /F0 was applied. portion of the cells. These results are in agreement with Conduction velocity was evaluated from the spatial pro-previous morphometric studies [18], which report 2.94, gression of the intensity values in the steepest part of the 15.16 and 50.6% binucleate myocytes in left ventricular wave front. Cell borders were determined from off-line myocardium of P1, P5 and P11 postnatal rat hearts, averaged series of images.
respectively.
21
2.2. Confocal Ca imaging 2.3. Experimental procedure
21
The whole chamber assembly was positioned on a During loading of the myocardium with Ca -sensitive movable stage under an upright slit detector confocal fluorescent dye (fluo 3-AM, Teflabs, 4 mmoles / l in 20 ml microscope (Meridian Insight). Imaging was performed at perfusate), the temperature of the chamber and of the 403 (water immersion, C-Apochromat, NA1.2, Zeiss) and perfusion solution was lowered to 7–108C. Depending on 633 (oil immersion, Plan-Neofluar, NA1.25, Zeiss) magni- the flow rate cold loading lasted for 30 to 40 min. fication. With the 403 objective confocal imaging pro- Afterwards, the hearts were perfused with dye-free solu-vided a sharp image in a depth of 61.5 mm around the tion at 35–378C. In most experiments it was possible to focal plane. A CCD video camera with GEN II – image obtain mechanically stable recordings. In 14 of the 29 intensifier (MXRI, Adimex Image Systems) recorded experiments excessive contractions interfered with the interlaced 8 bit images at a frequency of 25 frames / s and a optical recordings. In these cases 2,3-butanedione monox-size of 6043575 pixels. By de-interlacing the video ime (BDM, 20 mM) was added to the solution to minimize sequences off-line frame rates of 50 frames / s could be contractions.
achieved. Video images were acquired with a Matrox SCW’s appeared spontaneously in electrically quiescent Pulsar grabbing board on a Pentium II computer at a preparations or they were induced after bursts of rapid
21 transfer rate of #60 MB / s. Images could be acquired stimuli. These trains modified cytosolic free [Ca ]. A
21
down to a depth of 150 mm from the surface of the gradual increase of cytosolic resting [Ca ] levels was also myocardium before blurring occurred. A laser power of observed during extended recording periods of up to 1 h. 80% of the maximum output (nominally 500 mW) was Therefore, this method was used to investigate the
relation-21
21
when SCW’s were measured rapid Ca transients reflect- indicated by the white circle. Peak intensity values of 21
ing the cytosolic Ca increase during normal electrical F /F 51.2 to 1.5 were reached after 100–200 ms and0 excitation were observed. This excluded electrical conduc- decayed during the subsequent 400 ms with a half decay
21
tion block due to Ca -induced cell-to-cell uncoupling time of 110 ms. These intensities were typical for the
during the occurrence of SCW’s. majority of SCW’s observed under normoxic conditions
(see also Fig. 2). The mean propagation velocity of this wave was 130 mm / s. A detailed spatio-temporal
dis-3. Results tribution of such a wave within a myocyte is shown in Fig.
3B. The first phase started with a circumscribed rise in 21
3.1. Calcium signals in ventricular myocytes Ca near the center of the cell. This local spot increased in size for about 40 ms until it reached a certain con-21
Two distinct types of Ca fluctuations were observed: centration level. In a second phase, two wave fronts (gray 21
(1) Ca transients that appeared synchronized across the arrow lines in Fig. 3B) emerged from this central site to whole muscle tissue at the available time resolution and the periphery while further increasing in intensity. When that followed electrical excitation, and (2) local waves, the two centrifugal waves were at their highest intensity,
21
which propagated within and / or between myocytes (slow the Ca concentration at the site of origin of the wave 21
Ca waves, SCW’s). In Fig. 2 fluorescence changes in a began to decrease. The third phase was characterized by a 21
small cardiac area from a typical experiment are depicted. general Ca decrease throughout the whole cell. Although 21
The pseudo color images of the upper panel show three in this example propagation of Ca into neighboring cells myocytes in the focal plane labeled as green to red areas at the same focal plane was not observed, it can not be
21
and confined by dashed lines. They are separated by cells ruled out that Ca spread occurred into cell layers above 21
not fully in the focal plane and by extracellular clefts (blue or below. A secondary small central Ca increase was areas). Mean intensity changes (F /F ) were recorded from0 visible after some 200 ms at the site of origin of the wave a circular 144-pixel-ROI (18 mm diameter, white circle in (black arrow), which however did not develop into a the upper left image). Within the first 6 s of this recording, second wave. While in our experiments most of the
21
the heart was burst-paced at 2.3 Hz. Ca transients observed SCW’s (79.1%, 43 observations) originated in or appeared synchronized over the entire muscle tissue. The near the center third of the cell, others could also start in recovery time course (the time at 50% maximum am- the cell periphery (see also Ref. [10]).
plitude) was 210685 ms (n 595), and longer than the
21 21
inter-stimulus interval, and consequently, the Ca level 3.2. Dynamics common to slow Ca waves
remained elevated throughout the stimulation period. After 21
termination of the electrical burst, resting Ca level As shown in Fig. 2, SCW’s always appeared in periods 21
decreased but remained still higher than before burst between Ca transients, and preferentially, after multiple 21
stimulation. This gave raise to a first and second sponta- transients induced by burst pacing. Ca transients sup-21
neous Ca transient after t 59.3 and 11.2 s. At t 513 s an pressed ongoing slow wave activity completely, no matter SCW developed, followed by additional SCW’s and occa- whether they had been electrically induced or occurred
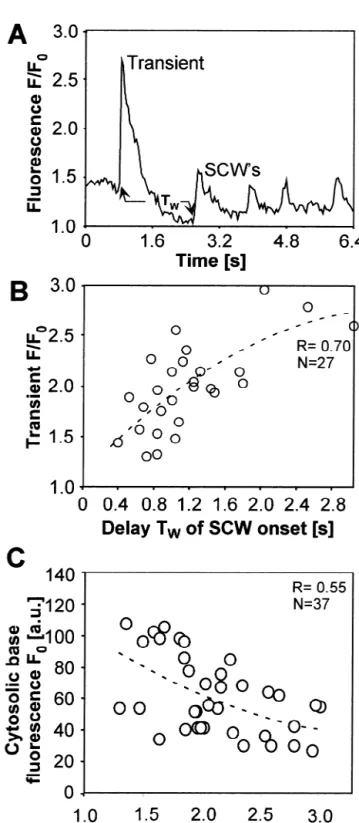
21
sional Ca transients. During this long period of laser spontaneously. As illustrated in Fig. 4A, the delay TW stimulation (24 s) the average baseline fluorescence gradu- between a transient and the first SCW in a given myocyte
21 ally decreased as a consequence of dye bleaching. depended on the amplitude of the preceding Ca
tran-Spontaneous SCW’s in the myocytes appeared as local sient. The higher its amplitude the longer was the time spots before their wave fronts propagated to the periphery interval TW until the first slow wave was observed (Fig. (Fig. 3A). The values of the temporal dynamics of the 4B). The regression of measurements in 27 myocytes from 21 wave in this figure were acquired from the round ROI 15 experiments was R50.70. In general, resting Ca
21
Fig. 2. Electrically induced and spontaneous Ca fluctuations in myocytes of a perfused P6-rat-heart. Fluorescence changes (F /F ) were calculated from0
video images taken every 40 ms during 25 s. Selected pseudo color images are shown at the times indicated. Dashed lines surround three myocytes in the focal plane. Measurements were taken from one cell at a 144-pixel-ROI (white circle in upper left image). During the first 6 s the preparation was
21
stimulated electrically at 2 Hz (see stimulation pattern in bottom trace), resulting in brief Ca transients. After termination of the electrical stimulation two
21 21
spontaneous Ca transients (at t 59.3 and 11.2 s) appeared, followed by a series of lower amplitude Ca waves and another transient. The course of one
21
such slow Ca wave is shown in detail in the lower continuous image sequence. No BDM was used in this experiment.
21
Fig. 3. Intracellular propagation characteristics of single slow Ca waves. (A) Propagation of a wave within a single ventricular myocyte (outlined by the orange dotted line). Pseudo color images of 14 consecutive frames, every 40 ms. The local fluorescence changes in this cell were measured at the point indicated by a white circle and their average intensity values during six waves are plotted in the graph below. (B) Typical phases of wave propagation within another myocyte (m, outlined by the orange dotted line). Intensity changes were measured simultaneously every 20 ms at 15 non-overlapping
21 21
174-pixel-ROI’s along the longitudinal midline of the cell. A central local Ca increase is followed by a Ca spread towards the peripheral membrane
21
increased gradually after a perfusion period of 30 min. During this gradual transition from normal to elevated
21
resting Ca the dynamics of SCW’s and the transients followed the relationships shown in Fig. 4C in that the
21
amplitude of Ca transients was inversely related to the 21
resting Ca level (R50.55, 37 myocytes). Therefore, 21
myocytes with low resting Ca and consequently, high 21
amplitude Ca transients were more effective in suppres-21
sing SCW’s than low amplitude Ca transients. 21
With increasing resting Ca the slow waves became smaller in amplitude and eventually disappeared. Analysis of the velocity of SCW’s revealed an inverse relationship
21
between resting Ca levels and propagation speed (R5 0.72, N 533, Fig. 5), a finding that contradicts previous reports (see Discussion).
21
3.3. Propagation of Ca waves between myocytes
In the majority of the observations, SCW’s were con-fined to individual myocytes. The waves often reached the cell borders at high intensity values before they vanished. This observation suggested collision with cell borders without propagation into neighboring cells. In many cases however, an SCW crossed the cell border and propagated into a neighboring myocyte. This propagation could as-sume various characteristics. In the example in Fig. 6 a series of sequential images depicts two myocytes (outlined by the dashed orange lines). During the first 120 ms, an SCW was generated in the left cell (frames[1–3) while
21
no visible Ca changes were detected in the right cell. In frame [4, the SCW crossed the cell border from left to right, leading to a SCW in the other myocyte (arrow in frame [4). Both waves then gradually vanished (frames
21
Fig. 4. The amplitude of Ca transients affects the onset of subsequent
21 21
slow Ca waves and changes with the cytosolic Ca load. (A) Example
21
of a single Ca transient followed by slow local waves. Arrows indicate time points used to determine the delay TWbetween the transient and the first subsequent appearance of a slow wave. (B) TWincreases with the
21
amplitude (labeled ‘Transient F /F ’) of the previous Ca0 transient. This
21 21
Ca transient amplitude in turn decreases with an increase in the mean Fig. 5. Velocity of intracellular slow Ca waves as a function of
21 21
cardiac Ca load at rest (C). A 2nd order polynomial fit was used in B cytosolic Ca load. In 33 cells the wave speed tended to increase with a
21
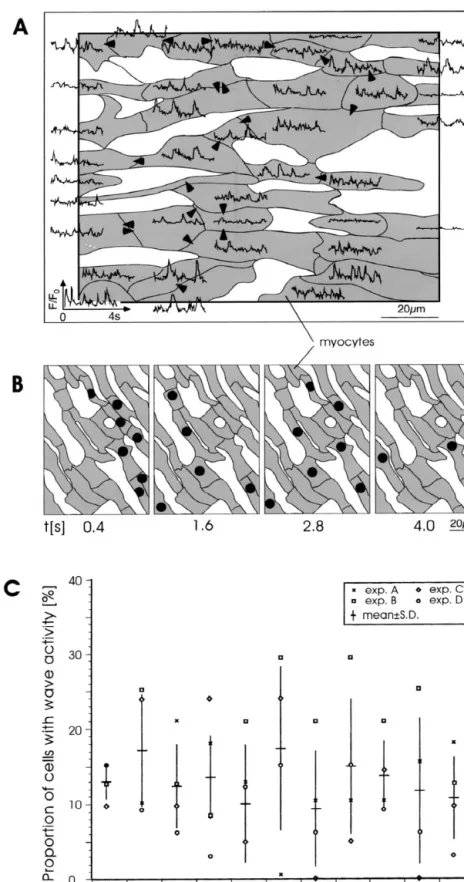
[7–12). Subsequently, a second smaller wave in the left s-period. The black dots in Panel B denote the cells 21
cell (frames[13–19) did not reach the crossing point and producing Ca waves at the given time interval during the 21
hence did not induce Ca changes in the right cell. period. Panel C illustrates the results of four experiments Interestingly, an SCW in the right cell (frames[16–23) with areas containing at average 3166 myocytes. Between reached the contact point with high intensity (see arrow in 10 and 20% of cells produced SCW’s at each determined frame [18) but did not propagate into the left cell. Thus, instant within the recorded area of 1503120 mm.
21
Ca spread from a first into a second cell was not always followed by a spread in the opposite direction (unidirec-tional block).
4. Discussion
21
4.1. Relationship between Ca transients and SCW’s 21
3.4. Rhythmicity of slow Ca waves
Slow Ca waves (SCW’s) were consistently observed In most cases, SCW’s were generated at random
wave-after bursts of electrical stimulation. During normal
stimu-to-wave intervals. However, distinct waves were
occasion-lation rates SCW’s were only observed in ischemic con-ally recorded with a high degree of rhythmicity. This
ditions (not shown). This indicates that normal electrical rhythmicity was always confined to one cell and apparently
excitation suppressed SCW’s and that, in general, the did not correspond to any activity in other cells nor was
appearance of SCW’s was associated with an elevation of there ever any propagation into neighboring cells observed. 21
cytosolic Ca . Thus, our results are in accordance with 21
The cell shown in Fig. 7A and B produced regular Ca
previous studies describing the relation between cytosolic
waves every 38069 ms (mean6S.D.). Fig. 7C shows a 21
Ca and propagating cytosolic SCW’s [5,12]. The time
plot of the frequency of such highly rhythmic slow waves 21
interval between the last stimulated Ca transient and the in 12 different preparations versus the cytosolic diastolic
first appearance of a SCW was dependent on the resting 21
Ca level of the respective myocytes. Interestingly, there 21
Ca level. A similar result was described in a recent study was no correlation between frequency of this wave type
using freshly isolated guinea-pig myocytes [21] that 21
and the Ca loading. 21
showed that global Ca transients lead to cytosolic
21 21
suppression of local Ca events. It was found that Ca release from SR stores was required to induce this suppres-21
3.5. Spatio-temporal occurrence of slow Ca waves in
sion. The duration of the suppression was reduced with an
the cellular network 21 21
elevation of [Ca ] and with an increase in Cai SR contents (E. Niggli, personal communication).
SCW’s lead to changes in transmembrane potential, that are supposed to trigger new propagated action potentials
[20]. An arrhythmogenic effect of such local waves could 4.2. Intracellular initiation and propagation of SCW’s be the consequence of both an increased local wave
21
frequency and of the spatial frequency. The spatio-tempo- In our experiments, the majority of Ca waves origi-21
ral occurrence of slow Ca waves within an area of nated intracellularly in an area corresponding to the center 1503120 mm is shown in Fig. 8. Within such a small third of the cells and subsequently traveled to the periphery region spatial electronic interaction of the changes in (Fig. 3). It was proposed that the initiation of SCW’s is a transmembrane potential induced by SCW’s is likely to consequence of a restricted, localized summation of
in-21
occur (see Discussion). Panel A shows the temporal dividual Ca sparks that reach a critical concentration 21 occurrence of SCW’s in one such limited area containing level [2,4,22] and induce a propagated regenerative Ca 39 myocytes during an interval of 4 s. The arrows indicate response. In our experiments, the location of the cell intercellular propagation of SCW’s observed during the nucleus could explain a central initiation site. An
inter-21 21
whole interval. In order to define the potential effect of action between cytosolic Ca and nuclear Ca has 21 temporal summation, the simultaneous occurrence of recently been reported in isolated myocytes [23]. The Ca SCW’s was assessed in 400 ms intervals during the 4 sparks per se, which were occasionally observed at the
21
Fig. 6. Intercellular uni-directional propagation of Ca waves. Frame-by-frame recording (every 40 ms) of several myocytes (outlined by the black dotted lines). The last frame shows the average intensity distribution during this sequence. The wave front in the left cell (a) reaches the cell border, leading to a
21
sudden Ca increase in the right cell (b, arrow in frame[4). At the same contact point, a subsequent wave in the right cell does not spread into the left
cell (arrow in frame[18). C5capillary. 21
Fig. 7. A. Ca induced fluorescence changes recorded from the middle cell at the ROI indicated by a white field. B. Rhythmic pulsatory waves were observed as their wave fronts passed through the ROI shown in A. The wave pulse frequencies were in the range of 1–4.5 Hz, and were found to be
21
21 21
Fig. 8. Spatial distribution of Ca waves. A. Reconstruction of a simultaneous recording of Ca waves from a 1203150 mm ventricular segment during 4 s. Arrows indicate intercellular communication at any point during the 4 s-period. B. Four 400 ms-frames recorded every 1.2 s in another preparation. Black dots indicate the number of waves observed during the 400 ms-window in the respective myocytes. C. Percentage of myocytes exhibiting
21
limit of detection with our method (A. Baader, personal exhibiting SCW’s and, probably DAD’s, will be elec-communication), occurred anywhere in the cytosol. trotonically influenced by neighboring cells. As in another The intracellular propagation velocity of SCW’s in our initiation of focal mechanisms, a minimal amount of tissue experiments was in the range of 50 to 180 mm / s. This is in needs to be activated in a coordinated manner for an agreement with previous studies that reported values of excitatory effect [29]. As a major goal of this study, we about 100 mm / s [5,12,24]. Although in our experiments therefore investigated the spatio-temporal interaction the probability of SCW initiation increased with increasing among various cells. Such interaction could be caused by
21
[Ca ] , propagation velocity of individual waves de-i (1) propagation of SCW’s across cell borders, and / or (2) creased (Fig. 5). This contradicts previous reports showing spatio-temporal coexistence of SCW’s in closely adjacent an increase in propagation velocity with increase in cells exerting a mutual electrotonic influence.
21 21
cytosolic [Ca ] [5,12]. The reason for this discrepancy, Intercellular Ca waves were observed that showed a which appeared to be significant (Fig. 5), remains to be clear spatial restriction to two, or at most three cells. At
21
this very small scale, propagation phenomena such as elucidated. It may be speculated that Ca release from the
21
collision with cell borders and unidirectional propagation SR or from the nucleus would produce a higher local Ca
21
occurred (Fig. 6). Also, the observed conflation of SCW’s concentration difference at lower [Ca ]i than at high
21 21
in one cell by waves from neighboring cells (Fig. 8) could cytosolic [Ca ] loads. This [Ca ] gradient may facilitate
represent a mechanism of synchronization. The reason of a higher propagation velocity of the induced SCW. Besides
21
the consistent restriction of SCW’s to only a few cells is being a Ca indicator, Fluo-3 has the side effect to buffer
21
not fully evident. Lamont et al. [10] interpret it as a useful cytosolic Ca to some degree. This might have affected
mechanism to limit arrhythmic activity. It is known that our results in Figs. 4 and 5 with respect to the properties of
21
Ca per se and in conjunction with cellular acidification both transients and SCW’s. We have minimized this
21 decreases gap junctional conductance [30,31]. Thus, Ca problem by keeping all loading parameters absolutely
increase might be a self-limiting factor for intercellular constant throughout our experiments.
21 21
Ca diffusion. However, the SCW’s occurred concomi-In a recent study, slow Ca waves were defined and
21
tantly with fast Ca transients and with coordinated named on the basis of their frequency [12]. Besides SCW’s
visible mechanical activity, indicating that the electrical (3.8–28.1 waves / min ¯0.06–0.5 Hz) which were of the
excitation process was not markedly slowed in presence of type also described in Figs. 2 and 3, these authors
21
SCW’s. This argument speaks against a major degree of described a further type of Ca wave (so-called ‘agonal
cell-to-cell uncoupling during the occurrence of SCW’s at waves’), which were characterized by a high frequency
21
slightly or moderately elevated cytosolic [Ca ] .
Phenom-(133.1 waves / min¯2.2 Hz), a high degree of rhythmicity i
21
ena such as collision and extinction of SCW’s were and an initiation at high cytosolic [Ca ] . In our experi-i
interpreted on the bases of 2-dimensional measurements in ments relatively frequent (1–5 Hz) and highly regular
a given focal plane. It is likely that these phenomena were waves were also observed, in coexistence with the slower
also affected by 3-dimensional propagation which was not and relatively irregular waves. However, the frequency of
assessed in our experiments. these waves showed no dependency on the cytosolic
21 21
Delayed afterdepolarizations in heart occur mostly as [Ca ] . A further type of regular Cai waves was
relatively fast and regular transient changes in membrane described in isolated cardiac myocytes as a consequence of
potential. Spatial as well as temporal summation (Fig. 8) circus movements with re-entry around the cell nucleus
could explain that SCW’s, which as individual waves were serving as a fixed anatomical obstacle [25]. In our
experi-rather slow (2–5 Hz), might lead to a relatively rapid ments such an intracellular circus movement was not
electrical excitation. In the present experiments, we select-observed.
ed an area (1503120 mm) with a diameter considerably smaller than the electrical space constant, to investigate the 21
4.3. Spatio-temporal occurrence of Ca waves and spatio-temporal occurrence of SCW’s. Within this area
potential relevance for arrhythmias 10–20% of the cells showed non-synchronized SCW’s. Both spatial summation or inhibition might occur in such a Delayed afterdepolarizations (DAD’s) are generally case, and summation might lead to a higher overall thought to involve electrogenic Na / Ca exchange [26,27] frequency. However, the rhythmicity of DAD’s observed and, possibly, chloride currents [28]. These mechanisms in macroscopic tissue is not easily explained by the
21
result from the transduction of a chemical Ca wave into observed spatio-temporal occurrence of SCW’s, because 21
a change in electrical membrane potential. A propagated the slow Ca waves were not phase-locked. This suggests action potential is generated, if the change in membrane that additional factors might determine whether localized
1
potential exceeds the threshold for Na inward current. SCW’s lead to electrical excitation and arrhythmias. While this mechanism is undisputed at the level of the In summary, our results show intercellular diffusion and
21 single cell, its generation in a network of coupled cells and a close spatio-temporal interaction of slow Ca waves. in tissue seems more complex. This is because single cells Summation of such waves might explain the production
´
[14] Fleischhauer J, Lehmann L, Kleber AG. Electrical resistances of
and the relatively high overall frequency of triggered
interstitial and microvascular space as determinants of the
extracel-action potentials. However, the exact mechanism of
lular electrical field and velocity of propagation in ventricular
synchronization remains to be determined. myocardium. Circulation 1995;92:587–594.
´
[15] Cascio WE, X YG-J, Kleber AG. Passive electrical properties, mechanical activity, and extracellular potassium in arterially per-fused and ischemic rabbit ventricular muscle. Circ Res
Acknowledgements
1990;66:1461–1473.
[16] Cohen NM, Lederer WJ. Changes in the calcium current of rat heart
We are very grateful to Peter Eggli MD, for his advice ventricular myocytes during development. J Physiol 1988;406:115– and help with the histological control experiments. 146.
Supported by the Swiss National Science Foundation [17] Gomez JP, Potreau D, Raymond G. Intracellular calcium transients from newborn rat cardiomyocytes in primary culture. Cell Calcium
and the Swiss Heart Foundation
1994;15:265–275.
[18] Anversa P, Olivetti G, Loud AV. Morphometric study of early postnatal development in the left and right ventricular myocardium
References of the rat. I. Hypertrophy, hyperplasia, and binucleation of
myocytes. Circ Res 1980;46:495–502.
[19] Takahashi A, Camacho P, Lechleiter JD, Herman B. Measurement of [1] Allen DG, Kurihara S. Calcium transients in mammalian ventricular
intracellular calcium. Physiol Rev 1999;79:1089–1125. muscle. Eur Heart J 1980:5–15.
[20] Lakatta EG. Functional implications of spontaneous sarcoplasmatic [2] Cheng H, Lederer WJ, Cannell MB. Calcium sparks: elementary
21
reticulum Ca release in the heart. Cardiovasc Res 1992;26:193– events underlying excitation–contraction coupling in heart muscle.
214. Science 1993;262:740–744.
[21] Del Principe F, Egger M, Niggli E. Calcium signalling in cardiac [3] Del Nido PJ, Glynn P, Buenaventura P, Salama G, Koretsky AP.
muscle: refractoriness revealed by coherent activation. Nature Cell Fluorescence measurement of calcium transients in perfused rabbit
Biol 1999;1:323–329. heart using rhod 2. Am J Physiol 1998;274:728–741.
21 [22] Cheng H, Lederer MR, Lederer WJ, Channell MB. Calcium sparks
[4] Wier WG, Ter Keurs HEDJ, Marban E, Gao WD, Balke CW. Ca
21
and [Ca ] waves in cardiac myocytes. Am J Physiol sparks and waves in intact ventricular muscle resolved by confocal i
1996;270:148–159. imaging. Circ Res 1997;81:462–469.
[23] Genka C, Ishida H, Ichimori K, Hirota Y, Tanaami T, Nakazawa H. [5] Minamikawa T, Cody SH, Williams DA. In situ visualization of
21
Visualization of biphasic Ca diffusion from cytosol to nucleus in spontaneous calcium waves within perfused whole rat heart by
contracting adult rat cardiac myocytes with an ultra-fast confocal confocal imaging. Am J Physiol 1997;272:236–243.
21 imaging system. Cell Calcium 1999;25:199–208.
[6] Miura M, Boyden PA, Ter Keurs HEDJ. Ca waves during
[24] Takamatsu T, Wier WG. Calcium waves in mammalian heart: triggered propagated contractions in intact trabeculae. Am J Physiol
quantification of origin, magnitude, waveform, and velocity. FASEB 1998;274:266–276.
21 J 1990;4:1519–1525.
[7] Miura M, Boyden PA, Ter Keurs HE. Ca waves during triggered
[25] Lipp P, Niggli E. Microscopic spiral waves reveal positive feedback propagated contractions in intact trabeculae. Determinants of the
in subcellular calcium signalling. Biophys J 1993;65:2272–2276. velocity of propagation. Circ Res 1999;84:1459–1468.
[26] Kass RS, Tsien RW, Weingart R. Ionic basis of transient inward [8] Zhang YM, Miura M, Ter Keurs HE. Triggered propagated
contrac-current induced by strophantidin in cardiac Purkinje fibres. J Physiol tions in rat cardiac trabeculae. Inhibition by octanol and heptanol.
1978;281:209–226. Circ Res 1996;79:1077–1085.
[27] Niggli E, Lederer WJ. Activation of Na–Ca exchange current by [9] Ter Keurs HE, Zhang YM, Miura M. Damage-induced arrhythmias:
photolysis of caged calcium. Biophys J 1993;65:882–891. reversal of excitation–contraction coupling. Cardiovasc Res
[28] Trafford AW, Diaz ME, Eisner DA. Ca-activated chloride current 1998;40:444–455.
21
and Na–Ca exchange have different time courses during sarcoplas-[10] Lamont C, Luther PW, Balke CW, Wier WG. Intercellular Ca
mic reticulum Ca release in ferret ventricular myocytes. Pflugers waves in rat heart muscle. J Physiol 1998;512:669–676.
Archiv-Eur J Physiol 1998;435:743–746. [11] Hama T, Takahashi A, Ichihara A, Takamatsu T. Real time in situ
[29] Fozzard HA, Schoenberg M. Strength-duration curves in cardiac confocal imaging of calcium wave in the perfused whole heart of the
Purkinje fibres: effects of liminal length and charge distribution. J rat. Cell Signal 1998;10:331–337.
Physiol (Lond) 1972;226:593–618. [12] Kaneko T, Tanaka H, Gyamada M, Kawata S, Takamatsu T. Three
21
distinct types of Ca waves in Langendorff-perfused rat heart [30] Noma A, Tsuboi N. Dependence of junctional conductance on revealed by real-time confocal microscopy. Circ Res 2000;86:1093– proton, calcium and magnesium ions in cardiac paired cells of
1099. guinea-pig. J Physiol 1987;382:193–211.
( 21 ) ( 21 )
[13] Boyden P, Pu J, Pinto J, ter Keurs H. Ca transients and Ca [31] Firek L, Weingart R. Modification of gap junction conductance by waves in Purkinje cells: role in action potential initiation. Circ Res divalent cations and protons in neonatal rat heart cells. J Mol Cell