Data resource profile
Data Resource Profile: Countdown to 2015:
Maternal, Newborn and Child Survival
Jennifer Requejo,
1* Cesar Victora
2and Jennifer Bryce;
3on behalf of the
Scientific Review Group of Countdown to 2015
1
Partnership for Maternal, Newborn & Child Health, Geneva, Switzerland,
2International Center for
Equity in Health, Federal University of Pelotas, Pelotas, Brazil and
3Institute for International Programs,
Johns Hopkins Bloomberg School of Public Health, Baltimore, MD, USA
*Corresponding author. Partnership for Maternal, Newborn & Child Health, 20 Avenue Appia, 1211 Geneva 27, Switzerland. E-mail: [email protected]
Accepted 28 January 2014
Abstract
The Countdown to 2015 country profiles present, in one place, comprehensive evidence
to enable an assessment of a country’s progress in improving reproductive, maternal,
newborn and child health. Profiles are available for each of the 75 countries that together
account for more than 95% of all maternal and child deaths. The two-page profiles are
updated approximately every 2 years with new data and analyses. Profile data include
demographics, mortality, nutritional status, coverage of evidence-based interventions,
within-countries inequalities in coverage, measures of health system functionality,
sup-portive policies and financing indicators. The main sources of data for the coverage,
nu-tritional status and equity indicators are the US Agency for Internal Development
(USAID)-supported demographic and health surveys and the United Nations Children’s
Fund (UNICEF)-supported multiple indicator cluster surveys. Data on coverage are first
summarized and checked for quality by UNICEF, and data on equity in intervention
coverage are summarized and checked by the Federal University of Pelotas. The
mortal-ity estimates are developed by the Inter-agency Group for Child Mortalmortal-ity Estimation and
the Maternal Mortality Estimation Inter-Agency Group. The financing data are abstracted
from datasets maintained by the Organization for Economic Co-operation and
Development Assistance Committee, and the policies and health systems data are
derived from a special compilation prepared by the World Health Organization.
Associated country profiles include equity-specific profiles and one-page profiles
pre-pared annually that report on the 11 indicators selected by the Commission on
Information and Accountability for Women’s and Children’s Health.
VCThe Author 2014. Published by Oxford University Press on behalf of the International Epidemiological Association 586
This is an Open Access article distributed under the terms of the Creative Commons Attribution Non-Commercial License (http://creativecommons.org/licenses/by-nc/3.0/), which permits non-commercial re-use, distribution, and reproduction in any medium, provided the original work is properly cited. For commercial re-use, please contact [email protected]
Advance Access Publication Date: 16 March 2014 Data resource profile
Data resource basics
Countdown to 2015 for Maternal, Newborn and Child Survival (Countdown) is a global movement to track, stimulate and support country progress on achieving the health-related Millennium Development Goals (MDGs), particularly goals 4 (reduce child mortality) and 5 (improve maternal health). Countdown was established in 2003 by the Bellagio Study Group on Child Survival1and includes academics, governments, international agencies, profes-sional associations, donors, non-governmental organizations and other members of civil society who share the common goal of increasing accountability for women’s and children’s health. Initially focused on child survival, Countdown expanded its mandate in 2007 to encompass the full repro-ductive, maternal, newborn and child health continuum of care (RMNCH). The countries included in Countdown ana-lyses have increased from 60 in its first report in 2005 to a total of 75 countries in the fourth report in 2012. Together these 75 countries account for more than 95% of the world’s maternal, newborn and child deaths. A full list of Countdown countries is available at [http://www.count down2015mnch.org/country-profiles].
Countdown produces periodic publications, reports and other materials on key aspects of RMNCH, achieving global impact with its use of data to hold all stakeholders to account for global and national action. Countdown is playing a cen-tral role in the follow-up to the United Nation’s Secretary General’s Global Strategy for Women’s and Children’s Health by updating the 11 indicators selected by the Commission on Information and Accountability for Wom-en’s and ChildrWom-en’s Health (Commission) annually, and by undertaking a series of in-depth country case study analyses.2 At the core of Countdown reports are country profiles that present, in one place, the latest evidence to assess
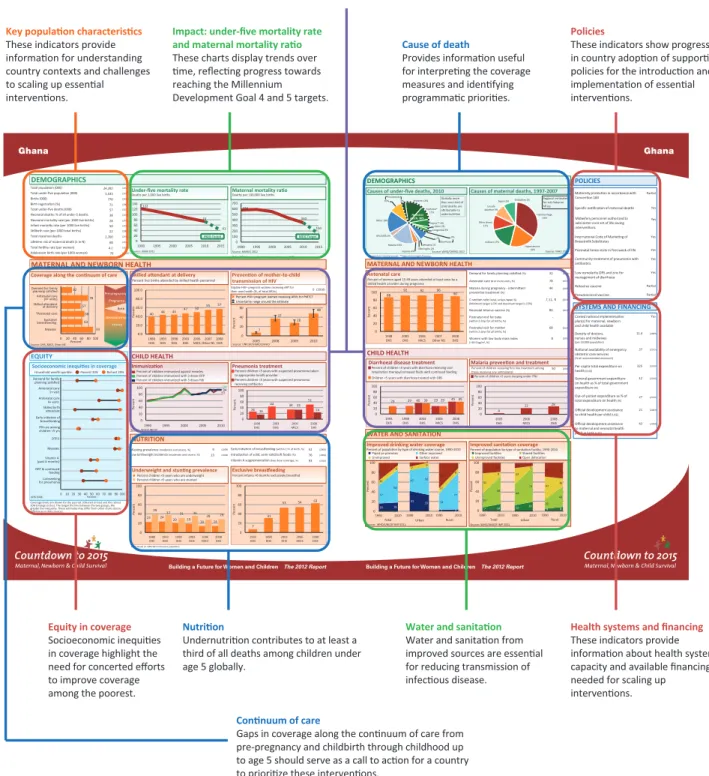
country progress in improving RMNCH. The two-page
country profiles (Figure 1) are updated approximately
every 2 years and include key demographic, nutritional status and mortality statistics, coverage levels and trends of proven RMNCH interventions, and policy, health system, financial and equity indicators.
Enhancing country capacity to monitor and evaluate results is a key Countdown principle and central to the accountability agenda. The Countdown profiles reflect the estimates available for each country, and can be used to re-view available data and identify areas where progress must be accelerated.
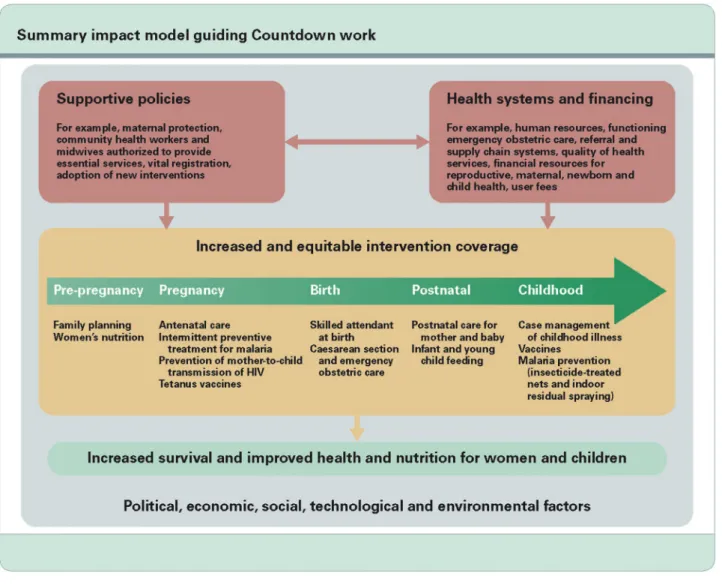
Figure 2 presents the overarching framework guiding Countdown analyses and the basic structure of the Count-down database. It shows the range of indicators included in the coverage, policies and systems, and financing data-sets, and illustrates possible pathways through which policy, systems and financing measures in a given context impact on levels and trends in coverage of proven RMNCH interventions.
All data used to construct the 2012 and 2013 Countdown country profiles are available to the public, free of charge. The datasets used to construct the 2012 two-page profiles and to prepare the summary measures in the 2013 Countdown Accountability report are available in Excel format at [www.countdown2015mnch.org/about-countdown/countdown-data]. The Countdown profiles, reports and datasets present point estimates and do not provide uncertainty ranges. The equity analyses, however, systematically provide uncertainty bounds for all estimates; these are available upon request from the equity technical working group. The coverage Excel files were prepared by the Countdown coverage technical working group and are maintained by Johns Hopkins University. The information
Key Messages
• Decision makers can use the profiles to review available evidence and determine if trends in mortality and coverage are moving in the right direction, and to identify opportunities to address coverage gaps and accelerate progress in women’s and children’s health.
• Countdown databases can be used to document trends in coverage and to examine potential coverage determinants such as population characteristics, patterns of equity, financial flows and health policy adoption.
• All Countdown profiles are available at [www.countdown2015mnch.org/country-profiles]. The datasets used to pre-pare the latest versions of the profiles are publically available in Excel format at [www.countdown2015mnch.org/ about-countdown/countdown-data]. The Excel files include the following information for each indicator tracked by Countdown: indicator definition, and estimate, data source and year for each Countdown country with available data. • Countdown has produced regular reports, a series of articles in the Lancet, and short briefs to disseminate Countdown
findings to a wide range of audiences including policy makers, the scientific community, donors and advocates. • Countdown has launched its findings through major international conferences in 2005, 2008, 2010, 2012 and 2013,
and has engaged with the Inter-Parliamentary Union to promote the use of evidence for holding governments and their partners to account for progress.
presented for each coverage indicator includes the indica-tor definition, and the estimate, data source and year by Countdown country. The data for the coverage indicators, publicly available and continuously updated by UNICEF at [www.childinfo.org], come mostly from household sur-veys. The two main surveys used to collect nationally rep-resentative data for reproductive, maternal, newborn and child health in the 75 Countdown (Figure 3) countries are the USAID-supported demographic and health surveys (DHS) [www.measuredhs.com] and the UNICEF-supported multiple indicator cluster surveys (MICS) [www.childinfo. org/mics_available.html]. A data resource profile describing the global databases (coverage, vital statistics, demographic and nutritional status measures, etc.) maintained by UNICEF was published in 2012 in this journal.3
These two surveys also provide the estimates used for the Countdown equity analyses and include coverage by house-hold wealth quintile, urban-rural residence, child sex, mater-nal educatiomater-nal attainment and region of the country.
Detailed equity profiles for 2010 and 2012 are available at the Countdown website, [www.countdown2015mnch. org/country-profiles], for Countdown countries that had at least one DHS or MICS survey with information on wealth status. The equity database is prepared by the Countdown equity technical working group and maintained by the International Center for Equity in Health [www.equidade. org] based at the Federal University of Pelotas, Brazil. The equity-specific profiles are derived from re-analyses of data from MICS and DHS surveys using standardized def-initions of equity stratifiers and outcomes. Each equity profile includes a table and four figures.
The financing database is prepared by the Countdown financing technical working group and maintained by the London School of Hygiene and Tropical Medicine. It in-cludes the definition and source for each indicator, and the indicator estimate by year per Countdown country. The data source for the financing indicators included on the Countdown country profiles is the Organization for
Economic Co-operation and Development, Development Assistance Committee. [http://www.oecd.org/dac/].
The health systems and policies database is prepared by the Countdown health systems and policies technical work-ing group and maintained by the World Health Organiza-tion. There are four main sources of data for the health systems and policies indicators: global databases maintained by the World Health Organization and other groups such as the International Labour Organization; routine monitoring data from United Nations organizations; national service delivery surveys (for emergency obstetric care data); and sur-veys administered to government authorities by the World Health Organization. Survey responses are validated by United Nations agencies at the country level and compiled by the World Health Organization.
Data resource area and population coverage
The Countdown countries were selected primarily accord-ing to mortality burden, takaccord-ing into consideration both numbers and rates of deaths. Country selection has taken place in three phases. In 2004, when the initiative was focused on child survival, the list included all countries with at least 50 000 child deaths and all countries with an under-five mortality rate of at least 90 deaths per 1000 live births. The 60 total countries accounted for 94% of all child deaths in that year. The list was expanded in 2007, when the initiative evolved to embrace the continuum of care and to also include countries with the highest mater-nal mortality ratios (countries with an MMR of at least
550 deaths per 100 000 live births) or highest numbers of maternal deaths (countries with at least 750 maternal deaths and an MMR of more than 200). This exercise re-sulted in the inclusion of eight additional countries, to a total of 68. These 68 countries accounted for 95% of all maternal, newborn and child deaths. In 2011, Countdown agreed to take responsibility for major parts of the follow-up agenda of the Commission for Information and Accountability for Women’s and Children’s Health, which resulted in the final expansion of the country list to 75. The 75 countries include all high-burden countries and the 49 low-income countries discussed in the Global Strategy for Women’s and Children’s Health.
Survey frequency
Each country profile includes all available data that meet quality standards for every indicator tracked in Countdown. The profiles show that data availability varies widely by in-dicator and across the Countdown countries. For some indi-cators, data are available extending back to 1990, the baseline year for MDG tracking, or earlier (e.g. mortality, immunization indicators, nutritional status indicators, some coverage measures). Data are not available for other indica-tors until the 2000s, reflecting the more recent introduction of interventions at scale across the priority countries and the inclusion of coverage indicators into household survey protocols (e.g. prevention of mother-to-child transmission of HIV, insecticide-treated bed nets). Profiles showing miss-ing values and most recent estimates usmiss-ing data that are
more than 5 years old indicate an urgent need for increased data collection efforts so that timely evidence can be used for policy and programme development and monitoring.
Countdown anticipates that all 75 countries will have a major household survey between 2013 and the end of 2015 so that results are ready for reporting on progress for the 2015 MDG deadline. A high-level Summit is planned for September 2015 to adopt a new set of goals that build on the achievements of the MDGs.
Measures
Countdown focuses on coverage. Countdown’s most im-portant criterion for including a coverage indicator in its databases is the availability of peer-reviewed evidence of effectiveness of the associated intervention in reducing ma-ternal, newborn or child mortality. Countdown tracks indicators of coverage for proven interventions that are judged feasible for delivery at high and sustained coverage levels in low-income countries. Other criteria are that the indicator must produce results that are nationally represen-tative, reliable and comparable across countries and time, clear and easily interpreted by policy makers and pro-gramme managers and available regularly in most of the Countdown countries. Although Countdown strives to limit the total number of indicators tracked to keep the effort focused, the set of Countdown coverage indicators includes representation across the major dimensions of the RMNCH continuum of care (e.g. family planning, ante-natal, perinatal and postnatal care, infant feeding, preven-tion and case management of major childhood illnesses).
These indicators are meant to serve as signals that can trigger the need for further investigation and should be interpreted in the context of more comprehensive information.3
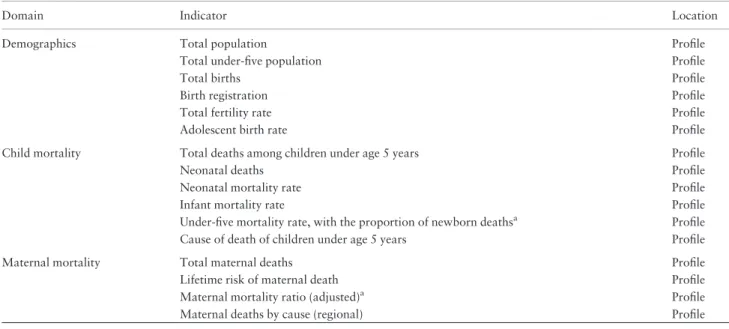
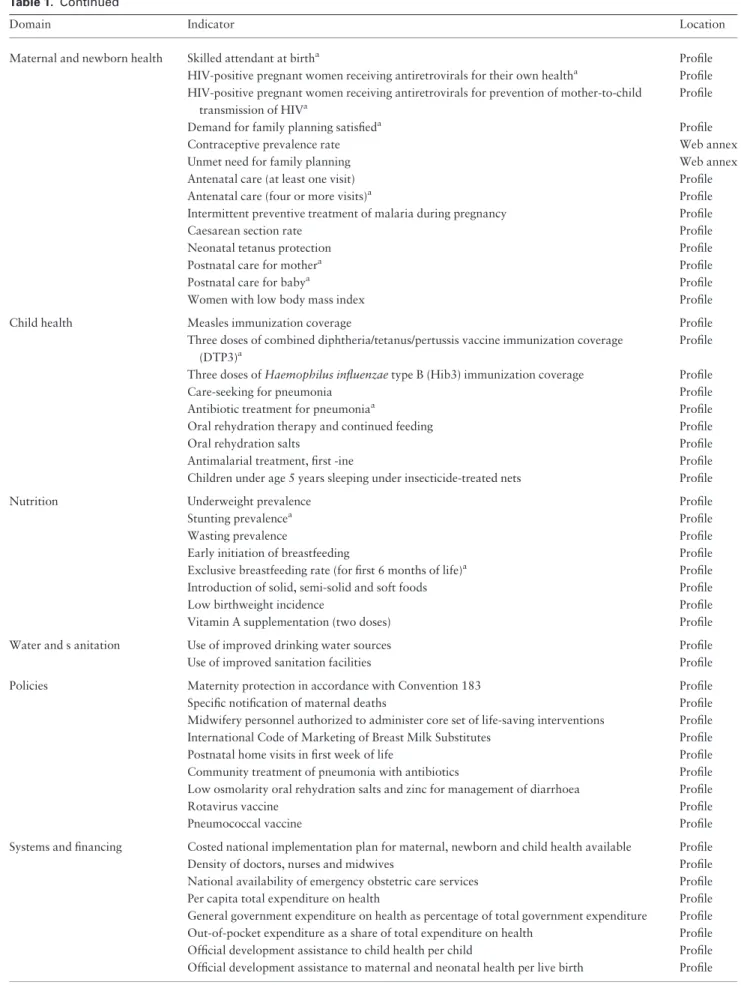
Because intervention costs, delivery strategies and the evidence base can change, Countdown undertakes a rigor-ous technical review process at regular intervals to reassess the criteria for indicator selection and the full indicator list. This iterative process enables Countdown to be re-sponsive to the evidence base. The policies, systems and financing indicators are also reviewed to ensure that they are the most relevant indicators to track as key determin-ants of coverage.Table 1shows the set of indicators moni-tored by Countdown as of 2013, organized by topic area. The 11 core Commission indicators are highlighted (note: 13 indicators are highlighted because 2 of the 11 core Commission indicators include 2 component parts, the postnatal care and HIV indicators). Countdown reports in-clude a set of annexes describing the indicator definitions, data sources and other information on methods used in Countdown analyses.
Data resource use
Countdown launched its fourth report, Building a Future for Women and Children, in June 2012 at the Child Survival Call to Action, Washington DC. The report in-cludes profiles for each of the 75 countries as well as a summary of progress across the 75 countries towards the achievement of MDGs 4 and 5. Report analyses address trends in mortality and coverage, patterns of equity,
Table 1. Countdown indicator list as of 2013
Domain Indicator Location
Demographics Total population Profile
Total under-five population Profile
Total births Profile
Birth registration Profile
Total fertility rate Profile
Adolescent birth rate Profile
Child mortality Total deaths among children under age 5 years Profile
Neonatal deaths Profile
Neonatal mortality rate Profile
Infant mortality rate Profile
Under-five mortality rate, with the proportion of newborn deathsa Profile
Cause of death of children under age 5 years Profile
Maternal mortality Total maternal deaths Profile
Lifetime risk of maternal death Profile
Maternal mortality ratio (adjusted)a Profile
Maternal deaths by cause (regional) Profile
Table 1. Continued
Domain Indicator Location
Maternal and newborn health Skilled attendant at birtha Profile
HIV-positive pregnant women receiving antiretrovirals for their own healtha Profile HIV-positive pregnant women receiving antiretrovirals for prevention of mother-to-child
transmission of HIVa
Profile
Demand for family planning satisfieda Profile
Contraceptive prevalence rate Web annex
Unmet need for family planning Web annex
Antenatal care (at least one visit) Profile
Antenatal care (four or more visits)a Profile
Intermittent preventive treatment of malaria during pregnancy Profile
Caesarean section rate Profile
Neonatal tetanus protection Profile
Postnatal care for mothera Profile
Postnatal care for babya Profile
Women with low body mass index Profile
Child health Measles immunization coverage Profile
Three doses of combined diphtheria/tetanus/pertussis vaccine immunization coverage (DTP3)a
Profile Three doses of Haemophilus influenzae type B (Hib3) immunization coverage Profile
Care-seeking for pneumonia Profile
Antibiotic treatment for pneumoniaa Profile
Oral rehydration therapy and continued feeding Profile
Oral rehydration salts Profile
Antimalarial treatment, first -ine Profile
Children under age 5 years sleeping under insecticide-treated nets Profile
Nutrition Underweight prevalence Profile
Stunting prevalencea Profile
Wasting prevalence Profile
Early initiation of breastfeeding Profile
Exclusive breastfeeding rate (for first 6 months of life)a Profile
Introduction of solid, semi-solid and soft foods Profile
Low birthweight incidence Profile
Vitamin A supplementation (two doses) Profile
Water and s anitation Use of improved drinking water sources Profile
Use of improved sanitation facilities Profile
Policies Maternity protection in accordance with Convention 183 Profile
Specific notification of maternal deaths Profile
Midwifery personnel authorized to administer core set of life-saving interventions Profile International Code of Marketing of Breast Milk Substitutes Profile
Postnatal home visits in first week of life Profile
Community treatment of pneumonia with antibiotics Profile Low osmolarity oral rehydration salts and zinc for management of diarrhoea Profile
Rotavirus vaccine Profile
Pneumococcal vaccine Profile
Systems and financing Costed national implementation plan for maternal, newborn and child health available Profile
Density of doctors, nurses and midwives Profile
National availability of emergency obstetric care services Profile
Per capita total expenditure on health Profile
General government expenditure on health as percentage of total government expenditure Profile Out-of-pocket expenditure as a share of total expenditure on health Profile Official development assistance to child health per child Profile Official development assistance to maternal and neonatal health per live birth Profile
supportive policy adoption, improvements in health system capacity to deliver needed services, and trends in financial flows for maternal, newborn and child health programmes. The data in the report have been used to develop advocacy materials for subsequent high-level events, such as the dis-tribution of a flyer focused on Africa and the malaria indi-cators tracked in Countdown to ministries of health at the African Union Summit in Addis Ababa, Ethiopia, in July 2012. Policy makers and their international partners are being encouraged to use the 2012 profiles and one-page 2013 profiles showcasing the 11 core Commission indica-tors as an evidence-based tool for decision making about programme and policy development and implementation. Countdown is increasing its efforts to support in-depth analyses at country level and country-level Countdown processes based on subnational profiles used to stimulate political commitment and strengthen the use of evidence for strategic planning. Countdown regularly prepares papers for publication in peer-reviewed journals that are either cross-cutting or focused on one of the four technical areas (coverage, equity, health systems and policies,
financing).The next Countdown report is expected to be launched in June 2014.
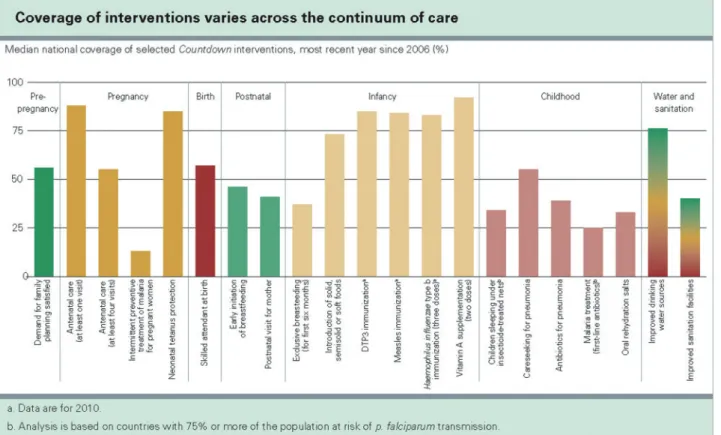
Figure 4shows an example of Countdown’s signature continuum of care graph presented in each major report. It presents median coverage levels and the range in coverage across the 75 countries with available data for each of the
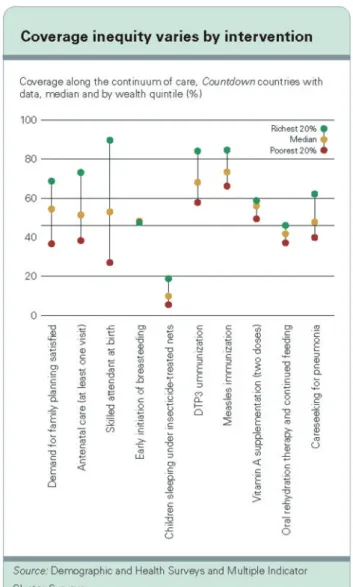
Countdown coverage indicators.Figure 5is an example of
key equity findings prepared for Countdown reports, drawing attention to the wide variations in coverage levels within countries and how equity patterns differ by inter-vention (both figures are from the 2012 Countdown report).
A citation list is available in Table 2, highlighting all reports, briefs and articles prepared by the Countdown technical working groups and the broader membership base since 2005.
Strengths and weaknesses
The indicators tracked in Countdown are selected through a consultative technical review process, and
data quality is a major focus of Countdown work. Countdown links with existing quality review and im-provement mechanisms to ensure data validity and high-light data gaps and other methodological challenges with Countdown indicators (e.g. changes in definitions of indicators over time which limit the ability to meas-ure trends). The Countdown coverage technical working group, for example, worked closely with the Child Health Epidemiology Reference Group on the prepar-ation of a collection of articles on improving coverage measurement, published in PLOS Medicine, see [http:// www.ploscollections.org/article/browse/issue/info%3 Adoi%2F10.1371%2Fissue.pcol.v01.i16].
Two areas of Countdown technical work moving forward are to develop and incorporate standard proced-ures for estimating uncertainty and quality of care meas-ures. Countdown recognizes that increases in intervention
coverage will result in mortality reductions only if inter-ventions are delivered at adequate levels of quality, and that monitoring service quality is an essential aspect of pro-gramme management. Quality of care indicators planned for inclusion in future Countdown cycles will include measures that capture health service readiness, audits, interventions actually received during service contacts and others as appropriate.
Countdown anticipates continuing its role in promoting accountability for women’s and children’s health after 2015. The launch of the 2014 report in June will pro-vide an opportunity to reassess the Countdown indicator list in view of the report findings and the post-2015 discussions.
Data resource access
All Countdown reports, articles, advocacy briefs, two-page country profiles, Commission-specific one-page country profiles and equity country profiles are available at [www.countdown2015mnch.org]. The Countdown 2012 profile database and the 2013 Countdown coverage and equity databases in Excel format are also available for download at the Countdown website [www.count down2015mnch.org/about-countdown/countdown-data]. The most updated data for Countdown coverage indicators are available at [www.childinfo.org].
Queries made through the Countdown website are triaged by the Countdown Secretariat hosted by the Partnership for Maternal, Newborn & Child Health, circu-lated to the most appropriate technical working group and responded to in a timely manner. The uncertainty bounds for the estimates prepared by the Countdown equity tech-nical working group are available upon request by contact-ing Dr Aluisio Barros at [[email protected]].
Funding
This work was supported by the Bill and Melinda Gates Foundation, the World Bank and the Governments of Australia, Canada, Norway, Sweden and the UK.
Acknowledgments
We would like to thank the Bill and Melinda Gates Foundation, the World Bank, and the Governments of Australia, Canada, Norway, Sweden and the United Kingdom for their support of this work and for Countdown.
Members of the Scientific Review Group of Countdown to 2015 in-clude, in addition to the authors: Peter Berman, Bernadette Daelmans, Andres De Francisco, Joy Lawn, Holly Newby and Monica Fox.
Conflict of interest: None declared.
Table 2. Countdown to 2015 citation list, 2005–13
Publication type Citation
Full reports • Countdown 2012 report: Building a future for women and children • Countdown to 2015 decade report (2000–10)
• Tracking progress in maternal, newborn and child survival: the 2008 report • Tracking Progress in child survival: the 2005 report
Short reports • Accountability for maternal, newborn and child survival: the 2013 update
• Accountability for maternal, newborn and child survival: an update on progress in priority countries (2012) • Monitoring maternal, newborn and child health: understanding key progress indicators
Peer-reviewed articles
2013
• Walker N, Yenokyan G, Friberg I, Bryce J. Patterns in coverage of maternal, newborn, and child health interventions:
projections of neonatal and under-5 mortality to 2035. Lancet 2013;382:1029–38.
• Hsu J, Pitt C, Berman P, Mills A. Reproductive health priorities: evidence from a resource tracking analysis of official
development assistance in 2009 and 2010. Lancet 2013. doi: 10.1016/S0140-6736(13)60762-X
• Cavallaro F, Cresswell J, Franca G, Victora C, Barros A, Ronsmans C. Trends in caesarean delivery by country and
wealth quintile: cross-sectional survey in South Asia and Sub-Saharan Africa. Bulletin of the World Health Organization. 2013 December 1; 91(12): 914–922D
2012
• Hsu J, Pitt C, Greco G, Berman P, Mills A. Countdown to 2015: changes in official development assistance to
mater-nal, newborn, and child health in 2009–10, and assessment of progress since 2003. Lancet 21 September 2012. doi: 10.1016/S0140-6736(12)61415-9). (PDF)
• Victora C, Barros A, Axelson H, et al, How changes in coverage affect equity in maternal and child health
interven-tions in 35 Countdown to 2015 countries: an analysis of national surveys. Lancet 21 September 2012. doi: 10.1016/ S0140-6736(12)61427-5. (PDF)
• Amouzou A, Habi O, Bensaı¨d K, Reduction in child mortality in Niger: a Countdown to 2015 country case study.
Lancet 21 September 2012. doi: 10.1016/S0140-6736(12)61376-2 (PDF)
• Sanda S, Comment: Niger’s success in child survival. Lancet, 21 September 2012. doi: 10.1016/S0140-6736(12)61514-1. (PDF)
• Bhutta Z, Chopra M. The Countdown for 2015: what lies ahead? Lancet 21 September 2012. doi:
10.1016/S0140-6736(12)61382-8. (PDF)
• Countdown 2012 Report writing group. Countdown 2012 report: Building a future for women and children. Lancet
2012;379:2121–22
• Barros A, Ronsmans C, Axelson H, et al. Equity in maternal, newborn, and child health interventions in Countdown
to 2015: a retrospective review of survey data from 54 countries. Lancet 2012;379:1225–33 2011
• Gupta M, Maliqi B, Franc¸a A, et al. Human resources for maternal, newborn and child health: from measurement and planning to performance for improved health outcomes. Hum Res Health 2011;9:16
2010
• Pitt C, Greco G, Powell-Jackson T, Mills A. Countdown to 2015: assessment of official development assistance to
maternal, newborn, and child health, 2003—08. Lancet 2010;376:1485–96.
• Bhutta Z, Chopra M, Axelson H et al. Countdown to 2015 decade report (2000–10): taking stock of maternal,
new-born, and child survival. Lancet 2010;375:2032–44. 2008
Lancet: Full Countdown issue, April 12, 2008
• Countdown Coverage Writing Group on behalf of the Countdown to 2015 Core Group, Countdown to 2015
Maternal, Newborn and Child Survival: the 2008 report on tracking coverage for interventions. Lancet 2008;371:1247–58
References
1. Claeson M, Gillespie D, Mshinda H, Troedsson H, Victora CG. Knowledge into action for child survival. Lancet 2003;362: 323–27.
2. United Nation’s Commission on Information and Accountability for Women’s and Children’s Health. Keeping Promises, Measuring Results. Geneva: World Health Organization, 2011.
3. Murray C, Newby H. Data resource profile: United Nations’ Children’s Fund. Int J Epidemiol 2012;41:1595–1601.
4. Requejo JH, Newby H, Bryce J. Measuring coverage in MNCH: Challenges and opportunities in the selection of coverage indica-tors for global monitoring. PLoS Med 2013;10: e1001416.
Table 2. Continued
Publication type Citation
• Countdown Working Group on Health Policy and Health Systems. Assessment of the health system and policy envi-ronment as a critical complement to tracking intervention coverage for maternal newborn and child health. Lancet 2008;371:1284–93
• Countdown 2008 Equity Analysis Group, Mind the gap: equity and trends in coverage of maternal, newborn and child health services in 54 Countdown countries. Lancet 2008;371:1259–67.
• Greco G, Powell-Jackson T, Borghi J, Mills A. Countdown to 2015: assessment of donor assistance to maternal,
new-born and child health between 2003 and 2006. Lancet 2008;371:1268–75
• Masanja H, de Savigny D, Smithson P et al. Child survival gains in Tanzania: analysis of data from demographic and
health surveys. Lancet 2008;371:1276–83.
• South Africa Every Death Counts Writing Group. Every death counts: use of mortality audit data for decision making
to save the lives of mothers, babies and children in South Africa. Lancet 2008;371:1294–304
• Heikens G, Bunn J, Amadi B. Viewpoint: Case management of HIV-infected severely malnourished children: chal-lenges in the area of highest prevalence. Lancet 2008;371:1305–07
• Salama P, Lawn J, Bryce J et al. Comment: Making the Countdown count. Lancet 2008;371:1219–21 • Horton R. Comment: Countdown to 2015: a report card on maternal, newborn and child survival. Lancet
2008;371:1217–19
• Bustreo F, Johnsson A. Comment: Parliamentarians: leading the change for maternal, newborn, and child survival?
Lancet 2008;371:1221–22
• Bernstein S, Say L, Chowdhury S. Comment: Sexual and reproductive health: completing the continuum. Lancet
2008;371:1225–26
• Shankar A, Bartlett L, Fauveau V et al., on behalf of the Countdown to 2015 Maternal Health Group. Comment: Delivery of MDG 5 by active management with data. Lancet 2008;371:1223–24
• Stoltenberg J. Comment: Delivering for women and children. Lancet 2008;371:1230–32 • Lancet. Editorial: South Africa in the spotlight. Lancet 2008;371:1215
2007
• Lawn J, Costello A, Mwansambo C, Osrin D. Countdown to 2015: will the Millennium Development Goal for child
survival be met? Arch Dis Child 2007;92:551–56 2006
• Bryce J, Terreri N, Victora C et al. Countdown to 2015: tracking intervention coverage for child survival. Lancet
2006;368:1067–76
• Horton R. A new global commitment to child survival. Lancet 2006;368:1041–42
• Powell-Jackson T, Borghi J, Mueller D, Patouillard E, Mills A. Countdown to 2015: tracking donor assistance to
maternal, newborn, and child health. Lancet 2006;368:1077–87 2005
• Bryce J, Victora C, on behalf of the Conference Organizing Group. Comment: Child survival: countdown to 2015.