Investigating Oculomotor Control in Visual Search: From
Development to Culture
Dissertation zur Erlangung der Doktorwürde an der Philosophischen
Fakultät der Universität Freiburg (Schweiz)
Genehmigt von der Philosophischen Fakultät auf Antrag der
Herren Professoren Prof. Dr. Roberto Caldara (1. Gutachter) und Prof. Dr.
Fred Mast (2. Gutachter).
Freiburg, den 21.Dezember 2017.
Prof. Dr. Bernadette Charlier (Dekanin).
"Ich erkläre ehrenwörtlich, dass ich meine Dissertation selbständig und ohne unzulässige fremde Hilfe verfasst habe und sie noch
keiner anderen Fakultät vorgelegt habe."
“The true mystery of the world is the visible, not the invisible.”
- Oscar Wilde
To my parents Rea & Marcel Lüthold
ACKNOWLEDGEMENT
Thank you. I think people in general do not say thank you enough. During my time as a PhD-student, and believe me it has been some time now, I have not heard the words thank you quite a lot. Nevertheless, the time has come and it is my turn to say thank you. Thank you!
First of all I want to thank Prof. Dr. Roberto Caldara for believing in me and giving me the final chance and push to finish my thesis. Without you this work would have stayed an unfinished business taking up several bytes of memory on a dusty computer hard disc. Throughout the past months you showed great generosity, and understanding towards me. I really appreciated the push and the occasional beers at our aperos. At this point I want to thank all of your team for accepting me as one of them. Special thanks go out to Dr. Sebastian Miellet and Dr. Lao Jungpen, who have both been a great inspiration as researchers and as a person. Thank you Seb for your support and continuous encouragement. Charles, I want to thank you for the uplift our conversations gave me and for the moments we shared on the basketball court. Finally, I want to thank Helen Rogers for the laughs we shared in preparation of our course, you are a great gal.
Secondly, I want to thank Dr. Pascal Gygax for seeing my potential and for constantly reminding me of my task at hand. You are a perfect mix between serious and social that makes academia seem like a cool place.
Thank you Claudia Vonlanthen, your work as a secretary is remarkable and in my opinion you are the balance wheel that keeps the clock of the department ticking. I am grateful for the countless mornings I sat in the chair next to your desk receiving free counseling for all the little and not so little worries I had. Thank you!
I want to thank all the people I came across during my time at the Regina Mundi: from the lovely women serving at the cafeteria to the janitor and the cleaning staff. You made it possible for me to focus on my research. Thank you.
There are many people I want to thank off work for all their support and understanding during the time of my thesis. Although we share the same work place, I want to thank Dr. Andreas Sonderegger as a friend. Thank you for being my friend along this journey of mine. Thank you for being my home away from home and thank you for letting me be part of your family. At this point I want to thank your wife Soraya Sonderegger for all her kindness and for being my substitute mother in
Fribourg. Thank you Nils, moments spent with you remind me what really matters in life and your laughter is the rainbow that clears any cloudy day.
Thank you Marie Deferne for your comfort and support. We met at a moment where I was close to giving up. You gave me strength to get back to it and have been by my side ever since. The moments we share together fill me with joy and give me something to look forward to.
Of course my biggest thanks goes to my family. I am grateful for my parents and the unconditional love they show me every day. Without you I cannot imagine how I would have ever made it so far. I know I am not the easiest of your children and at times I make life more difficult than it has to be but still you support me and give me the feeling of a home that I can always come back to. Thank you. Alexandra, my sister, although you are the older of us two, you always treated me with respect and accepted my different personality. Our relationship has matured over the ages and I am proud to call you my sister and am looking forward to our future as a family.
Before I end my acknowledgments I feel obliged to thank one more person. Thank you Prof. Dr. Joseph Krummenacher. Many of my professional qualities stem from the opportunity you gave me as being your PhD-student. But much greater are the things you taught me off the job. One quote I remember very well is: “ the world is unfair” (Joseph Krummenacher, personal communication, 2011). You have made me challenge the views of authorities and create the character I am today. Thank you.
TABLE OF CONTENTS
1! INTRODUCTION ... 11!
1.1! THE EYE ... 12!
1.2! THE FOVEA, PARAFOVEA AND PERIPHERY ... 13!
1.3! EYE MUSCLES ... 14!
1.4! EYE MOVEMENTS ... 15!
1.5! EYE TRACKING ... 16!
1.6! WHAT DRIVES THE EYE? ... 17!
1.7! FEATURE-INTEGRATION THEORY ... 18!
1.8! LIMITATION OF THE FEATURE INTEGRATION THEORY ... 20!
1.9! GUIDED SEARCH THEORY ... 21!
1.10! VISUAL SEARCH PARADIGM ... 21!
1.11! OVERT AND COVERT ATTENTION ... 22!
1.12! CURRENT INVESTIGATION ... 24!
2! CHAPTER I ... 26!
SACCADIC AND MOTOR DEVELOPMENT IN FEATURE SEARCH IN CHILDREN ... 26!
2.1! ABSTRACT ... 26!
2.2! INTRODUCTION ... 27!
2.3! VISUAL SEARCH IN CHILDREN ... 28!
2.3.1! Reaction time ... 28!
2.3.2! Eye movements ... 29!
2.4! METHOD SEARCH TASK ... 31!
2.4.1! Participants ... 31!
2.4.2! Materials ... 32!
2.4.3! Stimuli ... 32!
2.4.4! Design ... 33!
2.4.5! Procedure ... 33!
2.5! METHOD MOTOR TASK ... 34!
2.5.1! Participants ... 34!
2.5.2! Materials, Stimuli, Design and Procedure ... 34!
2.6! SEARCH TASK RESULTS ... 34!
2.6.1! Reaction Time Removal of Outliers ... 34!
2.6.2! Errors ... 34!
2.6.3! Reaction Times ... 35!
2.7! EYE MOVEMENT RESULTS ... 40!
2.7.1! Eye Movements Removal of Outliers ... 40!
2.7.2! Eye Movement Percentage ... 40!
2.7.3! Saccade Latency Removal of Outliers ... 42!
2.7.4! Saccade Latency Results ... 42!
2.7.5! Saccade Peak Velocity ... 46!
2.7.6! Saccade Amplitude ... 46!
2.8! METHOD MOTOR TASK ... 48!
2.8.1! Participants ... 48!
2.8.2! Method ... 48!
2.8.3! Reaction Time Removal of Outliers ... 48!
2.8.4! Reaction Time Results ... 48!
2.8.5! Eye Movements Removal of Outliers ... 52!
2.8.7! Saccade Latency Clean ... 54!
2.8.8! Saccade Latency Results ... 54!
2.9! DISCUSSION ... 55!
2.9.1! Reaction Time ... 55!
2.9.2! Eye Movements ... 56!
3! CHAPTER II ... 60!
REDUNDANCY GAINS IN POP-OUT VISUAL SEARCH ARE DETERMINED BY TOP-DOWN TASK SET: BEHAVIOURAL AND SACCADIC EVIDENCE. ... 60! 3.1! ABSTRACT ... 60! 3.2! INTRODUCTION ... 61! 3.3! METHOD ... 64! 3.3.1! Participants ... 64! 3.3.2! Apparatus ... 64!
3.3.3! Stimuli and Design ... 65!
3.3.4! Procedure ... 67!
3.4! RESULTS ... 67!
3.4.1! Reaction Time Removal of Outliers ... 67!
3.4.2! Errors ... 67!
3.4.3! Reaction Time Results ... 68!
3.4.4! Eye Movement Percentage ... 71!
3.4.5! Reaction Time Results for Eye Movement Trials ... 72!
3.5! SACCADE LATENCY ... 73!
3.5.1! Saccade Latency Removal of Outliers ... 73!
3.5.2! Saccade Latency Results ... 74!
3.6! DISCUSSION ... 77!
4! CHAPTER III ... 81!
WALDO REVEALS CULTURAL DIFFERENCES IN INHIBITION OF RETURN ... 81! 4.1! ABSTRACT ... 81! 4.2! INTRODUCTION ... 82! 4.3! METHODS ... 86! 4.3.1! Participants ... 86! 4.3.2! Eye Tracking ... 86!
4.3.3! Stimuli and Procedure ... 86!
4.3.4! Eye Movement Preprocessing ... 88!
4.3.4.1! One-back and Two-back Fixation Distribution ... 88!
4.3.4.2! Statistics on One-back and Two-back Fixation Distribution ... 89!
4.4! RESULTS ... 90!
4.4.1! Search Performance ... 90!
4.4.2! Eye Movement Results ... 91!
4.4.2.1! Analysis on the One-back and Two-back Fixation Distribution ... 91!
4.5! DISCUSSION ... 94! 4.6! CONCLUSION ... 96! 5! GENERAL DISCUSSION ... 97! 5.1! IMPLICATIONS ... 100! 5.2! FUTURE DIRECTIONS ... 101! 5.3! FINAL REMARKS ... 102!
6! REFERENCES ... 103!
1
Introduction
In order to interact with our environment every being (creature) on this earth is equipped with senses or sensors permanently collecting information from our surroundings. This input comes as a vast stream, flooding the different input channels, providing us with information about every little detail around us. Over time, evolution has brought forward many different species, each equipped with the appropriate senses or sensors to receive signals relevant for their survival. As some animals with poor vision have a more enhanced sense of smell or even a sophisticated sonar navigation system, like the bat for example, each species owns a system, which is most functional to their lives. To each of these animals the world appears differently, presenting itself most relevant to their behavior and rich in viable signals. For some insects, for example, there are attracting patterns visible on flowers, which are invisible to us (Figure 1). This makes sense in the way that neither we need to discover these flowers for our survival nor do the flowers depend on us to spread their pollen.
Figure 1. Evening primrose (Oenothera biennis): To the human eye the flower looks
solid yellow but insects can aim for the bullseye in the centre. [Bjorn Roselett Professional Nature Photographer, (2008). Oenothera biennis [Photograph]. Retrieved March 04, 2015 from: http://www.dailymail.co.uk/sciencetech/article-473897/A-bees-eye-view-How-insects-flowers-differently-us.html#ixzz246hRn23i.
The fact that the world appears to us as it does, already accounts for the first stage of information filtering. Only perceiving signals that are relevant to our survival presents the world in a manner best suitable to our behavior. Still, exhaustively processing all information perceived by our senses would soon lead to an overload of our cognitive resources (Broadbent, 1954) paralyzing us in every action. Which information becomes relevant to our behavior or our intentions must be somewhat selected and given a priority at certain moments in time. Evolution has solved the problem of selection by providing us with the mechanism of ‘attention’. Over the past thousands of years, our senses and especially our visual system has succeeded in guiding our perception of our surroundings, making it possible to maneuver through the world, securing our continued survival. As a basis for understanding the visual system, the following section is going to describe our sense of sight with its anatomical and neural specifications. From the moment we wake up in the morning until we shut our eyes to fall asleep at night, our eyes function like active video cameras sending all information to our brain. The organs involved are the eyes, part of the central nerve system including large areas of the brain. What we take for granted and describe as ‘seeing an object’ are actually electromagnetic waves bouncing of an object and traveling into our eyes. The following section is going to functionally segment the phenomenon of seeing according to the eye’s anatomy from the front to the back.
1.1 The Eye
The visual system transforms electromagnetic waves within the visible range (about 390-750nm), into a representation of the world around us (color, shapes, sizes, patterns, etc.). An illustration of the anatomical components of the human eye can be seen in Figure 2. Its composition is often compared to that of a camera. Whereas the camera leaves us with a two-dimensional copy of the viewed scene, our brain creates three-dimensional objects with depth and meaning. The eyes feed the brain with electrical impulses, which the brain codes into neural activity, translated into the perception of objects. Light enters through the lens, which is a transparent, biconvex structure at the frontal part of the eye. Its elastic characteristic allows refracting of entering light onto the retina. There, light is transformed from electromagnetic waves (light) into electrical pulses - the language of the nervous system (Gregory, 1978, p. 60). The retina is equipped with two types of photoreceptors: rods and cones, which
are densely populated on the retina with an exceeding distribution of cones at its central region, called the fovea (for more detail see section Fovea, Parafovea and Periphery). There are approximately 120 million rods and 7 million cones on the retina. The cones are more sensitive to chromatic light (daylight vision) whereas the rods respond to more sensitive dim and achromatic light (night vision) (Duchowski, 2013). For a more detailed description of the physiological optics and the cells within the retina, see (Hendee & Wells, 1997). Further, the electrical transposed visual information travels across the optic nerves via visual pathways, towards higher cortical areas.
Figure 2. Anatomy of the eye, form outside and inside view. Retrieved May 26, 2015
from: http://www.uchospitals.edu/online-library/content=CDR258015.
1.2 The Fovea, Parafovea and Periphery
The fovea describes the central two degrees of the retina. A 1.5 mm diameter rod-free area characterized by a high density of cones (Polyak, 1941), resulting in the highest
degree of visual acuity. The region immediately surrounding the fovea by a 0.5 mm ring is called the parafovea, beyond which the remaining area is termed the periphery. With further distance away form the fovea visual acuity deteriorates (Anstis, 1998). Figure 3 demonstrates the perceived acuity of a retinal image.
A) B)
Figure 3. A) Image of the author originally taken by a camera. B) Image of the author
blurred by applying radial blur, simulating the progressive loss of acuity with eccentricity.
Peripheral vision is outside of the stereoscopic vision. It can be conceived as bounded at the center by a circle 60° in radius or 120° in diameter, centered around the fixation point, i.e., the point at which one’s gaze is directed. The normal human visual fields extends to approximately 60° nasally from the vertical meridian in each eye to 100° temporality from the ventral meridian, and approximately 60° above and 75° below the horizontal meridian.
1.3 Eye Muscles
To allow the highest visual resolution to be altered across the visual field, the eye is constructed in a way, which allows it to move. The eye lies in the orbital socket where three antagonistic muscle pairs manipulate its position (illustrated in Figure 4). The
lateral and medial recti together control the horizontal position. A contraction of the lateral rectus of the left eye and a relaxation of the medial rectus of the left eye would produce a left sided turn of the eye. The second pair consists of the superior rectus and inferior rectus. Together this pair controls the vertical movement of the eye. A contraction of the superior rectus and relaxation of the inferior rectus would elevate the eye whereas the opposite would depress the eye. In combination with horizontal deviation this muscle pair also contribute to torsion eye movements. The final muscle pair is the superior oblique and inferior oblique. Their main function is the torsion of the eye, making the top of the eye rotate nasally and the bottom of the eye temporally. Additionally in combination with horizontal shifts the oblique muscle pair supports vertical eye movements. These three muscle pairs allow the eye to be moved along three axis of rotation (horizontal, vertical and torsion) making it possible to guide any object in the field of view onto the fovea.
Figure 4. Illustration of the right eye and its extra-ocular muscles (lateral rectus,
medial rectus, superior rectus, inferior rectus, superior oblique and inferior oblique). Retrieved May 26, 2015 form: http://www.begin2dig.com/2010/08/eyes-have-it-sometimes-using-eye.html.
1.4 Eye movements
Having discussed the anatomical properties of the eye and its muscles, the following paragraph will focus more on its functional categorization. Eye movements are our fastest and most frequent muscular activities. We move them over 100’000 times each
day which breaks down to about three times per second. They can be distinguished in their function to stabilize or to shift gaze. Gaze stabilization is necessary if we want to keep our visual inspection fixed on a specific area either while stationary or when in motion with respect to our surrounding (e.g. looking at a tree out of a moving train). To keep the retinal image on a high resolution, and therefore on the fovea, the eyes need to be held steady or have to compensate any self-motion. During gaze shift however, the eyes move while the body or head stay still. This enables us to sweep through our surrounding with minor effort (e.g. reading). There are two main types of eye movement relevant to visual experiments: fixations and saccades. Fixations keep the visual gaze stable on a single location, allowing sufficient time for its exploration. Characteristically fixations last for 200 – 500 ms but increase depending on the depth of analysis. Saccades are fast ballistic movements between fixations. A typical saccade lasts about 30 ms with an average latency of 150 – 250 ms (Krauzlis, 2008). Depending on the saccade amplitude, the duration increases by 2-3 ms per degree and leaves us blind during the time of travel.
1.5 Eye Tracking
Knowing that we move our eyes to gather information about our surroundings renders the recording of eye movement interesting. With data about the oculomotor behavior, researchers infer cognitive models about the visual information processing. The following paragraph gives a brief technical explanation on how eye movements are tracked. The development of eye-tracking techniques date back to the early nineteen hundreds (for a historical overview on eye movement research see (Wade & Tatler, 2005). Currently there are three types of eye-tracking methods in practice. Firstly and most intrusively, the scleral search coil, measures electromagnetic induction from a metal ring, placed on a contact lens, within a magnetic field. Secondly, electrooculography (EOG) records the electrical activity generated by the eye muscles with electrodes attached to the side of each eye. Thirdly and least intrusive, video-based eye trackers use a continuous image of the pupil to follow its movement and compute the current gaze position. For a thorough historical and technical overview on the different eye-tracking methods consult the excellent review by Duchowski (2013). In this thesis, a video-based desktop-mounted eye-tracking device, namely the Eyelink 1000 (SR research, Canada) was used. The Eyelink uses an infrared sensitive camera
to pick up the reflection of an infrared light source. Both are mounted beneath a testing monitor directed towards the participant. The benefit of using an infrared light is its invisibility and harmlessness to the eyes. Two reflections from the pupil and the cornea are detected and allow for calculation of eye rotation. While the corneal reflection stays stable due to the bulb shape of the eye, the pupil’s reflection rotates along with changes of gaze direction. Differences between these two signals in combination with a simple calibration (nine points on the screen) allow for calculation of gaze direction on the screen. Although minor head movements can be balanced out by the corneal reflection, a headrest can provide further stabilization of recording. Next, the continuous stream (a data point each 2 ms on a 500 Hz resolution) of temporal and spatial information of gaze direction is distinguished into different meaningful events such as blink, fixations and saccades. While identification of a blink follows a gap of data recording due to the closing of the eyelid, fixations and saccades are identified on the basis of an empirical velocity-threshold. Data points below the threshold are summed to a fixation, whereas data points above the threshold become a saccade.
Relevant variables for this thesis are the following:
Fixation duration: the time the eyes spend on a specific location.
Number of fixations: the maximal amount of fixations within one experimental trial. Fixation location: the area of the visual display in exploration
Number of saccades: maximal amount of saccades within one experimental trial. Saccade peak velocity: the maximum speed at which the eye moved across the display. Saccade latency: the time between display onset and first movement of the eye,
indicating the time it took to program the movement.
1.6 What Drives the Eye?
Given the potential sequences of fixations and saccades when exploring a visual scene, the nature of control over eye movements can have different origins. For example, as you are reading this, you have voluntarily decided to direct your eyes onto this page, scanning the text, reading these words. As you turned to this page, however, you could not help but notice the black dot at the top right corner. Whereas goal-driven movements are directed by the intention of the observer, stimulus-driven movements are solely dependent on stimulus properties (also known as saliency). Michael Posner
(1980) was one of the first to show these two different attentional deployments with his cueing paradigm. Whether or not, you actually made an eye movement towards the dot is yet another question. For example you can continue reading this and determine whether the black dot has a white disc in the center without moving your eyes towards it. Yet, knowing if it casts a shadow is only possible after fixation. In order to understand what is going on during the example above, we need to keep in mind, that there is an underlying process at work, namely visual attention. In attention research eye movements are referred to as overt shifts of attention, whereas the scanning of a scene without eye movements is termed covert shift of attention. The analogy of a ‘spotlight’ is commonly used to describe the way that covert attention is shifted among items within a visual scene (Posner, Nissen and Ogden, 1978). Posner’s cueing paradigm is an experimental procedure, in which observers are presented with a probable valid visual cue and need to quickly respond to an appearing stimulus. Additionally, Posner used endogenous (an arrow at the location of the fixation cross) and an exogenous cues (a flashing of the stimuli location) to direct the observer’s attention. Independently of cue type, observer show a speeded response for valid cue trials, evidencing a successful preceding shift of attention. With this experiment Posner showed that, stimulus feature, just as, observers volition can guide attention. The case of the stimulus properties guiding attention is referred to as bottom-up process. Any voluntary or knowledge-based control is referred to as top-down process (Carrasco, 2011). The relationship between bottom-up and top-down influence on search stays widely discussed (Connor, Egeth, & Yantis, 2004; Pinto, van der Leij, Sligte, Lamme, & Scholte, 2013) and is subject to theories of visual attention. First experiments in visual search come from Treisman and her colleagues using the visual search paradigm.
1.7 Feature-integration theory
One of the first to publish a theory about the selection process was Anne Treisman (1988; 1980). Her Feature Integration Theory (FiT) of selective attention explains how for example a target object is selected among other distracting objects. The FiT operates in a two-step fashion first coding each object in the scene into its single features (color, orientation, spatial frequency, brightness, direction of movement, etc.) and then, in a second step binding (joining) these features together to form an apparent
object. The main assumption of the FIT is that each object can be broken down into its features. Certain features together form a higher order classification called dimension. The brain’s architecture corresponds to these features with cells in the area V1, which respond to certain orientations or light-dark contours (Conway, Hubel, & Livingstone, 2002; Livingstone, Freeman, & Hubel, 1996). Importantly, the FiT assumes that in the first step “simple features can be detected in parallel with no attention limits” (Treisman & Gelade, 1980, p. 99). The second step, however, requires focal attention, that “provides the glue which integrates the initially separable features into unitary objects” (Treisman & Gelade, 1980, p. 98). These objects are then compared with stored representations for recognition. Depending on the nature of the stimuli a search can already be successfully completed after the first step, which would be the case for stimuli distinguishable by simple features (e.g., looking for a red vertical bar among green vertical bars) – a so called feature search (see Figure 5a) - or require the second step of focal attention to bind conjoined features for the detection in a more complex stimuli environment (e.g., looking for a red vertical bar among green vertical and red horizontal bars) – a so called conjunction search (Figure 6b). The two-step architecture of the FiT splits the notion of search into a pre-attentive (effortless) search and an attentive (capacity-limited) search. In the latter case, search time analysis has lead to the assumption that attention travels from one object to the next, binding their features to discern the current object from previous investigated object locations. Therefore spending more time to serially search a display with increasing set size.
a) b)
Figure 5. Two possible search displays. A) shows a feature-search with the red
vertical bar (target) popping out between the green vertical distractors. B) shows a conjunction-search (distractor sharing feature with target). The target is the green horizontal bar.
1.8 Limitation of the Feature Integration Theory
Research investigating into the FiT provided counterevidence to the idea of the strict dichotomy of search into parallel or serial processes. Nakayama and Silverman (1986) found the conjunction of dichoptic separation and color to produce flat search functions across increasing set sizes. Observers were able to “perform a parallel search in one depth plane without interference from target-like distractors in another depth plane” (Nakayama & Silverman, 1986, p. 265). With this experiment, Nakayama and Silverman could show that within a complex search environment, attention can be restricted to a certain dimension (in this case depth plane) and operate in a parallel manner within this separation. Using the same line of criticism, Wolfe has argued that, “all searches require the deployment of attention to the target and that different tasks vary only in the degree to which they can use parallel processes to guide the deployment of attention” (Wolfe, 1998, p. 33). In regard to the reaction time slopes this translates into more attentional guidance yield shallower slopes (Wolfe, 1994). Cave and Wolfe (1990) picked up on these limitations and developed an advanced theory, namely the guides search theory.
1.9 Guided Search Theory
Similar to the FiT the guided search (GS) theory by Cave and Wolfe (1990) resumes the idea of a two-stage architecture of selective attention. However, this time describing how attention is allocated to certain locations by a so called "saliency signal". Again, this model assumes that the visual field is represented by a set of modules each of which representing basic attributes of the stimulus. In this case these basic attributes are summarized on dimensional maps (e.g., color, orientation, size, etc.) representing subordinate features. Each dimension specific modules simultaneously computes a salience signal for every object location, signaling how different it is compared to the surrounding information within the same module. In other words, objects are still broken down into their features, yet represented in a dimensional manner including more than one feature. A dimension map representing one red target among green distracters, for example, would have the highest amplitudes of activation at the location of the red target indicating its greatest overall difference. Thus, dimension-based salience signals are integrated into an overall map
of activation. Focal attention will be allocated to the location of highest activation. To
illustrate the different results during simple and conjunction search tasks the GS can contribute as follows. During conjunction tasks the target shares certain features with the distracters making them more similar, and therefore, the saliency signal less discriminative from other signals. Thus, overall activation of the target will not be at large difference to distracters forcing focal attention to serially inspect target candidates before detecting the target. During simple search, however, the target-defining dimension triggers a saliency signal of remarkable difference compared to distracters leaving only one possible location for target detection. The difference between the FiT lies in the introduction of a master map signal deploying the attention to the location of highest activation. This means that attention is not required to bind feature information for certain objects, rather the highest saliency signal attracts attention.
1.10 Visual Search Paradigm
In a typical visual search task, observers are presented with a variable set of visual stimuli. Each display contains a number of distractor items and may hold a specific
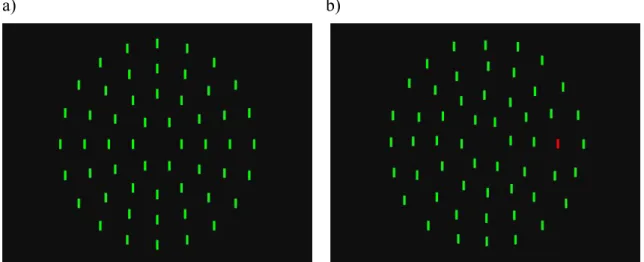
target item. The total number of items presented on a display is referred to as the ‘set size’. In a display there is either a target present or absent, and the observer’s task is to rapidly decide by pressing a predefined target-present or target-absent button. The type of stimuli used are usually artificial, yet meet the analogy to search behavior in the real world. For example looking for one red vertical bar among a variable number of green vertical bars (Figure 6). The time form display onset until button press is termed reaction time (RT), which in relation with the set size results in a search RT function (slope). Differences in search slopes lead to two distinct modes of visual search, which by the Feature-integration Theory (FiT) have been termed parallel- and serial-search.
a) b)
Figure 6. Example for a feature-search target-absent trial (a) and a target-present trial
(b); set size is 54
1.11 Overt and covert attention
The theories summarized above characterize the spread of covert attention in visual search. Note that both theories, the feature-integration theory (FiT) and the guided search (GS) disregard any eye movements and postulate item search times at speeds well below the threshold for eye movements (Treisman & Gelade, 1980; Wolfe & Horowitz, 2004). Recall that attention can be allocated either covertly or overtly across the visual field. Therefore it seems somehow logical that visual attention and eye movements must have some relation to each other. Yet the link between overt and covert attention remains unclear. A possible explanation is that these two processes are completely independent of each other (Klein, 1980). A target may draw both covert and overt attention, however each system receiving an independent signal, without any causal link between these mechanisms (Remington, 1980). Recent evidence for an independent approach comes from Hunt and Kingstone (2003) showing no benefit of
stimuli detection when programing a saccade to that location in advance. As an alternative, covert attention may be a forerunner of overt attention, in order to program a saccade towards a location of interest (Shepherd, Findlay, & Hockey, 1986). In this case, overt shifts depend on preceding covert shifts of attention without the inverse being possible. Deubel and Schneider (1996) conducted an experiment where saccade location could coincide with a possible target location and investigated the precision of detection. Participants showed higher accuracy when the target fell on the saccade location compared to any mismatch of saccade location and target location. The authors relate the response enhancement to a strong coupling between both systems and term their findings ‘preview benefit’. The final alternative for the link between covert and overt shift of attention is put forward by the “premotor hypothesis” by Rizzolatti, Riggio, Dascola and Umilta (1987). The main idea being, that covert attention solely serves to prepare saccades towards target locations. And only a go-signal executes that program. There is no separation between the underlying mechanisms of attention and eye movement, rather a combination into a single oculomotor program. Conclusively, there is still more research required to settle the debate on the nature of the relationship between attention and eye movements. Irrespective of the nature of the relationship between both systems, eye movements remain a useful measure of information processing. In regard to visual search, Zelinsky and Scheinberg (1997) investigated eye movements during parallel- and serial-search. They linked eye movement measures to manual reaction times (RTs) and found correlations between the number of fixations and RTs. An increase in set size resulted in additional saccades for serial but not for parallel search. Putting forward that during parallel-search eye movement do not contribute to successful task completion. Again, one can say that parallel-search is strictly solved by the covert attentional mechanisms. In serial-search however, eye movements engage in finding a target among strongly disturbing distracters with more saccades being required for larger set sizes. The resulting longer RTs for serial-search can therefore be accounted by the search interruption during the execution of saccades. Support also comes from the increase in saccade number for absent- compared to present-trials with a ratio of 2:1. Additionally to RT analysis, eye movement analysis allows the integration of participants natural search behavior and fosters development of search theories.
1.12 Current Investigation
The goal of this work is to contribute to the understanding of the interplay between overt and covert attention during visual search. The environment serves as a great place of stimulation and we navigate following two main strategies: first, stimuli around us compete for attention of our sight to attract us towards beneficial objects (food) or away from detrimental objects (potential threat). This means our system is set to rapidly detect specific stimulus properties. Second, with our great set of cognitive skills we can alter our perception to follow our self-set goals and plans to fit our needs. We therefore integrate different information necessary to succeed in daily visual tasks and seemingly achieve this by relying on the visual processes. Here, I will focus on the visual selection and processing of information. In general the visual system contributes along different aspects to form a suited sense of tackling daily problems. First of all it is subject to development over the time course of maturation. In chapter I, I will focus on specific eye movement parameters and their development along childhood in a typical visual search paradigm. In daily life we see people of all ages visually orienting themselves in the environment. You can walk along a street avoiding other people crossing your path, greet a recognized face and look for traffic signal ordering you to stop walking. You share this with all the people that surround you and their behavior will be guided accordingly. Yet it is not unusual to observe that children often requiring a lot of time in a search for their desired toy in their room or have difficulties to direct their focus onto a designated task when there are other things happening around them. It is obvious that there are some components of the visual system that underlie maturation and improve with age. Especially in a designed visual search experiment we can investigate such differences on a millisecond level for behavioral output such as manual response time and oculomotor parameters. After having explored how certain parameters develop over time, chapter II focuses on the bottom-up and top-down influence on information processing. In other words, our system adapts depending on requirements set by the stimuli or the task. Again, behavior in a visual search is altered by either the stimulus properties or the observer’s intentions. While the redundant single effect is known for manual reaction times, its effect on the oculomotor system is yet unclear. Looking for a friend within a crowded place becomes much more efficient if that person is wearing a hat distinguishable from others in a combination of color and shape for example. In the laboratory this translates into a target differing from distractors by color and shape. If the oculomotor
system however responds with the same advantage as the covert shift of attention stays yet to be investigated. Any oculomotor benefit would speak for an effect on an early level of information processing rather than a late effect on the response level. Additionally, the observation of the same redundant signal effect across manual and saccadic reaction times supports a strong link between the oculomotor and the attention system. To conclude the idea of this work to explore known factors influencing perception the third chapter aims for an intercultural comparison. From the impact development has on the system (chapter I) to factors more dependent on stimuli and task set (chapter II), chapter III will expand the visual stimuli from the basic visual search paradigm to a more complex scene search with the emphasis to investigate the influencing factor culture has on perception. Over the past years research has accumulated evidence that people form Western and Eastern cultures differ in their cognitive mind-set, postulating that Westerners are more analytic and Easterners more holistic. While looking for Waldo, known to hide in cluttered scenes, I will investigate the search pattern of observers of both cultures to explore yet another influencing factor on attention, namely culture. Specifically, I will be looking for the mechanism known as inhibition of return, which I assume shows a direct influence of the analytical and holistic cognitive style prone to the observers of specific cultures. To sum up, this work will pivot on developmental, bottom-up, top-down and cultural influences on the control of eye movements.
2
Chapter I
Saccadic and Motor Development in Feature Search in Children
2.1 Abstract
While the characteristics of saccadic eye movements have been extensively studied in adults, oculomotor data on children and adolescents are scarce and contradictory. In this study we recorded eye movements of 160 children aged five to 13 years. Children completed two visual search tasks. The first task involved visual search for targets that differed from distractors (green vertical bars) in color (red or blue) or orientation (tilted to the left or right). Children had to manually indicate the presence or absence of a target by button press. Manual reaction times (RTs) were recorded along with eye movements. The results showed a decrease of manual RTs and saccadic latencies, that is, the time between display onset and the initiation of the first saccade with increasing age. Saccade peak velocity is higher in younger (age 5 to 7) compared to older children (age 9 to 13). In the second task, the same visual displays were shown as in the first task, however, children had to respond by pressing, as quickly as possible, a single button at display onset, irrespective of whether a target was present in the display or not. Manual RTs of the second task, together with the search RTs of the first task, allow differentiating a sensory-motor component and a cognitive component reflecting visual search and response selection. The results show that the completion time of the cognitive component decreases with increasing age; further, decreasing saccadic latencies were again found with increasing participant age. Since the detection of the target was not task relevant, older (age 10 to 13) children showed a reduced frequency of eye movements in the second task compared to younger (age 5 to 7) children.
2.2 Introduction
Across our life span we orient ourselves through the visual sense starting at the instance we first open our eyes to the point of our terminal blink. That is, people are typically looking for an object within a distracting environment. Be it a child looking for a specific Lego-piece in a box, or later, as an adult, locating one’s car key on the desk. Research on the development of visual search suggests that search proficiency increases from childhood to adulthood, culminating in adolescence (Trick & Enns, 1998). In regard to search speed Trick and Enns (1998) describe an inverted U-shape function as the common pattern in information processing across life span. So far, the typical method of investigating such developmental differences has been the measure of reaction time (RT) and accuracy within the two typical search types of feature
search and conjunction search. Whereas in a feature search one is looking for a
single-defined target among homogeneous distractors (red vertical bar among green vertical distractor bars), in a conjunction search, one has to detect a target defined as a conjunction of features shared with heterogeneous distractors (a vertical red bar among vertical green and horizontal red distractor bars). Based on visual search theories (e.g. Treisman & Gelade, 1980; Wolfe, 1994) the two search types explained in the introduction section of this thesis, evoke different underlying search mechanisms. In
feature search, all objects are processed in parallel making the target literally pop out
of the display, whereas in conjunction search each object has to be serially checked in order to find the target. RT analysis support the idea of different search mechanisms by showing prolonged search times for serial- compared to parallel-search. While the visual search paradigm has merely been devoted to examining the spread of covert attention, Zelinsky and Scheinberg (1997) investigated the overt shift of attention (i.e., eye movements) during parallel and serial visual search. They reported high correlations between the number of saccades made and response times during search. Although the nature of the relationship between attention and eye movements is cause for much debate, Deubel and Schneider (1996) speak of a “close coupling between visual attention on the one hand and saccade programming on the other” (p. 1836). For any further elaboration read the section about overt and covert attention. In spite of considerable interest in the development of selective attention and the saccadic control in children, surprisingly no study has investigated children’s eye movement parameters in visual search. Combining both sources of information, search time and eye movement data, promises to contribute to the understanding of developmental
differences in search processes. Thus, we collect data by two measures investigate behavioral and oculomotor parameters of visual search in children. The succeeding paragraph gives a summary of reaction time results, followed by findings on eye movement data across childhood.
2.3 Visual search in children
2.3.1 Reaction time
Early studies testing the Feature Integration Theory (FIT) by Treisman and Gelade (1980) comparing search times between children and adults showed that children lag in processing speed compared to adults (Lobaugh, Cole, & Rovet, 1998; Thompson & Massaro, 1989). Thompson and Massaro tested preschool children’s (4 to 5 years of age) responses towards a target differing in brightness or size from a set of distractors (set size: 4, 9, 16 and 25). Reaction times augmented with set size for serial-search but not for parallel-search in children as well as for adults. Although these results correspond to the pattern of FIT, children had a higher Y-intercept in regard to their reaction time functions than adults. Higher Y-intercepts represent an overall augmented reaction time, which is composed of distinct processing components, such as response choice and execution. To disentangle the motor response from the overall search time, Hommel, Li and Li (2004) introduced a simple RT task in which participants responded to any single stimulus (square or circle) appearing on the center of the screen. In the age groups of 6 to 22 years, the comparison between RT in a single-item (simple RT) and RT in a two-item feature search showed a significant interaction, describing an acceleration of mere motor response time with increasing age up to adulthood. Further, in their results concerning feature search across the life span (6 to 89 years) they included simple RT as a covariant, providing an almost pure search time analysis across age groups. In regard to the relation between RT and age, they reported an U-shaped function with slower search times for participants at either side of the continuum. The authors suppose however, the underlying processes to be different. In summary, children need more time to locate and respond to targets within a set of distractors compared to adults. Some of this delay is caused by slower responds executions, yet leaving a temporal margin for any differences occurring during search phase. Although, acceleration in search speed along childhood has been confirmed in a number of studies (Hommel et al., 2004; Thompson & Massaro, 1989),
the exact mechanisms responsible could not be identified. Some authors argue along the side of neurological development (i.e. myelination) to be responsible for faster information processing and therefore leading to speeded responses (Gerhardstein & Rovee-Collier, 2002; Trick & Enns, 1998). Others make different search strategies accountable for temporal differences in basic feature search (Donnelly, Cave, & Greenway, 2007). Reaction time differences between colored and oriented targets found by Donnelly and Cave (2007) and Lobaugh et al. (1998) in the range of 6 to 8 year-old children (7-8 years in Lobaugh et al. (1998); 6-7 years in Donnelly & Cave (2007) supply evidence for dissimilar processing on the basis of a single dimension. Additional support in line with processing differences occurring before the age of 8 years come form a study investigating the ability to categorize objects into its dimension or features. Grubert, Indigo and Krummenacher (2014) showed that children prior to the age of 8 years categorize a target within a feature search by its feature (red or blue; left or right tilted) rather than by its dimension (color; orientation). Using the paradigm of inter-trial-transitions (Müller, Heller, & Ziegler, 1995), in which the target’s feature is either repeated or changed across two consecutive trials, switching cost occurred on the feature level for children aged below 8 years and on the dimension level for older children up to adulthood. Thus, supplying a possible explanation for differences in processing time of visual stimuli prior to the age of 8 years. To further enquire about differences in visual search strategies or abilities across development, measurement of eye movement make a promising candidate, as they correlate with RT performance (Zelinsky & Sheinberg, 1997). The succeeding paragraph gives a summary of findings on eye movement data across childhood.
2.3.2 Eye movements
As just described, RT could be broken down into mere motor response time and search time. Adding eye movement recordings as a measurement during search, allows for a more detailed insight into what is going on during search time. In the past three decades much has been learned about the eye movements system (for a review see Kowler, 2011). Most of the research, however, has been carried out on human adults or primates, whereas little research bas been directed to these parameters in children. The oculomotor behavior develops in several stages along childhood. For instance, the
ability to fixate develops during the first months (Chandna, 1991), yet is still reduced in children aged 4 and 5 years old (Kowler & Martins, 1982). For example, if participants between the ages of 4 to 15 years are asked to fixate a target, fixation duration increase and the number of reflexive saccades decrease with age (Aring, Grönlund, Hellström, & Ygge, 2007; Ygge, Aring, Han, Bolzani, & Hellström, 2006). Additionally, between the ages of 8 to 10 years the capability to persist fixation in the presence of peripheral distractors increases. Paus, Babenko and Radil (1990) thus suggest, that cognitive control of fixation mature up to the age of 10 years. Brain development, such as the neuronal evidence of synaptic pruning and myelination contribute to the maturation of cognitive control (Luna, Velanova, & Geier, 2008). Their behavior outcomes on the deployment of eye movement however, stay ambiguous. While some studies found saccade latencies to be shorter in young adults compared to infants and children (Irving, 2006; Klein, 2001; Yang, Bucci, & Kapoula, 2002), others like Accardo, Pensiero, Da Pozzo and Perissutti (1992) and Wilson, Glue, Ball and Nutt (1993) failed to find these early developmental differences. Their findings showed an increase in saccade latency for elderly subjects. Munoz, Broughton, Goldring and Armstrong (1998) investigated saccade latencies of subjects across an age range of 5 to 79 years, describing an asymmetric ‘U’-shape function with the lowest plateau for subject between 18 to 22 years of age. They found the explanation of developmental processes and normal degeneration to fit this pattern. The standpoint on the influence of age on saccade peak velocity is still under considerable debate, since all possible outcomes have been reported. For example, Accardo (1992) and Irving, Steinbach, Lillakas, Babu and Hutchings (2006) noted saccadic peak velocities to be higher in children (< 7 years) than in adults, additionally Fioravanti, Inchingolo, Pensiero and Spanio (1995) tested 12 children aged 5 to 13 years of age, with the younger children (5 to 9 years old) producing saccades greater in peak velocity than those of older children (11 to 13 years old) and adults. In contrast, Matsuzawa and Shimojo (1997) showed no difference in saccade peak velocity for infants compared to adults. In contrast, Munoz et al. (1998) and Fukushima, Hatta and Fukushima (2000) could not find any age-related differences in saccadic peak velocity. Apparent from these controversies around the relationship between age and eye movement dynamics, further investigations are required to obtain constant results. A concluding remark concerning most of the studies investigating saccadic eye movements in children yields the strict use of the pro- and anti-saccade task. Subjects
are instructed to repeatedly move towards a single saccade goal, set at defined distances from the initial fixation point. Additionally, due to historical and technical reasons most studies limit their investigation to only horizontal movements, isolating eye movements as a mechanical motion rather than a search instrument. This could explain the different results obtained, in previous studies using different settings such as different stimuli or distances. Considering the strong linkage between eye movements and visual attention (Deubel & Schneider, 1996; Hoffman & Subramaniam, 1995) it is advised to use the visual search paradigm for a combination of attentional and oculomotor measurement. As authors like Posner (1980) and Rizzolatti et al. (1987) have argued that an allocation of attention is imperative for an eye movement, the outcome on these recordings would shed light into the processes between display onset and manual response from an attentional and oculomotor perspective. In contrast to the pro- and anti-saccade task, examination with the visual search paradigm emulates finding a target object among distractor objects. Setting a stage for the interplay between selective attentional mechanisms and oculomotor control and therefore being closer to a natural search behavior. No study until now has looked at eye movement data in combination with manual reaction times in a visual search performed by children.
The present study reflects an attempt to examine oculomotor age differences in visual search across early childhood. To present a manageable and comparable task for all age groups we had children perform a feature-search task and a motor task. Moreover, we generally focused on global information-processing aspects that are expected to improve in early life. With the addition of oculomotor measurements the search time is segmented into more concise units allowing deeper understanding of what is going on during search.
2.4 Method Search Task
2.4.1 Participants
160 pupils from the primary school Obernau, Kriens (Switzerland), took part in this experiment. There were 76 female and 84 male. Children of all classes were tested: 34 from kinder garden (KG), 20 from 1st class, 24 from 2nd class, 9 from 3rd class, 30 from 4th class, 23 from 5th class and 20 from 6th class. All participants had normal or
corrected-to-normal vision and were naive to the purpose of the experiment. Two participants aborted the experiment due to motivational reasons (did not want to continue).
2.4.2 Materials
Participants, were seated in a darkened room (to avoid reflection on the screen), viewed the stimuli on a LCD 17“ color monitor run at a resolution of 1280 pixels horizontally and 1024 pixels vertically and a temporal resolution of 60 Hz driven by an Intel Core 2 Quad CPU 2.66GHz PC running Windows XP and MATLAB (R2008b). A desktop-mounted, video-based infrared eye-tracking system was used (Eyelink I, SR Research, Ontario, Canada) with a spatial resolution of 0.1° and a temporal resolution of 500 Hz. The experiment was written in MATLAB, using the Psychophysics and Eyelink Toolbox extensions (Brainard, 1997; Cornelissen, Peters, & Palmer, 2002; Pelli, 1997). Participants could move their head freely, however were instructed to keep it as still as possible at a distance of 60 cm of the display.
2.4.3 Stimuli
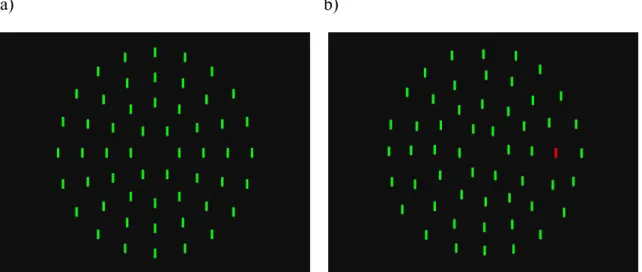
Stimulus display consisted of 54 bars arranged around four imaginary circles centered in the middle of the screen (see Fig. 7 for illustration of a possible search display). The inner most circle holding 6 bars with a radius of 80 pixel (2.73°), the outwardly circles holding 12 bars (radius: 160 px (5.45°)), 16 bars (radius: 240 px (8.17°)) and 20 bars (radius: 320 px (10.88°)). All stimuli were independently jittered by +/-30 pixel (1.02°). Presentation of target items was restricted to the inner three circles resulting in 34 possible target positions (1 to 34).
The bars were 1.02° of visual angle in height and 0.27° in width. The titled bars were rotated either 45° to the left or to the right (red: VGA RGB 255,0,0; green: RGB 0,255,0; blue RGB 0,0,255; black screen background RGB 15,15,15).
a) b)
Figure 7. Search task: target-absent trial (a) and a target-present trial (b); set size is 54
2.4.4 Design
Prior to the experiment, participants were told to search for a target bar, differing from green vertical distractor bars either in color (red, blue) or in orientation (left, right). The task was to rapidly indicate, by button press, whether a target item was present in the display or not (left: absent, right: present). Apart from this instruction no reference to eye movements was made.
The experiment consisted of six blocks whereas the first block served as practice block, which was not included in the analysis. Overall, participants completed 200 experimental trials.
2.4.5 Procedure
Before every session participants underwent a 10-point calibration and before every block a drift correction was applied. Each trial started with the presentation of a white central fixation cross (‘+’ Times, 20 pt.) for 500 ms, followed by a black screen for 500 ms before the search display was presented. The search display was presented until the participant gave a manual response. Between each trial a black screen was interposed for 1000 ms. Between blocks, participants were encouraged to take a break.
2.5 Method Motor Task
2.5.1 Participants
The same pupils also participated in the motor task except for four participants who did not complete the experiment due to motivational reasons (did not want to continue), leaving a total of 156 participants.
2.5.2 Materials, Stimuli, Design and Procedure
The motor experiment was similar in method to the visual search experiment, except that this time participants did not have to distinguish between present and absent trials but had to press the same button at any appearance of the visual search display. The respond hand was counterbalanced and alternated after half of the experiment. The stimuli and the spatial arrangement were the same as in the visual search experiment. The timing was also the same apart for the blank preceding the search display, which lasted for a variable interval between xx and xx ms, to avoid the possibility of generating a response rhythm.
2.6 Search Task Results
2.6.1 Reaction Time Removal of Outliers
In a first step reaction times were inspected for each individual to determine a suitable cut-off for the RT data (examined by visual exploration of RT distribution). After that, 2.6% of all search task trials were excluded from analysis for being responded to extremely fast (anticipatory answers) or extremely slow (failure to respond in time). RTs with more than three standard deviations from the mean were calculated for each participant separately and excluded from analysis (1.0% of the remaining data). Furthermore, two participants aborted the search task due to personal reasons.
2.6.2 Errors
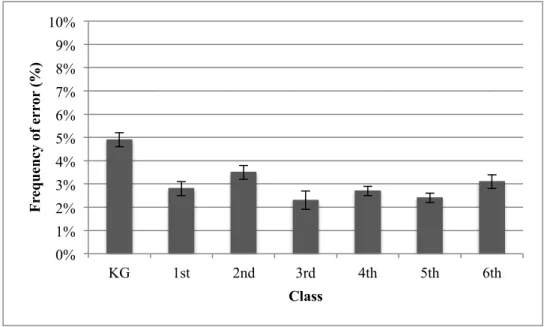
Over all, the average error rates in the search task were very low (see Figure 8); kindergarten 4.9%, first class 2.8%, second class, 3.5%, third class 2.3%, fourth class 2.7%, fifth class 2.5% and sixth class 3.1%. An one-way ANOVA with the factor class (between: KG, 1st, 2nd, 3rd, 4th, 5th, 6th) revealed a significant main effect of class,
F(6,152) = 3.442, MSE = 7.177, p = .003, ηp2 = .120. Repeated contrasts, by comparing every class with the corresponding next higher class, showed a significant difference between the KG (4.9%) and the first class (2.8%) (p = .003). However, if participants with an error rate above 10% are excluded from the analysis (KG: three cases, 2nd class: one case) the difference between the classes disappears, F(6,148) = 1.964, MSE = 5.121, p = .074, ηp2 = .074.
Figure 8. Bars are reporting the mean error frequency (%) for each class. Error bars
reflect the standard error of the mean.
2.6.3 Reaction Times
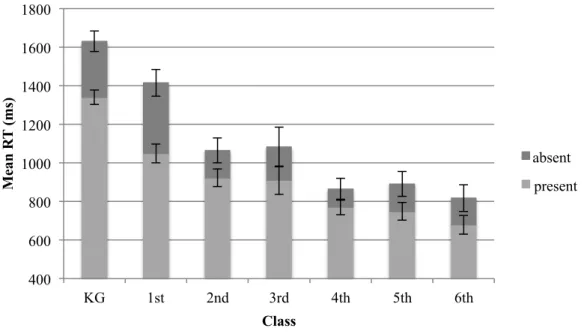
The RTs of the search task for target-absent and present-trials were analyzed with a repeated measures ANOVA with the factor trial-type (absent, present) and the between factor class (KG, 1st, 2nd, 3rd, 4th, 5th, 6th). The main effect of trial-type showed a significant result F(1,152) = 141.982, MSE = 17593.002, p < .001 ηp2 = .483. To summarize participants were faster in target-present trials (1109.1 ms) compared to absent trials (917.3 ms) (see Figure 9). This pattern of decreased RTs in target-present trials compared to target-absent trials was significant across all classes, as shown in the following seven paired t-tests: KG: t(33) = 6.545, two-tailed p < .001; 1st class: t(19) = 5.147, two-tailed p < .001; 2nd class: t(22) = 8.29, two-tailed p < .001; 3rd class: t(8) = 3.621, two-tailed p = .007; 4th class: t(29) = 4.793, two-tailed p < .001; 5th class: t(22) = 5.165, two-tailed p < .001; 6th class: t(19) = 4.275, two-tailed p < .001.
0% 1% 2% 3% 4% 5% 6% 7% 8% 9% 10% KG 1st 2nd 3rd 4th 5th 6th F re q u en cy of e rr or (%) Class
The between factor of class also showed a significant effect of faster RTs for increasing class, F(6,152) = 31.202, MSE = 63342.597, p < .001, ηp2 = .552. The interaction of trial-type and class revealed to be significant F(6,152) = 6.66, MSE = 17593.002, p < .001, ηp2 = .208.
Figure 9. Mean RTs (ms) in target-absent (dark gray line) and target-present (light
gray line) for each class. Error bars reflect the standard error of the mean.
Figure 10. Mean RTs (ms) in target-absent (dark gray bar) and target-present (light
gray bar) for each class. The difference between the two bars of each class depicts the
400 600 800 1000 1200 1400 1600 1800 KG 1st 2nd 3rd 4th 5th 6th M ean R T (ms ) Class absent present 400 600 800 1000 1200 1400 1600 1800 KG 1st 2nd 3rd 4th 5th 6th M ean R T (ms ) Class absent present
diminishing RT-difference between target-absent and target-present trials with increasing class. Error bars reflect the standard error of the mean.
A closer look at the interactions revealed that the ratio between target absent and target-present trials (calculated by the difference between absent and present RTs) decreases from the KG to the 6th class (290.2 ms, 365.9 ms, 141.7 ms, 172.6 ms, 92.8 ms, 141.7 ms. 137.9 ms), however, not in a linear fashion (see Figure 10). Further, target present RTs were analyzed depending on the target dimension of each trial. In a repeated measures ANOVA the factor target dimension (color, orientation) and the between factor class (KG, 1st, 2nd, 3rd, 4th, 5th, 6th) were compared. The main effect of target dimension was significant, F(1,152) = 55.312, MSE = 4124.444, p < .001, ηp2 = .267, once again emphasizing the advantage of color processing (888.8 ms) over orientation (946.8 ms) processing. The between factor of class was significant,
F(6,152) = 30.217, MSE = 48298.213, p < .001, ηp2 = .544, revealing a decrease in overall RTs the higher the class (KG: 1340.9 ms, 1st: 1049.2 ms, 2nd 923.4 ms, 3rd 910.6 ms, 4th 771.5 ms, 5th 749.5 ms, 6th 679,8 ms). There was no significant interaction, F(6,152) < 1, n.s..
Figure 11. Target-present mean RTs (ms) towards colored targets (dark gray line) and
oriented targets (light gray line) for each class. Error bars reflect the standard error of the mean. 400 600 800 1000 1200 1400 1600 1800 KG 1st 2nd 3rd 4th 5th 6th M ean R T (ms ) Class color% orient%
The decreased RTs towards color targets compared to oriented targets was not significant for the KG and the 3rd class, as revealed by paired t-tests: KG: t(33) = 1.875, two-tailed p = .070; 3rd class: t(8) = 1.206, two-tailed p = .262; for the other classes however, the difference was significant with faster RTs towards colored targets: 1st class: t(19) = 3.084, two-tailed p = .006; 2nd class: t(22) = 4.413, two-tailed
p < .001; 4th class: t(29) = 7.534, two-tailed p < .001; 5th class: t(22) = 9.789, two-tailed p < .001; 6th class: t(19) = 5.475, two-tailed p < .001.
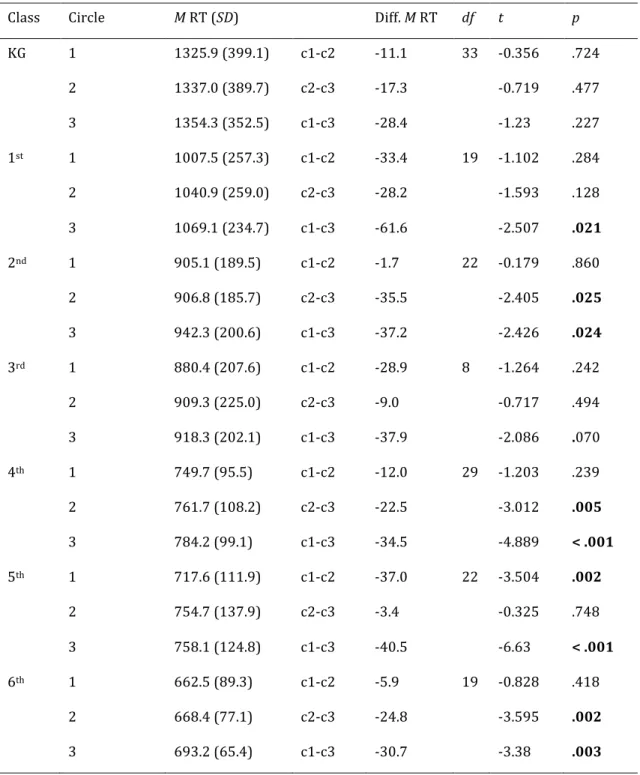
Further RT examination compared responses towards targets depending on their distance from the fixation cross. Targets could appear on the inner, the second or third circle. The repeated measures ANOVA with the within factor target distance (circle1, circle2, circle3) and the between factor class (KG, 1st, 2nd, 3rd, 4th, 5th, 6th) revealed the distance to have a significant effect of faster RTs for targets closer to the middle of the display (circle1: 892.7 ms, circle2: 911.3 ms, cirlce3: 931.4 ms), F(1.876,285.155) = 12.32, MSE = 4397.903, p < .001, ηp2 = .075 [Huynth-Feldt corrected]. The between factor of class was significant, F(6,152) = 29.914, MSE = 49289.817, p < .001, ηp2 = .541. There was no significant interaction between target circle and class
F(11.256,285.155) < 1, n.s. [Huynth-Feldt corrected]. To look into the data separately
Table 1. Mean Reaction Time for Target Distance
Comparison of mean reaction time for target-present trials with different target distances from the center of the screen by class
Class! Circle! M!RT!(SD)! ! Diff.!M!RT! df! t! p!
KG! 1! 1325.9!(399.1)! c1=c2! =11.1! 33( =0.356( .724( ! 2! 1337.0!(389.7)! c2=c3! =17.3! ( =0.719( .477( ! 3! 1354.3!(352.5)! c1=c3! =28.4! ( =1.23( .227( 1st! 1! 1007.5!(257.3)! c1=c2! =33.4! 19( =1.102( .284( ! 2! 1040.9!(259.0)! c2=c3! =28.2! ( =1.593( .128( ! 3! 1069.1!(234.7)! c1=c3! =61.6! ( =2.507( .021( 2nd! 1! 905.1!(189.5)! c1=c2! =1.7! 22( =0.179( .860( ! 2! 906.8!(185.7)! c2=c3! =35.5! ( =2.405( .025( ! 3! 942.3!(200.6)! c1=c3! =37.2! ( =2.426( .024( 3rd! 1! 880.4!(207.6)! c1=c2! =28.9! 8( =1.264! .242! ! 2! 909.3!(225.0)! c2=c3! =9.0! ( =0.717! .494! ! 3! 918.3!(202.1)! c1=c3! =37.9! ( =2.086! .070! 4th! 1! 749.7!(95.5)! c1=c2! =12.0! 29( =1.203! .239! ! 2! 761.7!(108.2)! c2=c3! =22.5! ( =3.012! .005! ! 3! 784.2!(99.1)! c1=c3! =34.5! ( =4.889! <!.001! 5th! 1! 717.6!(111.9)! c1=c2! =37.0! 22( =3.504! .002! ! 2! 754.7!(137.9)! c2=c3! =3.4! ( =0.325! .748! ! 3! 758.1!(124.8)! c1=c3! =40.5! ( =6.63! <!.001! 6th! 1! 662.5!(89.3)! c1=c2! =5.9! 19( =0.828! .418! ! 2! 668.4!(77.1)! c2=c3! =24.8! ( =3.595! .002! ! 3! 693.2!(65.4)! c1=c3! =30.7! ( =3.38! .003!
2.7 Eye Movement Results
2.7.1 Eye Movements Removal of Outliers
Only trials that met the RT analysis criteria were considered for analysis of eye movement parameters. Before any further analysis, the eye movement data was checked for validity. For instance trials in which a blink occurred (10.6%) were excluded (‘interruption of processing’). Additionally, any trials containing a saccade duration longer than 500 ms (‘aberrant value for display size’) were also rejected from subsequent analysis, which reduced the data set by another 5.2%.
2.7.2 Eye Movement Percentage
The remaining trials were split into eye movement (EM-trial) trials and no eye movement trials (noEM-trial). A trial was considered as an EM-trial when there was at least one fixation (initial fixation) followed by a saccade. Trials with only one initial fixation (in most cases close to the position of the fixation cross) and no movement of the eye (i.e. saccade), was considered as a noEM-trial. Overall 97.2% of the remaining trials were EM-trials compared to 2.8% of noEM-trials, t(158) = -89.3, p < .001. Comparing the percentage of EM-trials between the different target dimensions, with a repeated-measures ANOVA with the factors trial-type (absent, color, orientation) and between factor class (KG, 1st, 2nd, 3rd, 4th, 5th, 6th), revealed the main effects of trial-type to be significant with a slightly lower percentage of eye movements for target-absent (96.1%) compared to colored target (98.6%) and oriented target (98.7%) trials:
F(1.217,184.99) = 26.802, MSE = 17.562, p < .001, ηp2 = .150 [Huynth-Feldt corrected]. There was no effect of the between factor of class F(6,152) = 1.773, n.s.. Planned simple contrasts revealed the difference to be significant for each target dimension compared to absent trials (absent vs. color: F(1,152) = 27.506, MSE = 29.616, p < .001, ηp2 = .153, absent vs. orient: F(1,152) = 28.935, MSE = 31.165, p < .001, ηp2 = .160). There was no significant difference between color and orientation trials F(6,152) < 1, n.s..