-I
ADSORPTION OF COPPER ON QUARTZ
BY
PAUL W. RICHARDSON
B.A.Sc., University of British Columbia, 1949 M.A.Sc., University of British Columbia, 1950
Submitted in Partial Fulfillment of the Requirements for the Degree of
DOCTOR OF PHILOSOPHY from the
MASSACHUSETTS INSTITUTE OF TECHNOLOGY
JUNE, 1955
- - I - -) P
Signature of Author ''_I
Department of Geology & Geophysics, May
Signature of Thesis Supervisor Signature of Chairman of
Department Committee on Graduate Students
-U----I,
ADSORPTION OF COPPER ON QUARTZ by
PAUL W. RICHARDSON
Submitted to the Department of Geology and Geophysics on May 16, 1955
in Partial Fulfillment of the Requirements for the Degree of DOCTOR OF PHILOSOPHY
ABSTRACT
The amount of copper that is adsorbed on the surface of quartz from aqueous solutions of varying copper concentration
and varying pH has been investigated. The copper was determined by chemical means using dithizone. It was found that in solutions with the concentrations of copper and the pH's1 ound in naturt2 the amount of adsorption varies from 1.7 x 10 to 5.6
x
l0" moles of copper per square centimeter of quartz.Thesis Supervisor: Herbert E. Hawkes
TABLE OF CONTENTS ABSTRACT ... LIST OF TABLES -LIST OF FIGURES ACKNOWLEDGMENTS PART 1 * *0000@e 0beO * .. . 0**O INTRODUCTION... 1. General Statement 2. Water. . . . .. 3. Adsorption .... ... . 4. Weathering ...
5. Discussion of Copper in Solution
OUTLINE OF EXPERIMENTAL METHOD .
EXPERIMENTAL RESULTS ... .. ... 1. Chemical Results... 2. Spectrographic Results. . SOURCES OF ERROR ... DISCUSSION OF RESULTS ... CONCLUSIONS . ... *...*.*...* . 0
SUGGESTIONS FOR FUTURE RESEARCH .... ...
BIBLIOGRAPHY -.. **...*...0..*0
DETAILED PROCEDURE ...
A METHOD FOR THE DETERMINATION C CONTENT OF WATER .... INTRODUCTION ... PROCEDURE ... DISCUSSION OF RESULTS . .. 0 * F .. .. ..0 .. 0 0.. THE 0* BIOGRAPHICAL SKETCH ... ... ... - I ~ I. II. III; IV. V. VI. VII. VIII PART 2 PART
3
I. II. III. Page 24
5
6
7
7
8
8
13 1418
20 2026
27 3135
36
38
4160
6061
6263
0.*.. HEAVY ... a METAL .0 90*0* .. .LIST OF TABLES
TABLE PAGE
1. The pH of Natural Media and its Relation to the
Precipitation of Hydroxides ... 17 2. Experimental Determinations of Copper Adsorbed
on Quartz ... 21
3. Comparison of Chemical and Spectrographic Results... 26 4. Effect of Concentration of Electrolyte on Double ...
5
LIST OF FIGURES
FIGURE PAGE
1. A Model of Adsorption ... . 11
2. Solubility Boundaries for Heavy Metal Hydroxides... 16
3. Amount of Copper Adsorbed on Quartz expressed in Micrograms of Copper per Gram of Quartz... 22
4. Amount of Copper Adsorbed on Quartz expressed in Moles per Square Centimeter of Quartz Surface... 23
5. Photomicrograph of Quartz Particles... 25
6. Solubility of Silica versus pH...---.---... 30
T. Quartz Stutr...30
8. Adsorption of Several Cations on Quartz at pH = 6 ... 34
9. Water Demineralizer and Cenco-Meinzer Seive Shaker... 42
10. Beckman Model N pH Meter...--... 42
11. Ro-tap used in Sizing the Quartz Particles... 46
12. Weighing Bottles Nested with Outer One used as a Dessicator ...---. ... 46
13. Increase in Weight of Cooling 20 mm Weighing Bottle... 49
14. Oxidation Rate of Dithizone in Various Solvents....-.--... 52
15. Transmittancies of Dithizone and Cupric Keto Dithizonate .. 52
16. Photometer Calibration of 0.001% Dithizone in Toluene versus Co p r - - - - * - - - . 53
17. Adapted Centrifuge Tubes---.-. 55
18. Ground Glass Stoppered Pyrex Test Tubes---.--- 55
19. Conversion Chart...'-''--+---.-..
6
ACKNOWLEDGMENTThe writer is grateful to the numerous members of the Depart-ments of Geology and Metallurgy who have contributed ideas and materials which have made possible the experimental work.
The subject of adsorption studies of heavy metals on minerals was suggested by Professor P.M. Hurley. The writer was introduced to the chemical methods used in the investigation by Dr. H.E.
Hawkes who was also the thesis supervisor and a contributor of pertinent ideas and encouragement throughout the investigation.
Professors R. Charles and D.W. Fuerstenau and Messrs.
S. Mitchell and J. Brown of the Metallurgy Department were very helpful throughout the experimental work and subsequent period of writing.
7
PART 1
I. INTRODUCTION
1. General Statement
The object of the investigation is to determine the amount of copper that is adsorbed on a unit area of quartz from aqueous solutions of varying copper concentration and varying pH. These measurements and a consideration of the solubility field of copper
ions were undertaken as a means of investigating the complex
subject of the weathering of mineral deposits and the subsequent history of the released components.
In the Department of Metallurgy at M.I.T. similar studies have been carried out on the adsorption of sodium on quartz (Bell, 1953; Laxen, 1951) and on the adsorption of barium on quartz (Chang, 1951). In those studies radioactive tracers were used as a means of
measuring adsorbed material. Chemical methods for determination of very small quantities of heavy metals exist (Sandell, 1950). Because of the familiarity of the writer with chemical rather
than radioactive tracer techniques, the possibility of using a chemical technique was investigated. It was found in preliminary work that the very small amounts of adsorbed copper could be
measured chemically. As a result, work was begun to develop the technique so it would give readings precise enough to in-vestigate small variations of adsorbed copper.
Briefly, the thesis describes the study of the amounts of copper adsorbed on quartz utilizing a chemical technique for measuring the copper.
The experimental procedures and techniques are described in detail in part 2. Part 3 is a description of a method for
determining very small amounts of heavy metals in water. 2. Water
Adsorption in the experiments and in nature takes place in water. The pertinent properties of water have been summarized in Mason (1952). As a solvent, water is unequalled and the key to its properties is the structure of the water molecule. The hydrogens are deeply embedded in the oxygen atom with the bond angle of the lines joining the hydrogen nuclei to the oxygen nucleus being 1050. This results in an uneven distribution of
charge and, as a result, the water molecule is a dipole. The mutual attraction of the dipoles makes the cohesive forces
between the water molecules much higher than for normal liquids. This causes water to have a high dielectric constant, e.g. 78.4
compared with 2.2 for carbontetrachloride. This is responsible for the activity of water as a solvent for ionic compounds because
the force of attraction between ions varies inversely as the dielectric constant of the medium and the solution of ionic com-pounds is essentially a dispersion of the ions by the molecules of the solvent.
0
The radius of hydrated ions is 5 to 6 A (Eigen and Wicke, 19 54). The unit is made up of the ion plus usually two hydration shells. Under some circumstances one or both shells may be removed. These shells are impenetrable for ions of like sign but can intermesh
to some extent when the ions are of opposite sign because of the reverse orientation of the oriented water molecules.
3. Adsorption
9
between two phases. There are two main types of adsorption. Physical adsorption is the physical concentration of a substance at an interface. The concentrating substance is known as an ad-sorbent. Chemical adsorption, or chemisorption, is the
centration of a substance at an interface by reaction of the con-centrated substance with the adsorbent. In the case of a solid in contact with a solution, physical adsorption on the solid is an enrichment, near the solid, of the substance in solution
relative to its concentration in the bulk of the liquid (Glasstone, 1946). Negative adsorption is an impoverishment of a solute
near the solid-liquid interface.
It has been found that an empirical relationship of the form
a = kcn
is adequate for adsorption from solution over a considerable range of concentration (Freundlich, 1930) where
a is the amount of solute adsorbed by a unit mass of adsorbent
c is the concentration of solution
k and n are constants for the given adsorbent and solute. n is greater than 1.
It is apparent from the form of the isotherm that the amount of adsorption decreases less rapidly than the concentration of the solution.
According to the ideas of Stern (1924), physical adsorption requires a triple rather than a double layer model of adsorption
(fig 1) (Fuerstenau, 1955). Quartz, the mineral being investigated in this thesis, has a negative potential and is used as an example
in the diagram. The outer layer of the solid is made up of ions which are not completely neutralized by other components of the solid and which are the potential-determining ions. In the case of quartz in contact with an aqueous solution, the potential-determining ions are oxygen. Because the ions are of one sign, ions of the opposite sign are attracted to the solid from the bulk of the solution. These "counter ions" are held near the interface and their concentration grades off into the solution. An equilibrium is set up between the attracting forces of the potential-determining layer and the forces of dispersion originating from thermal agitation in the liquid.
Beside the solid surface one thickness of counter ions (not necessarily a complete monolayer) is held firmly; beyond this extends a gradually more rarified diffuse layer. The force attracting. the diffuse layer to the surface has been named the
zeta potential. The zeta potential may be measured experimentally and is found to be of the order of 0.1 volts. Measurement is made of the potential generated by forcing a stream of liquid of known pH and salt concentration past a substance with a non
conducting surface, e.g., quartz. The diffuse layer is sheared and moved and an electric potential arises which sets up a con-duction current through the liquid in a direction opposite to the convection current. For quartz the zeta potential is zero at a pH of 3.72 when the salt concentration is low.
This model of adsorption departs slightly from previous models. It is illustrated in figure 1. In the boundary of the solid is a tightly bound layer of ions, the potential-determining ions.
FIGURE I-
A MODEL OF ADSORPTION
A- Role of Potential-Determining Ions
id
soidI q± i
B- Role of
Non
-Surface-Active
10
0
e
Counter Ions
C-Role of Surface-Active Counter Ions
:0
I® ITI
'0
I(
y
92
IV
Note. Line I portrays low concentrations , Line 2 much higher concentrations 4) =the potential of the surface of the solid
g =the zeta potential
12 For quartz in contact with aqueous solution, these are
con-sidered to be oxygen; from the point of view of the liquid, the potential-determining ions are hydrogen and hydroxyl. When the pH is varied, the total charge on the quartz surface, the thickness of the adsorbed layer, and the zeta potential all vary (fig 1-A).
The adsorbed ions in solution, the counter ions, may have no effect on the surface charge but can still affect the thick-ness of the adsorbed layer. If this is the case, they are ions of a non-surface-active indifferent electrolyte (fig 1-B).
Because their concentration affects the thickness of the
ad-sorbed layer, they affect the potential holding the diffuse layer to the surface. Systems containing constant amounts of potential-determining ions and varying amounts of non-surface-active in-different ions illustrate this. The term "inin-different" indicates that the ion in question is not potential determining.
Surface-active indifferent electrolytes do not affect the potential of the solid surface but are bound closely to the surface and if the solution is sufficiently concentrated may actually reverse the sign of the zeta potential (fig 1-C). If
the sign is reversed, as in the example illustrated, anions rather than cations would make up the diffuse layer and, in effect,
distinct triple layer adsorption would be realized.
In summary, for quartz the hydrogen and hydroxyl ions are the potential-determining ions in solution. Monovalent non-surface-active ions, such as sodium and chlorine ions, which do not react with the solid phase, do not affect the potential of the surface but affect the zeta potential if they vary in concentration. Ions
13 of higher valence, such as barium, affect the zeta potential to the extent of reversing its sign but they are not nearly as potential-determining as hydrogen and hydroxyl ions.
4. Weathering
When a sulfide mineral deposit is subjected to the agencies of weathering, the metals are released forming ionic solutions. The rate and completeness of the removal of the heavy metals is dependent on the mineral assemblage and on the environment in which oxidation takes place. The soluble components of the weathered mineral deposit are transported in the surface and
underground drainage. Those parts of the mantle through which the underground water flows and over which the surface drainage flows retain, at least temporarily, some of the migrating metals.
Soil and stream sediments are made up of particles of the resistates, clays, organic material, and numerous partly altered fragments of rocks and minerals. These various particles retain a portion of the heavy metals by adsorption when the heavy metals are available in water in contact with the particles. The extent of retention varies enormously depending on the size and kind of adsorbing particle, the pH of the water, and other materials in solution. A given mass of organic material or clay adsorbs much more metal than the same mass of very fine quartz sand.
When water or soil contains a more than normal amount of heavy metal as a result of the weathering of a metalliferous deposit, the area of concentration is termed a "geochemical anomaly." In recent years water, stream sediments, and soils have been sampled to find geochemical anomalies and to trace
them to the mineral deposits from which they originated (Hawkes, 1955). The heavy metals copper, zinc, lead, and nickel are most commonly sought after by this method.
Because in any given anomaly various types of soil are present and because the extent of retention of heavy metals depends on the size and kind of particle, it is desirable to know the relative retention power of the soil components in order to understand the significance of variations of metal in samples of different soil type. It should be possible to decide if the collection and analysis of any given soil type is of use in tracing a geochemical anomaly.
Using geochemical techniques, it is impossible to predict the size and tenor of the mineral deposit undergoing weathering. However, a more complete knowledge of the nature of geochemical anomalies should facilitate recognizing them and tracing them to their sources. Consequently, it is especially desirable that adsorption experiments should include determinations which cover the entire range of pH and metal concentrations found in nature.
5. Discussion of Copper in Solution
The concentration of copper in ionic solution in most stream waters is limited by the amount of copper available for solution rather than by its insolubility (fig 2). Exceptions are those streams of high pH which flow from limestone areas. Not all the copper in the S*rgarnsis carried as ionic copper; some is adsorbed on suspended organic and inorganic material. There is however, no reason to think that there is any limit to the load that the stream may carry other than the supply. This is even more the
case for the other heavy metals (fig 2).
Upon reaching the ocean, however, different conditions pre-vail. These are shown in table 1 which is by Mason (1952, p. 140).
It will be noticed that the sea is slightly alkaline, whereas
most terrestrial waters are somewhat on the acid side of neutrality. The pH of many terrestrial waters is controlled by the buffer
system CaCO3 - CO2 - H20; a saturated solution of CO2 has a pH
of 5, and one of Ca(HCO3)2 a pH of 6.4.
Riley (1939, p.53) in a study of Connecticut lakes found a variation of'copper content from 0.005 to 0.6 ppm. He found that the content varied greatly with the season. The greatest amount was present in the autumn and least in late winter and spring. 'Riley (1937-8) also investigated the copper content of water near the mouth of the Mississippi. Here he found the normal variation of dissolved copper to be 0.001 to 0.015 ppm with the highest values in water of low salinity and the lowest in sea water approaching normal salinity.
Wattenberg (1943, p. 87) has stated that the copper content of sea water is 0.0002 to 0.001 ppm in contrast to the earlier generally accepted content of 0.001 to 0.01 ppm.
5
102
r
5
6
7
8
9
10
pH
K SP Cu(OH) 2 =Pb(OH)
2=
Zn(OH)
2=
h
i (OH)
2=
6.0 x
l
-0
x1.Ox
1-O
x
10 -20 10-'5Mn(OH)
2Fe (OH)
2Co (OH)
2= 1.
0 x 10-'
4= 1.
O
x
10-15
= 2.0x 10'
6FIGURE
2 - SOLUBILITY
METAL
BOUNDARIES
HYDROXIDES
16
10-
3
(0 0)-5
C C 0 4.-0 4-. C 0) U C0
0
IO~4
10-6
FOR
HEAVY
TABLE 1
The pH of Natural Media and its Relation to the Precipitation of the Hydroxides
pH Precipitation of Hydroxides Natural Media
11 Magnesium Alkali Soils Bivalent Manganese 7 Bivalent Iron 6 Zinc, Copper Sea Water River Water Rain Water
5
Aluminum Peat Water Mine Waters Trivalent Iron Acid Thermal Springs 10 pH 10II. OUTLINE OF THE EXPERIMENTAL METHOD
Samples of quartz particles with a surface area of 900 square centimeters per gram were agitated in water of varying copper concentration and pH. After agitation, the pH of the solution was measured and the liquid was decanted. The moist quartz was transferred from the shaking bottles to gooch crucibles with glass frits. The crucibles were placed in centrifuge tubes and centrifuged to reduce the water content of the samples without evaporating the water. The samples were transferred to tared weighing bottles and weighed. The weighing bottles were heated to 1200C to evaporate the remaining water and then weighed again. From these weights the amount of water was found and thus the amount of copper deposited on the quartz by the evaporation of water. This would be the total amount of copper on the quartz if there were no adsorption.
The quartz was transferred to ground glass stoppered test tubes to which sodium citrate dissolved in water and dithizone dissolved in toluene were added. The tubes were shaken. The citrate released the copper from the quartz and the dithizone reacted with the copper causing a color change in the organic
(toluene) phase. This color change may be measured quantitatively with a colorimeter. The colorimeter reading Was compared with a previously prepared standard curve to obtain the amount of copper that was on each quartz sample. From this experimentally de-termined amount of copper on the quartz samples was subtracted the amount of copper precipitated on the quartz by evaporation of the water not removed by centrifuging. The difference was the
19 amount of copper adsorbed by the quartz sample. The total amount of copper adsorbed by each quartz sample was divided by the
weight of the sample to obtain the amount of adsorption of copper per gram of quartz. The amounts may then be calculated to moles of copper adsorbed per square centimeter of quartz or any other convenient units.
An independent check of the order of magnitude of the copper on the quartz was made using the optical spectrograph (Benson,
20 III. EXPERIMENTAL RESULTS
1. Chemical Results
The experimental determinations are tabulated in table 2. Figures 3 and 4 show the amount of adsorption of copper on one gram of quartz particles with a surface area of 900 square centimeters per gram. The ordinate shows the concentration of copper in the solutions and the abscissa shows the final pH of the experimental solutions. The copper concentration is plotted on log scale because of the extreme variation of concentrations used. In figure 3 adsorption is plotted as micrograms of copper per gram of quartz and in figure 4 as moles of copper per square centimeter of quartz surface.
The area investigated is limited on the right by a line representing the solubility boundary of copper in water. The
solubility product of Cu(OH)2 is 6 x 10-20 (Pauling, 1953, p.468). The left boundary of the investigated area is the isoelectric
line for quartz in aqueous solution. To the left of the iso-electric line the surface charge on the quartz is positive and anions rather than cations are attracted to the surface. At copper concentrations greater than five parts per million (ppm) the isoelectric line departs from the pH of 3.7. It may be seen in figure 3 that the deviation takes place where the concentration of the copper ion approaches that of the hydrogen ion. The
upper concentration boundary of the area is 100 ppm copper. This is much higher than copper anomalies found in nature and about 20,000 times normal background in natural stream waters. The lower limit of investigation is 0.1 ppm. This concentration is between 10 and 20 times normal background found in nature.
TABLE 2
Experimental Determinations of Copper Adsorbed on Quartz
Copper Conc in ppm
Copper Conc
in moles Initial,pH FinalpH
Adsorption in Micrograms of Cu per gm of Quartz Adsorption in Moles of Cu per cm2 of Quart 2SurfacE (xl0-
)
1 10 2 10 3 10 4 1 5 1 6 1 7 10 8 50 9 100 10 100 11 100 12 100 13 100 1.57x10~4 1 .57xl0~4 1 .57xl0~4 1 .57xl0-5 1.57x10⁻⁵ 1 .57xl0-5 1. 57xl0~4 7.85xl0~4 1 .57x10-3 1 .57x10-3 1.57x10⁻³ 1 .57xl0-3 1.57x10⁻³ 7.85x10~4 50 15 0 0 16 0.1 1.57x10⁻⁶ 3.80 4.50 6.08 3.98 4.95 6.075.38
5.325.37
4.55
5.66 3.98 4.945.85
5.69 3.80 4.405.79
3.92 4.92 5.82 5.29 5.30 5.24 4.505.61
3.90 4.86 5.705.43
-. 01 .32 .04 .26 .24 .52.59
.03 .96 -. 31 .36 .65 0.00 5.50 5.38 0.08 2.95.5
0.67 3.1 4.5 4.2 9.1 10.3 0.50- 5.4
6.3 11.3 0.0 1.41000 100 0.1
0.01
0.001pH
FIGURE
AMOUNT OF COPPER ADSORBED ON QUARTZ
expressed In
of Copper per Gram
22
E
0. C C C 0 10-2 (010~
4
C
C 0 1-6 0 - 0 C 10~ o C-0 0/of Quartz
Micrograms
4
5
6
7
8
pH
FIGURE
AMOUNT OF COPPER ADSORBED
ON QUARTZ
expressed
Centimeter of Quartz
23
100E
CL 0 0.1IC-
2
10r4 r 0 0~10-
5
OI
0 0 10-7 0 C 10~8 C 0 0.01C)
0.001Surf ace
Moles per Square
At the appropriate concentration and pH coordinates the measured amountsof adsorbed copper are plotted. Each of these values is the average of four determinations. The contoured values show an increasing amount of adsorption with increasing
copper concentration of the solution and with increasing pH. The amount of copper adsorbed from solutions of concentration and pH which might be encountered in nature varies from 0.1 to 0.3 microgram per gram of quartz of this particle size. This is equivalent to 1.7 x 10⁻¹² to 5.6 x 10⁻¹² moles of copper per
square centimeter of quartz.
O
Assuming a hydrated radius of 5 A and therefore a parking area of 100 A2, the surface is respectively 10% and 1% covered when 1.0 microgram and 0.1 microgram of copper is adsorbed per gram of quartz.
The average grain has about 10 exterior corners, 300 microns of edges, and 8000 square microns of facial area. It is very irregular in outline (fig. 5). Assuming a hydrated radius of
05
5 A this would give positions for 10 ions on the corners, 6 x 10⁵
ions on the edges, and 3 x 10¹⁰ ions on the faces per gram for quartz grains of this size.
It was found that the average amount of water remaining after centrifuging was 4%. If the area of the quartz was 900 square centimeters per gram, the average thickness of the water was
409
40
A
4
a
-- Photomicrograph of Quartz Particles
25
loop
26 2. Spectrographic Results
Benson (1955) used the optical spectrograph to analyse quartz specimens which had been exposed to copper solutions. The results are shown in table 3.
Table 3
Comparison of Chemical and Spectrographic Results
Sample Concentration pH of Micrograms of Copper of Solution Solution Adsorbed per Gram Quartz
Benson Richardson
1 100 4.66 0.06 0.15
2 0.1 6.15 0.20 0.16
Each of Benson's results are averages of four determinations. The readings under Richardson are taken from figure 3. Sample 1 was exposed to copper solutions under conditions where citrate
soluble copper was very low, where the precipitated copper was accurately known, and where there was possibly some tightly bonded copper which was not citrate soluble. Benson's results show that there was little or none of the last. Sample 2 was exposed to copper solutions under conditions where the amount of precipitated copper was very low (0.004 ppm). The object of this sample was to confirm the order of magnitude of the ex-perimentally determined values of adsorbed copper in figure 3.
27 IV. SOURCES OF ERROR
(1) A very small quantity of water may have been evaporated during the transfer of the quartz samples before and after centrifuging. The amount of copper precipitated by such evaporation is assumed to be negligible.
(2) Very small errors might be introduced by the surfaces of the tared weighing bottles not being identical. The maximum
weighing error here was about 0.0005 gram which is negligible.
(3) It is difficult to weigh out 0.01 gram of dithizone and to transfer it quantitatively to a graduated cylinder. This resulted in the dithizone solutions varying slightly in
concentration but blanks spiked with known amounts of copper were used to standardize the dithizone solutions when they were being used to determine copper on quartz.
(4) It was found that one sample in six or eight gave an
anomalous answer. By being very careful of contamination it was possible to reduce the number of spoiled runs but they could not be completely eliminated. Perhaps soot
containing heavy metals settled into the occasional sample. These erratic errors necessitated quadruplicate runs.
(5) Very small amounts of contaminants were in the water used in the experiments. Six litres were boiled to dryness and a residue of 1-2 milligrams remained.
(6) It is possible that centrifuging might disturb the adsorbed layers to the extent of making the determinations unreliable. When the centrifuge was spun at 2400 rpm, the sample was
subjected to 805 gravities. This may have caused differential movement of the copper with respect to the water. Actually,
28
probably all the water that was removed was gone by the time the centrifuge got up to speed so there was no
migrating water available in which the copper could move differentially.
Some indication that migration of copper ions relative to water has not taken place is afforded by the statement that solid particles can be subjected to mechanical forces and to gravity and thus give rise to electrokinetic phenomena while hydrated ions can not (Weyl, in Gomer and Smith, 1953).
In addition to disturbances from equilibrium caused by copper ions migrating relative to water ions, there might be disturbances caused by the removal of most of the water. Bull (1943, p. 182) gives the thickness of the electrical double layer in the presence of electrolytes. His values are listed in table 4. Copper sulfate solution is di-divalent.
Table 4
Effect of Concentration of Electrolyte on Double Layer Thickness
Concentration Thickness of Double Layer in Angstroms moles per litre
Uni-univalent Uni-divalent Di-divalent
10~7 10,000 5600 4800 10-6 3200 1800 1530 10-5 1000 560 480 10~4 320 180 153 10-3 100 56 48 10-2 32 18 15
29
For dilute solutions the thickness of the double layer is
of the same order of magnitude as the thickness of water remaining on the quartz after centrifuging.
(7) Solubility of SiO2 might cause readings that are too high. It was noticed that during almost every run the pH decreased a small amount (table 2). It may be seen in figure 6 that the solubility of silica decreases with decreasing pH.
During a run there could initially be a period of dissolving of quartz to reach equilibrium with the initial pH then, as the pH decreased, a precipitation of colloidal SiO2 and adsorption of copper on it.
6
4-0E
0
2
4
FIGURE
6- SOLUBILITY
6
8
10
pH
OF SILICA
VERSUS
Oxygen
Silicon
FIGURE
7-
QUARTZ
30
pH
l.A
2A
3A
4A
i I0
0
STRUCTUR
E
31 V. DISCUSSION OF RESULTS
Because of the limited solubility of copper hydroxide, the field of the adsorption of copper on quartz was restricted to a low pH range. This was a disadvantage from the point of view of making the measurements because the amount of adsorption is much less where the pH is low. However, there was an advantage because more attention had to be paid to a smaller area in which
the amounts of adsorption compared to the concentration of solution departed from the usual exponential relationship. The main cause of the deviation from the normal increase is the changing of the pH of no copper adsorption from 3.72 at low copper concentrations to 4.4 at a concentration of 100 ppm
(see fig. 3). This results, at a pH of 4.6, with there being as much adsorption at 1 ppm as at 100 ppm. It is difficult to explain the change of pH of zero adsorption and the rather high negative adsorption to the left of the isoelectric line.
There are two possible explanations. If copper is
con-sidered a surface-active-indifferent electrolyte (see definition in introduction) high concentrations of copper might lead to less total copper adsorbed. With low concentrations, the zeta potential would be negative and there would be copper ions in both the first layer of the liquid and the diffuse layer. If copper is present in such amount that the zeta potential becomes positive, it is assumed in the model of adsorption that there is a relatively large amount of copper in the first layer of the liquid and that the diffuse layer is made up predominantly of anions.
32 The reason that the ions are attracted to the quartz is the presence of a charged surface on the quartz. The charged surface is supposed to originate when the quartz is crushed and to be caused by the presence of silicon ions at the surface (figure 7).
It has been postulated that rearrangement of many ionic layers takes place upon production of new faces in order to mask the silicon ions with oxygen ions (Wehl, in Gomer and Smith, 1953). If this is the case, there is still some charge remaining after rearrangement and the remaining charge is neutralized by the presence of ions near the solid surface but in the adjacent
solution. Perhaps ions in the liquid which can array themselves very near the interface are more effective neutralizers than
those ions further away in the diffuse layer. In other words, one ion close to the surface can exert the same neutralizing power as several'ions at a distance from the surface. In this manner, at high concentrations of copper solutions and at low pH's there could actually be less copper near the surface than if there were no adsorption at all.
Another possible explanation of the change in the position of the pH of no adsorption is a change in the form of copper in solutions of differing concentration. An investigation of the different states of hydrolysis of copper in nitrate solution has indicated that the relative amounts of the different forms varies with concentration (Pederson, 1943, p. 23). It was concluded that, besides CU2+, there existed in solution CUOH+, CU2 0H3+, and CU20 + It was found that the concentrations of the three hydrolysed ions were of the same order of magnitude when the concentration was
33
0.1 to 0.01 molar. In more concentrated solutions, the ion
Cu 2OH3+ gains more and more predominance while the ion Cu 202+ and, more especially, the ion CuOH+ gradually disappear. In
solutions more dilute than 0.01 molar, the form Cu2OH3+ gradually disappears. At sufficiently high dilutions only the ion CuOH+ remains of the three ions resulting from hydrolysis.
Qualitatively, it can be assumed that a similar hydrolysis of copper takes place in the sulfate solutions which were used in the experiments. A solution of copper in the presence of sulfate ions is probably even more complicated than a nitrate solution because of the power of sulfate ions to form complexes with cupric ions.
Considering the two ions Cu20H3+ and CuOH+ it will be noticed that the copper to ionic charge ratios are 2:3 and 1:1 respective-ly. The ion which is move abundant at high concentrations has less copper for a given amount of charge. Figure 3 shows that the adsorption at high concentrations does not increase as quickly as would be expected.
The adsorption of several cations on quartz has been in-vestigated by several workers (Chang, 1951; DeBruyn, 1952;
Laxen, 1951; Mao, 1955). The results of the above investigations have been plotted in figure 8 to compare the results with the amounts of copper obtained in this investigation. No attempt is made here to explain the different amounts of metals adsorbed on quartz but attention is drawn to the wide difference of the amounts of copper found in the-work by Mao and in this thesis. This latter subject is duscussed in the section on future work.
Solution Concentration in Moles
FIGURE
ADSORPTION OF SEVERAL
CATIONS ON QUARTZ
AT pH
34
10lo
0 E 0 &m. 0 1e O O*35
VI. CONCLUSIONS
The amount of copper adsorbed on quartz is measurable but very small. The amount of adsorption increases roughly as the square root of the increase of concentration. For solutions of constant pH and varying concentration, this relationship is
modified by the presence and shape of the isoelectric line. The field where copper can exist in ionic solution is very limited
in solutions of high pH because of the very low solubility of Cu(OH)2'
As a result of the formation of Cu(OH)2 at high pH's, very little copper is carried in true solution in streams with a pH above 7. Of course, copper can be transported as Cu(OH)2 in suspension or on suspended particles. From a consideration of the solubilities of the other heavy metals (fig.2) it appears
that they can be transported at normal stream pH's in ionic solution.
In a stream containing 0.01 ppm copper and with a pH of 6, quartz particles 41 microns in size adsorb only 0.1 microgram
of copper per gram of quartz. In the usual geochemical prospecting field test using a 0.1 gram sample, this concentration of copper would be undetectable.
36
VII. SUGGESTIONS FOR FUTURE RESEARCH
The investigation started in this thesis could be extended to quantitative measurements of other simple phenomena which are combined in the weathering, transportation, and deposition of the components of mineral deposits.
Specifically, this would include an investigation of adsorption of copper and other heavy metals on quartz, clay, and organic
material. Complex systems containing more than one adsorbent or more than one type of cation would approach more closely the
systems found in nature. It would be a distinct improvement to use natural waters or artificial mixtures containing the salt
content of natural waters.
Further work on details of the experimental technique would also lead to valuable results. Two aspects of the technique are especially interesting. One is the use of the centrifuge. There
can be little doubt that the application of 800 gravities and the removal of most of the water disturbs the environment set up in
the water when the quartz samples and copper solutions are shaken together. This could be checked by very slow centrifuging of the samples exposed to copper solutions in the low concentration range where a several fold increase of the usual water content after centrifuging would not cause very much copper to be precipitated during the subsequent heating.
The methods of analysing for copper on the quartz need further investigation. Mao (1955) used the radioactive tracer technique and obtained, at a pH of 6, several times the amount of adsorption the writer obtained (figure 8). Benson (1955) used the optical spectrograph to determine the copper content of eight quartz
37
samples. His results were similar to those of the writer but the different results obtained by Mao have not been explained. It seems that a single person must use all three modes of analysis in order that all the sample preparation and techniques beidentical. Only in this manner can the various techniques be evaluated for their use in the determination of micro amounts of heavy metals.
38
VIII. BIBLIOGRAPHY
1 Benson, D.G., 1955, Unpublished report on research carried on in the Cabot Spectrographic Laboratory, M.I.T.
2 Benson, D.G. and Stewart, K.J., 1955, Unpublished report on research carried on in the Geochemistry Laboratory, M.I.T.
3 Bloom, H., 1953, A Field Method for the Determination of Ammonium Citrate-Soluble Heavy Metals in Soils and Sediments as a Guide to Ore; from, Additional Field Methods used in Geochemical Prospecting, Preliminary
report, 9-16-53, U.S.G.S.
4 Britton, H.T.S., 1942, Hydrogen Ions, London, Chapman and Hall, Ltd.
5 Bull, H.B., 1943, Physical Biochemistry, New York, John Wiley and Sons.
6 Chang, C.S., 1951, Adsorption of Barium and Laurate Ions
on Quartz, Doctoral Thesis, Department of Metallurgy, M.I.T. 7 Correns, C.W., 1924, Adsorptionversuche mit sehr verduinnten
Kupfer-und BleiloSsungen und ihre Bedeutung fUr die Erzlagerstattenkunde, Kolloid Zeitschrift, vol 34, pp. 341-349.
8 Correns, C.W., 1949, EinfUhrung in die Mineralogie, Berlin, Springer Verlag.
9 DeBruyn, P.L., 1952, Adsorption of Dodecylammonium Acetate
on Quartz, Doctoral Thesis, Department of Metallurgy, M.I.T. 10 Eigen, M. and Wicke, E., 1954, The Thermodynamics of
Electro-lytes at Higher Concentrations, Jour. Phys. Chem., vol. 58, pp. 702-714.
39
11 Fischer, H., 1937, Dithizonverfahren in der chemischen Analyse, Angewandte Chemie, Nr. 50, pp. 919-938.
12 Freundlich, H., 1930, Kapillarchemi, Leipzig, Academische Verlagsgesellschaft.
13 Fuerstenau, D.W., 1953, Zeta Potential Studies on Quartz, Doctoral Thesis, Department of Metallurgy, M.I.T.
14 Gaudin, A.M. and Hukki, R.T., 1946, Principles of Comminution, Size and Surface Distribution, Trans A.I.M.M., vol. 169,
pp 67-87.
15 Gaudin, A.M. and Fuerstenau, D.W., 1955, Quartz Flotation with Anionic Collectors, Mining Engineering, vol. 7, pp. 66-72.
16 Glasstone, S., 1946, Textbook of Physical Chemistry, New York, D. Van Nostrand Company.
17 Goldschmidt, V.M., 1954, Geochemistry, London, Oxford University Press.
18 Gomer, R. and Smith, C.S., 1953, Structure and Properties
of Solid Surfaces, chapter by W.A. Weyl, Chicago, University of Chicago Press.
19 Hauser, E.A., 1939, Colloidal Phenomena, New York, McGraw-Hill. 20 Hawkes, H.E., 1955, Principles of Geochemical Prospecting,
in press.
21 Kruyt, H.R., 1952, Colloid Science, Amsterdam, Elsevier Publishing Company.
22 Laxen, P.A., 1951, Concerning the Adsorption of Sodium onto Quartz, Master's Thesis, Department of Metallurgy, M.I.T. 23 Mao, G., 1955, personal communication.
I
40 24 Mason, B., 1952, Principles of Geochemistry, New York,
John Wiley and Sons.
25 Pauling, L., 1953, General Chemistry, San Francisco, W.H. Freeman and Company.
26 Pederson, K.J., 1943, The Acid Dissociation of the Hydrated Cupric Ion, Det. Kgl. Danske Videnskabernes Selskab, vol. 20, nr. 7.
27 Rankama, K. and Sahama, T.G., 1950, Geochemistry, Chicago, University of Chicago Press.
28 Riley, G.A., 1937-8, The Significance of the Mississippi River Drainage for Biological Conditions in the Northern Gulf of Mexico, Journal of Marine Research, vol. 1, p. 60. 29 Riley, G.A., 1939, Limnological Studies in Connecticut, Ecol.
Mono., vol. 9, pp. 53-94.
30 Sandell, E.B., 1950, Colorimetric Determination of Traces of Metals, New York, Interscience Publishers, Inc.
31 Seele, G.D., 1955, Unpublished report on research carried on in the geochemistry laboratory, M.I.T.
32 Stern, 0., 1924, Zur Theorie der Elektrolytischen Doppelschicht, Zeitschrift Elektrochem., vol. 30, p. 508.
33 Wark, W.J., 1955, Geochemical Prospecting in Lakes and Rivers, Transactions of the Canadian Institute of Mining and Metal-lurgy, vol. 58, pp. 111-114.
34 Warren, H.V. and Delavault, R.E., 1953, Acetonic Dithizone in Geochemistry, Econ. Geol., vol. 48, pp.
35 Wattenberg, H., 1943, Zur Chemie dies Meerwassers, Zeitschrift anorg. chem., vol. 251, p. 86.
41
PART 2
DETAILED PROCEDURE
In this section, the procedure is described in detail so that the work of this thesis could be duplicated and related research could be undertaken without a long initial period of becoming familiar with the techniques. Both preparation of reagents and analytical techniques are included.
I. REAGENTS AND MATERIALS
1. Demineralized Water
Demineralized water is used in large quantity in the ex-periments and for washing equipment. It is prepared by passing distilled water through a Barnstead Bantam Demineralizer, model BD1 (fig 9). The demineralizing column consists of cation and anion exchange resins. The output water passes through an ohmeter where the resistance of the water is measured and a scale of NaCl equivalent content is given. The water used in the experiments had a resistance of 900,000 ohms which indicates a NaCl equivalent content of 0.2 ppm.
The salt content of output water from new demineralizing cartridges is much higher than 0.2 ppm. The cartridge used to prepare water for the experiments was conditioned by pouring large quantities of hot distilled water through it.
The demineralized water was tested for copper content with a method which has a detection limit of 0.002 ppm copper. The copper was undetectable. The water has a pH of 5.4. No attempt was made to exclude atmospheric CO2 because the experiments
42
Figure 9 - Water Demineralizer and Cenco Meinzer Seive Shaker
43 under simple but not too unnatural conditions.
The water was stored in one gallon, capped, polyethylene bottles.
2. Copper Standard
Two litres of 0.1 mole (6357 ppm) copper standard were made by dissolving 490839 grams of crystalline hydrated copper
sulfate (CuSO4-5 H20) in demineralized water (final pH=4.35).
The CuSO .5 H20 was tested for water content by weighing a
specimen, heating until the blue salt changed to white, anhydrous CuSO4, and then re-weighing. The proportion of H 20 to CuS04 was found to be 5.005 to 1. The strength of the standard solution was checked by electrolytically depositing copper from solution on platinum electrodes with an electrolysing apparatus in the analytical chemistry laboratory. The measured amount of copper in the electrolysed sample was 0.205% lower than the calculated amount of copper present.
3. Copper Solutionsfor the Adsorption Experiments
Copper solutions for the adsorption experiments were prepared by pipetting standard copper solution into a polyethylene beaker and making the volume up to 200 ml. If the standard copper
solution had to be diluted more than 50 times to make a desired strength of working solution, the dilution was done in two
stages.
The pH of the solution was adjusted using H 2s04 or Na(OH). The pH was measured with a Beckman model N pH meter (fig. 10). Readings could be taken to 0.02 of a pH unit. When the solution had had its pH adjusted it was divided into four 50 ml portions
44
4. Sulfuric Acid and Sodium Hydroxide
Sulfuric acid was prepared by bubbling vapour from a pyrex still containing 6 N H2804 through demineralized water.
Sodium hydroxide solution was prepared by dissolving analytical grade sodium hydroxide pellets in demineralized water. The pellets contained 30 ppm heavy metals but the amounts of sodium hydroxide solution required to adjust the pH of the working solutions of copper were so small that contamination from this source was negligible.
These reagents were not standardized but were used in small increments until desired pH's were obtained.
5. Preparation of Sodium Citrate Solution
The sodium citrate solution is the Solution "A" very commonly used in geochemical prospecting (Bloom, 1953)., Solution "A" is made by combining 200 grams of sodium citrate and 16 grams of hydroxylamine hydrochloride in a 4 litre separatory funnel and
adding 1500 ml of water. The funnel is shaken until the salts dissolve and then sodium hydroxide pellets are added until the
pH is 8.5. The volume is made up to 2 litres.
The solution contains rather large amounts of heavy metals which were introduced by the reagents. To remove the metals, the solution is extracted with successive 20 ml portions of 0.01% dithizone in carbontetrachloride until a bluish green dithizone color is obtained in the organic phase after the separatory funnel is shaken vigorously. The aqueous phase is now metal-free but is saturated with dithizone. The solution is extracted with successive portions of chloroform in which dithizone is much more soluble
45
than in water at a pH of 8.5. When the chloroform layer
remains almost colorless after the separatory funnel is shaken, the dithizone has been removed from the aqueous phase and the Solution "A" is ready for use.
6. Preparation of Quartz
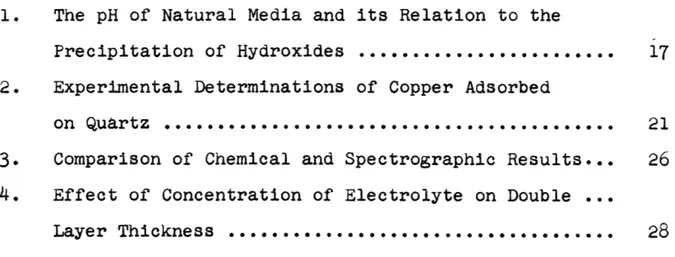
Several kilograms of unsorted, finely ground, vein quartz was obtained from the Department of Metallurgy at M.I.T. This was deslimed to about 5 microns (.005 mm) and wet screened to -200 + 400 mesh. This fraction was dry screened on a ro-tap
(fig. 11) and 500 grams of -325 + 400 mesh was retained.
The quartz was transferred to an 8 inch evaporating dish and was cleaned by boiling in twelve changes of 6N hydrochloric acid. The quartz was washed with demineralized water until the dis-carded wash water had a pH of 5.5. Sodium hydroxide was added to make the pH basic and the quartz was washed with demineralized water until the pH was 7.0. The moist quartz was dried in an oven at a temperature of 900C and stored in a capped polyethylene bottle.
The cleaned quartz was tested with dithizone and contained about .05 micrograms of available copper per gram. This copper was introduced to the quartz by the wash water. The surface
area of the quartz was found to be 900 cm2 per gram using a
krypton adsorption apparatus in the comminution research laboratory of the Metallurgy Department.
Using a method describing the area of screened fractions of quartz, the area was also calculated (Gaudin and Hukki, 1946, p.67). The average diameter of the quartz grains in the sample is 41p
46
Figure 11 - Ro-tap Used in Sizing the Quartz Particles
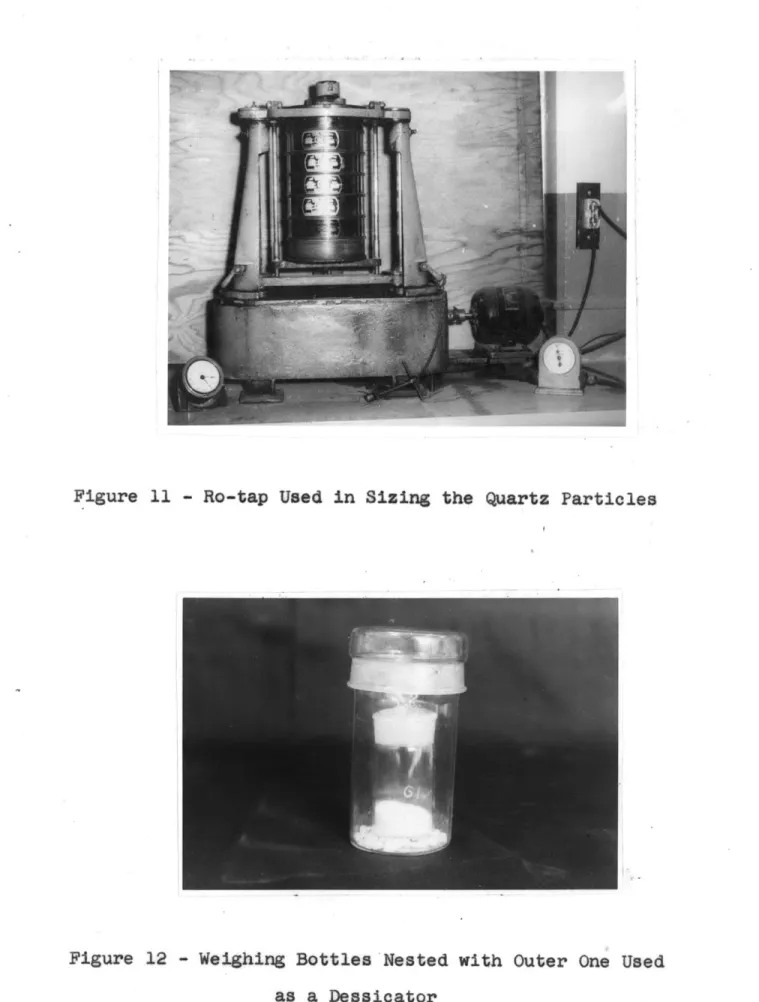
Figure 12 - Weighing Bottles Nested with Outer One Used as a Dessicator
47
It was found in the study of quartz areas that a grain of crushed vein quartz with an average size of 41 has 1.80 times the area of a sphere of this diameter. The calculation is as follows:
volume of sphere = 3 (3.14) (20.5)3(l0-4)3
=3.62 x 10⁻⁸ cm3
volume of 1 gram of quartz = 2 cm3
number of spheres
2
6
2) 108
= 1.04 x 10
Area per sphere = 4 W.A.L2 =
4(3-14)
(20-5)2 (10-4)2 = 5.27 x 10⁻⁵Area per gram = 1.04 (107) 5.27 (10-5) = 548 cm2/gram spheres
Surface Factor = 1.80
. area per gram quartz = 1.80 (548) = 985 cm2
/gm
In all calculations the experimentally determined area of 900
square centimeters of surface area per gram of quartz will be used.
7.
Use of Tared WeightsAll weighings were done in tared weighing bottles. Each weighing bottle which was used to hold samples had a similar but slightly lighter weighing bottle which was submitted to
identical cleaning and heating processes and which was placed on the right hand or weight pan of the balance whenever the weighing bottle containing a sample was weighed. Thus the samples could be
48
weighed immediately after heating with no danger of errorsintroduced by the condensation of water vapour on the cooling weighing bottles. In fact, however, the weighing bottles were cooled in a dessicator so they could be weighed cold because the balance could not weigh hot objects sufficiently accurately.
A plot was made of the weight of a weighing bottle versus time after removal from the furnace (fig 13). The curve was extrapolated to time zero to obtain the total weight change upon cooling. The weight gain was 0.0155 gram for a 25 mm weighing bottle. This weight gain was checked by using a larger 40 x 80 mm weighing bottle as a dessicator (fig. 12). The 25 mm weighing bottle and the dessicator were air cooled and then weighed
separately. The weighing bottle was heated, quickly put into the cool dessicator, and the nested bottles were weighed immedi-ately. The weight difference between the 25 mm weighing bottle when it was weighed cool and when it was weighed hot was 0.0164 grams. This checks closely with the previously obtained weight
of water using the cooling curve.
Some of the solutions used in the experiments contained 100 ppm copper. If the error in weighing caused by cooling bottles is not avoided, errors in copper determination arise which are the same order of magnitude as the experimentally determined amounts of copper adsorbing on quartz. For example, if the weighing error is 0.005 grams, the amount of copper in this weight of 100 ppm copper solution is 0.5 microgram, a very im-portant amount.
.0160 .01 .0080 .0040 0000 -. 0040 0 10 20 30
Minutes
FIGURE
13
INCREASE
IN WEIGHT
OF
20 mm WEIGHING BOTTLE
49
C e SC 40COOLING
50
8.
Use of Dithizone to Analyse CopperThe amount of copper adsorbed on the quartz samples was determined using the organic compound dithizone (diphenylthio-carbazone) which has the following formula:
NH NH - C6H5 N =N - C
6H5
Dithizone is soluble in many organic solvents. It is also
soluble in water above a pH of 8 but only to a slight extent at lower pH's. Dithizone forms compounds called dithizonates with the heavy metals. In the case of copper, two dithizonates are formed depending on the amount of copper present relative to dithizone. If there is only one copper ion present for each dithizone molecule, a red keto dithizonate is formed. If there is more than enough copper to go around once, a yellowish brown enol dithizonate begins to form. In this thesis the red keto dithizonate was used to measure the amounts of copper present.
The rate of formation of dithizonates is much faster when a reaction takes place at high pH's than when it takes place at low pH's. The rate also depends on the organic solvent used. The dithizone may be dissolved in numerous organic solvents such as xylene, toluene, acetone, carbontetrachloride, and tetra-chlorethylene. In these experiments it was desired to use one that would be insoluble in water and lighter than water. Xylene and toluene fulfill these requirements. Xylene is not too
desirable a solvent for dithizone because the dithizone quickly oxidizes. Dithizone dissolved in toluene does not oxidize nearly
51
as quickly (fig 14). The writer tested the stability of copper dithizonate in xylene and toluehe and found it much more stable in toluene. It was decided to use toluene as the organic solvent.
Early in the experimentation an attempt was made to use the excellent colorimetric end point obtainable in dithizone reactions with heavy metals. A solution of dithizone is green and a
solution of copper dithizonate is strawberry pink. When not all the dithizone present reacts with heavy metal, a "mixed color" results. With less and less heavy metal present, a sequence of colors is produced. The sequence is pink, purplish-pink, bluish purple, blue, bluish green, and green. The blue color is very characteristic and may be used as a colorimetric end point. It was found that one ml of 0.002% dithizone neutralized about one microgram of copper. It was also found, however, that this end point could not be found precisely enough to give the degree of precision necessary to determine the amount of copper adsorbed on the quartz because of the extremely small amounts adsorbed.
The necessary accuracy was obtained using a colorimeter. A Bausch and Lomb monochromatic colorimeter was used with a 505 mp (green) filter. At this wavelength the keto copper
dithi-zonate has low transmittancy and dithizone has high transmittancy. The figure given shows transmittancies for dithizone in
carbon-tetrachloride. Toluene solutions have very similar transmittancies. (fig 15). The colorimeter was calibrated by shaking various
amounts of copper in
7
ml of Solution "A" with 5,5grams of quartz and 10 ml of 0.001%, weight to volume, dithizone dissolved in toluene (fig 16).-U
52
4 8 12 16 20 n HoursRATE
OF DITHIZONE
S SOLVENTS
FIGURE
AND
15-Cu
1.5- E In 0 C 0 - 1.0 S 0 .5 -l 0400 500 600 700 Wave Length, rnpTRANSMITTANCIES OF DITHIZONE'
PRIC
KETO DITHIZONATE2
100 80 60 40 20 0 -0 Time i
FIGURE
14- OXIDATION
IN VARIOU
2 4 6 8 10 Micrograms of Copper
FIGURE
16
PHOTOMETER CALIBRATION
53
50 40 30 2054
II. EXPERIMENTAL PROCEDURE 1. Adsorption of Copper on Quartz
Fifty ml portions of solutions of known copper content were poured in each of four 40 x 80 mm weighing bottles with outside caps. To these bottles were added quartz samples varying from one to five grams in weight depending on the strength of the copper solution. For runs with 100 ppm copper, quartz samples of one gram were used because with larger samples too large an amount of copper for convenient analysis was precipitated on the quartz when it was dried later in the procedure.
The bottles were placed on an adapted Cenco-Meinzer Seive Shaker (fig 9) and were agitated 30 minutes. At the end of this time the pH of the solution was measured, the copper solution decanted and discarded, and the four moist quartz samples quickly transferred to four 15 mm gooch crucibles with medium porosity fritted discs. The transfer was made using a glass spatula and was done as quickly as possible to avoid evaporation of water. The gooch crucibles were placed in adapted centrifuge tubes (fig. 17) and covered immediately.
The centrifuge tubes were spun at 2500 rpm for ifk minutes in an International Centrifuge, model SB-l. The fast speed and short period of spinning were desirable in order to reduce the water content as much as possible before the machine heated too much. It was found that the water content of the quartz sample was reduced to between 4 and 4 1/2 %.
The samples were removed from the centrifuge and quickly transferred to tared weighing bottles. The samples were weighed
55
Figure 17 - Adapted Centrifuge Tubes, Gooch
Crucibles, and Aluminum Caps
56
to the nearest 0.1 milligram, heated to 1250C for one hour in a Cenco, de Khotinsky constant temperature furnace. The weighing bottles were cooled in a dessicator and then weighed. The
difference in weight before and after heating gave the amount of water that was evaporated during heating.
2. Removal of Copper from Quartz
The copper was de-adsorbed from the quartz with a solution of sodium citrate. There was some concern whether the
ex-traction was complete using this extractant but because the copper was loosely attached to the quartz and because the
ex-traction was carried on concurrently with the determination of the amount of copper the extraction was complete. This was confirmed by using an acid extraction on three samples which were identical with three samples from which the copper had been extracted with a citrate solution. The amount of copper obtained from each was similar within experimental limits
(fig. 16). The difference in height of the two curves is probably the result of some copper or other heavy metal being
introduced by the hydrochloric acid used in the acid extraction or by different amounts of reaction of dithizone with copper because of the different treatment of the quartz. The essential feature is that the slopes of the two curves are identical.
3.
Analysis of CopperThe weighed, dried quartz samples were transferred to cali-brated, ground glass stoppered, pyrex test tubes (fig 18) and
5 ml of citrate solution added. The quartz was allowed to stand until it was wetted and then 10 ml of 0.001% dithizone in