The Adsorption of Molecular Oxygen on Au/Ni(1 11) Alloys and its Oxidation of CO at 85 K
by
Jonathan David Fischer B.S. Chemistry
University of Massachusetts Lowell (2002) MASSACHUSETTS INSTITUI-TE OF TECHNOLOGY
rSEP 2 2 2010
LIBRARIES
ARCHIVES
Submitted to the Department of Chemistry on August 27, 2010 in Partial Fulfillment of the Requirements for the Degree of
Doctor of Philosophy in Chemistry at the
Massachusetts Institute of Technology August 2010
© Massachusetts Institute of Technology 2010 All Rights Reserved
Signature of Author Certified by Department of Chemistry 27 August 2010 Sylvia T. Ceyer Professor of Chemistry Thesis Supervisor Accepted by / Robert W. Field
This doctoral thesis has been examined by a Committee of the Department of Chemistry as follows:
~1
Professor Andrei Tokmakoff
'4->
Uv(tIairman
Professor Sylvia T. Ceyer
Professor Robert W. Field
Thesis Supervisor
y-The Adsorption of Molecular Oxygen on an Au/Ni(1 11) Alloy Surface and its Oxidation of CO at 85 K
by
Jonathan David Fischer
Submitted to the Department of Chemistry on August 27, 2010 in Partial Fulfillment of the Requirements for the Degree of Doctor of Philosophy in Chemistry
ABSTRACT
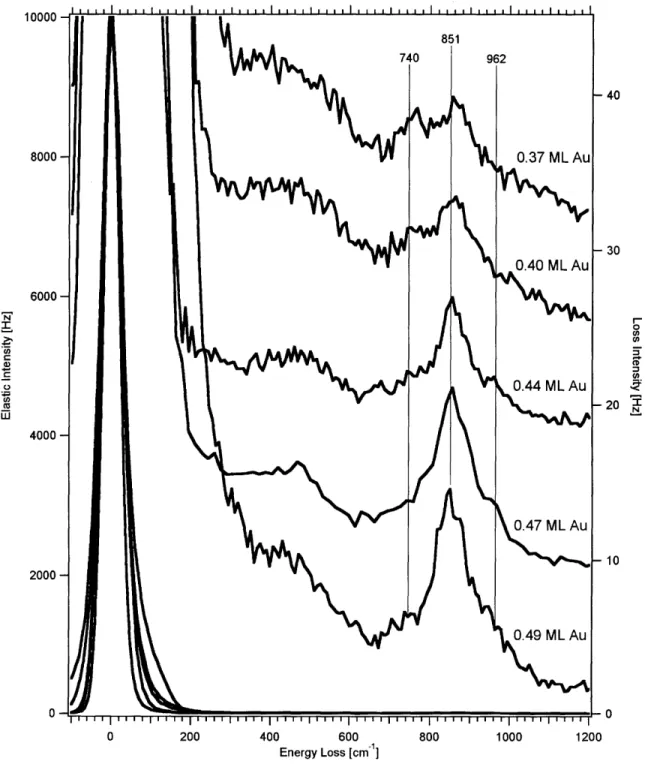
Molecular oxygen is observed to adsorb on 0.2 - 0.6 ML Au/Ni(111) surface alloys. Molecular oxygen adsorbates are characterized by their 0-0 stretching frequencies of 740 cm', 851 cm' and 962 cm', as measured by high resolution electron energy loss spectroscopy (HREELS). The concentrations and frequencies of these species are determined as a function of Au coverage. The concentrations and frequencies of dissociatively chemisorbed molecular oxygen below 0.3 ML Au are measured using HREELS. A Monte Carlo simulation was developed to determine possible binding sites for the molecular and atomic oxygen adsorbates, but no reasonable geometric model was able to match the experimental data. The trends in concentration and frequency of the molecular oxygen adsorbates are caused by the downward shift of the Ni d band as Au is alloyed into the surface and the corresponding reduction in charge transfer from the metal surface to the antibonding orbitals of 02. Adsorbed molecular oxygen dissociates
between 110 and 150 K into unreactive atomic oxygen. At Au coverage above 0.5 ML, the surface is observed to undergo a reconstruction at 300 K, leading to a new molecularly adsorbed oxygen species with a vibrational frequency of 1050 cm1. The total amount of oxygen adsorbed on the surface is quantified using Auger electron spectroscopy. An accurate algorithm for determining the Au coverage of Au/Ni( 111) surface alloys using Auger electron spectroscopy is described.
Carbon monoxide is catalyically oxidized on the Au/Ni(1 11) alloy surface at 85 K. Molecularly adsorbed 02 species with vibrational frequencies of 851 cm' and 962 cm-1 are identified as the reactants. At 115 K, CO reacts with the remaining molecular oxygen species with a vibrational frequency of 741 cm-'. The molecularly adsorbed oxygen stabilized on the reconstructed surface is also capable of reaction with CO at 85 K. The ability of Au/Ni(1 11) alloys to catalyze repeated oxidation reactions is demonstated, suggesting that Au/Ni(1 11) alloys may be a practical and effective catalyst for oxidizing CO to CO2 at cryogenic to room temperature.
Acknowledgements
Firstly, I must thank my advisor, Sylvia Ceyer. Without her support, I certainly wouldn't be here. I also appreciate that she has forgiven me for a few screwups that most would be unable to look past. I am indebted to her for what she has already given me and wherever this path takes me in the future.
Secondly, I have to thank my parents. Their support has also been invaluable. Whenever I need someone to gripe to, they were there to listen. I thank my mom in particular for listening and for her advice. I thank my dad for the tremendous electronic and mechanical skills he has shared with me. Learning how to do wire-wrap and
prototyping, and plumbing and car repair wasn't necessarily all that fun when I kid, but it sure came in handy. I also thank the both of you for instilling the value of education in me from an early age. Likewise, my sister Sarah gets a shoutout here. Thanks for your advice, especially during these difficult times at the end.
Thirdly, I have to thank my girlfriend and future wife Kristine. Without her emotional support I would have never made it through this. Sorry for being cranky so many nights when I got home, but thanks for knowing how to make me feel better.
Next, I have to thank my various coworkers. Dave Lahr and Bob Hefty taught me quite a few tricks when I was but a first year. Dave, in particular, taught me how to use our little machine and about a million other things. Mike Blair has been a solid friend and maybe the voice of reason (?) in our comedic duo. Jae-Gook Lee and I sometimes butted heads, but I admire his devotion to excellence as well as his advice. Andreas Klust is one of the most interesting conversationalists I've ever met, and although I always respected his opinions and his reasons for them, discussing science was probably the only time we ever agreed. Chris Leon was an absolute pleasure to work with on the little machine, as well as always being a good sport about answering my computer related questions. I always liked your inquisitive attitude. Dan Rowlands was a pleasure to have as an office-mate for the past year or so. The only reason I'm glad you didn't arrive in out lab sooner is that we would have wasted too much time chatting. I wish all of you guys the best and I'm interested to see what you will end up doing.
Now we get to the veritable rogues' gallery that is the non lab friends I have relied on for support. I ordered you guys with a random number generator so nobody has to feel bad. Thanks to Matt Stephenson for all the poker and Rockband nights. Thanks to
Eric Bell for all the time we spent playing video games and enjoying my new apartment years ago. Thanks to Tom Viner for a multitude of good times that can't be mentioned here. Thanks to James Joyce for the engineering talk over beer - I need to get back in touch with the UML crew. Thanks to Dave Quinn, I've known you since forever and its too bad I've been so busy lately, but we'll make up for it. To Chris Asta and Adam Lazarewicz, I'm sorry I don't end up seeing you guys so much any more, but its always a blast. I've gotta make the effort to call sometimes. Anyways, sorry to whomever I forgot, but we've has a lot of great times and I'll never forget you guys.
TABLE OF CONTENTS
Abstract 3
List of Figures 7
CHAPTER 1 - FORMATION OF Au/Ni(111) ALLOYS AND Au COVERAGE DETERMINATION
I. Introduction 12
II. Experimental
A. Description of Experimental Apparatus 15
B. Description of Au Source and Quartz
Crystal Microbalance 18
C. Preparation of Au/Ni(111) Alloys 29
III. Evaluation of Au Coverage A. Auger Electron Spectroscopy B. Thermal Desorption Measurements IV. Conclusions CHAP ALLO TER YS 34 48 52 2 - VIBRATIONAL SPECTROSCOPY OF OXYGEN ON Au/Ni I. Introduction
II. Experimental III. Results
A. Oxygen Adsorption at 85 K
B Variation of Vibrational Spectra with Au Coverage 1. Spectra of Molecularly Chemisorbed Oxygen 2. Spectra of Atomically Adsorbed Oxygen C. Variation of Vibrational Spectra with Electron
Impact Energy
D. Effects of Temperature on Molecular Oxygen Adsorbates
E.Thermal Desorption of 02
F. Determination of Absolute Oxygen Coverage G. Discrepancies Between Vibrational Spectra and
Oxygen Coverage IV. Analysis and Discussion
A. Possible Adsorption Sites for Chemisorbed Molecular Oxygen B. Changes in Surface Structure During Oxygen Adsorption V. Conclusions
CHAPTER 3 - OXIDATION OF CO BY MOLECULARLY ADSORBED OXYGEN I. Introduction II. Experimental 55 64 65 72 86 92 98 106 109 118 112 131 135 141 144
III. Results
A. CO Oxidation on Au/Ni(1 11) Alloys at 85 K
B. Spectroscopic Investigation of CO Oxidation at 85 K C. Reusability of the Au/Ni(1 11) Catalyst
D. Thermal Desorption Spectroscopy After CO Oxidation at 85 K E. Oxidation of CO by Molecular Oxygen Species
Formed by Heating to 300 K
F. Spectroscopic Investigation of CO2 Production After
Heating to 300 K
G. Attempted Oxidation of CO by Oxygen Species Formed by Heating to 400 K
IV. Conclusions CHAPTER 4
APPARATUS
- DESCRIPTION OF EQUIPMENT FOR NEW EXPERIMENTAL I. Introduction
II. Flanges for New Apparatus A. Main Chamber Flanges
1. 21" Access Flange 2. 24" Access Flange
3. Rotatable Manipulator Flange B. Flanges for Rotational Source C. Flanges for Stationary Source
1. Source Pumping Flanges 2. 12" Access Flanges
III. Pumping System for New Experimental Apparaus IV. Ionizer Cryostat for New Experimental Apparatus
186 188 191 193 196 199 200 203 207 CHAPTER 5 - LABORATORY WATER AND ELECTRICAL DISTRIBUTION
I. Introduction 213
II. Water Distribution 213
III. Electrical Distribution 217
IV. Interlock System for Experimental Apparatus 222
APPENDIX A - LIST OF DATA FILES 234
APPENDIX B - CURRICULUM VITAE 239
146 151 156 159 169 177 180 183
LIST OF FIGURES: Chapter 1
Figure 1. Au coverage versus position for old Au source ... 19
Figure 2. Schematic diagram of new Au source ... 20
Figure 3. Diagram for attaching Au to new Au source ... 22
Figure 4. Schematic of QCM oscillator circuit ... 24
Figure 5. Au coverage versus position for new Au source... 26
Figure 6. ML Au/Hz for new Au source... 28
Figure 7. Oxygen Auger transition for a clean Ni( 11) surface... 29
Figure 8. Carbon Auger transition for a clean Ni( 11) surface... 30
Figure 9. HREELS spectrum of a clean Au/Ni surface... 31
Figure 10. Oxygen Auger transition of an slightly oxygen contaminated surface... . 32
Figure 11. HREELS spectrum of a slightly oxygen contaminated surface.. 33
Figure 12. Example output from Auger transition fitting routine... 36
Figure 13. Diagram of notation used in Auger analysis... 40
Figure 14. Comparison of Auger spectroscopy with 2keV and 3keV electron beam s... ... 42
Figure 15. Au Auger transition at 2022 eV...44
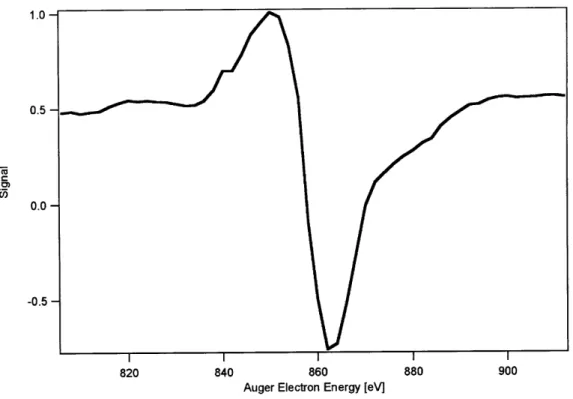
Figure 16. Ni Auger transition at 849 eV... 45
Figure 17. Comparison of Au coverages obtained using high energy and low energy Auger transitions... 47
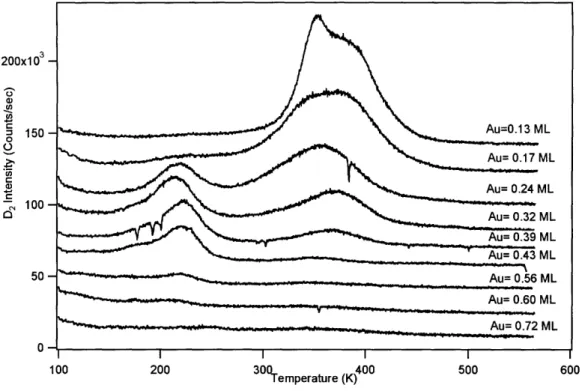
Figure 18. Thermal desorption spectroscopy of D2 from Au/Ni alloy Surfaces... 49
Figure 19. Comparison of low T integrated D2 feature with Holmblad et al. (R ef 6 )... 5 0 Figure 20. Comparison of high T integrated D2 feature with Holmblad et al. (R ef 6 )... 5 1 Chapter 2 Figure 1. HREELS spectra of oxygen adsorbed on 0.14 - 0.31 ML Au/Ni alloys... . . 66
Figure 2. HREELS spectra of oxygen adsorbed on 0.37 -0.49 ML Au/Ni alloys... . . 67
Figure 3. HREELS spectra of oxygen adsorbed on 0.52 -0.73 ML Au/Ni alloys... . . 68
Figure 4. Results of fitting four Gaussians to EELS data of 02 adsorbed on a 0.21 ML Au/Ni alloy surface...74
Figure 5. Results of fitting three Gaussians to EELS data of 02 adsorbed on a 0.33 ML Au/Ni alloy surface... 75
Figure 6. Results of fitting three Gaussians to EELS data of 02 adsorbed on a 0.45 ML Au/Ni alloy surface...76
Figure 7. Results of fitting three Gaussians to EELS data of 02 adsorbed on a 0.51 ML Au/Ni alloy surface...77
Figure 8. Results of fitting three Gaussians to EELS data of 02 adsorbed on a 0.61 ML Au/Ni alloy surface...78
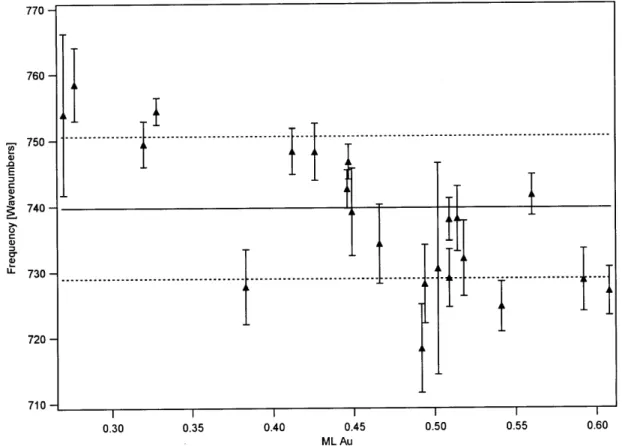
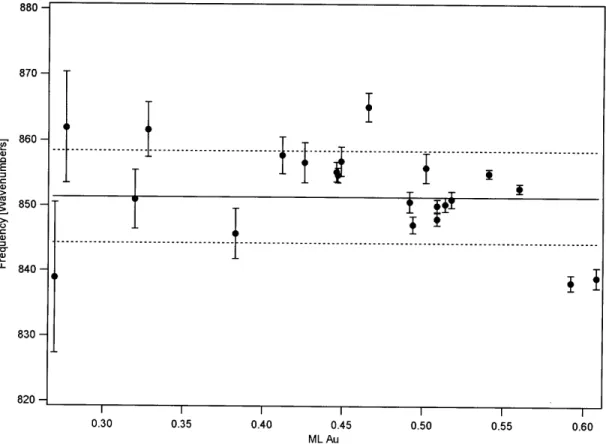
Figure 9. Frequencies of the 740 cm' 02 stretching feature as a function of Au coverage... 79 Figure 10. Frequencies of the 851 cm' 02 stretching feature as a function of Au
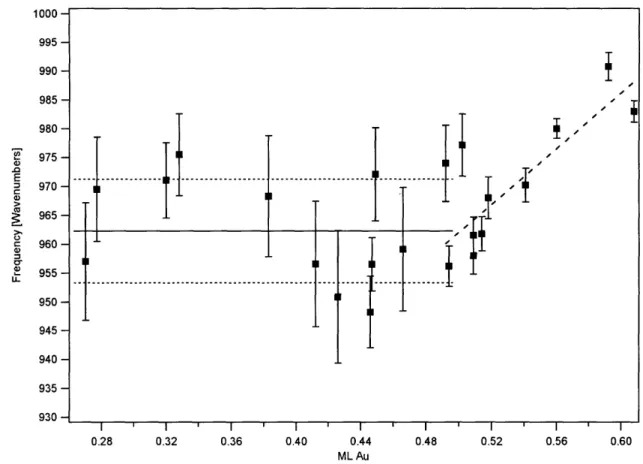
coverage... 80 Figure 11. Frequencies of the 962 cm' 02 stretching feature as a function of Au
coverage... 81 Figure 12. Confidence intervals calculated via Student's t test for the 950 cm'
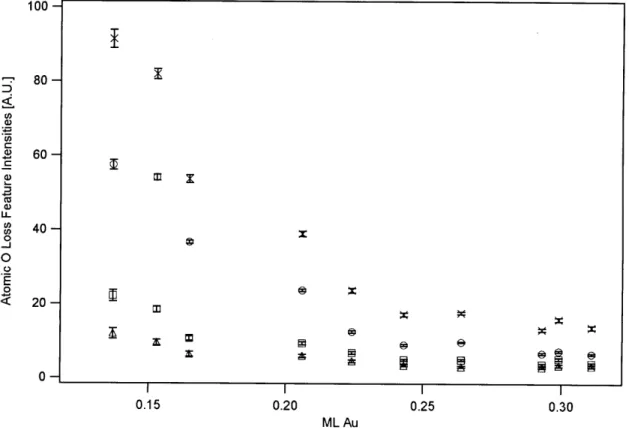
feature frequencies...83 Figure 13. Intensities of 02 stretching features as a function of Au
coverage... 84 Figure 14. Results of fitting three Gaussians to EELS data of 02 adsorbed on a
0.14 ML Au/Ni alloy surface...86 Figure 15. Results of fitting three Gaussians to EELS data of 02 adsorbed on a
0.21 ML Au/Ni alloy surface...87 Figure 16. Results of fitting three Gaussians to EELS data of 02 adsorbed on a
0.24 ML Au/Ni alloy surface...88 Figure 17. Results of fitting three Gaussians to EELS data of 02 adsorbed on a
0.30 ML Au/Ni alloy surface...89 Figure 18. Intensities of atomic oxygen stretching modes as a function of Au
coverage... 90 Figure 19: Frequencies of atomic oxygen stretching features as a function of Au
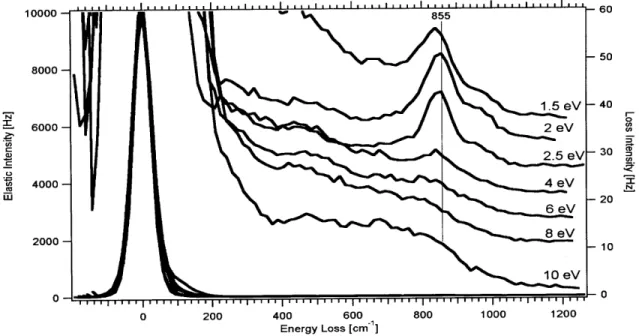
coverage... 91 Figure 20. HREELS spectra of 02 adsorbed on 0.51 ML Au/Ni( 111) measured at
different electron impact energies... 95 Figure 21. Integrated intensities of 02 stretching features as a function of impact
energy ... 96 Figure 22. Thermal decomposition of 02 on an 0.48 ML Au/Ni(1 11) alloy. 99 Figure 23. HREELS spectra of an oxygen saturated surface with 0.58 ML Au heated to various temperatures... 100 Figure 24. HREELS spectrum of a 0.58 ML Au/Ni alloy exposed to oxygen at
300 K ... 10 3 Figure 25. HREELS spectra of a 0.57 ML Au/Ni alloy exposed to oxygen, heated
to 300 K, exposed to CO, heated to 773 K and reexposed to oxygen. 104 Figure 26. Thermal desorption of 02 from an oxygen saturated 0.49 ML
A u/N i(111) alloy... 107 Figure 27. Thermal desorption of 02 from an oxygen saturated 0.37 ML
A u/N i(111) alloy... 108 Figure 28. Auger spectra of the 510 eV oxygen transition for a Ni(1 11) crystal after exposure to various amounts of oxygen... 110 Figure 29. Auger spectra of the 849 eV nickel transition for a Ni(1 11) crystal after
exposure to various amounts of oxygen... 111 Figure 30. Measured ratios of the 510 eV oxygen transition to the 849 eV nickel
transition at a variety of oxygen exposures... 112 Figure 31. Saturation oxygen coverage as a function of Au coverage... 116 Figure 32. Comparison of oxygen coverage determined via Auger electron
spectroscopy with intensities of EELS features attributed to peroxide and oxide species... 117 Figure 33. Example output from Monte Carlo simulation of a surface with 0.4 ML
Au... 124 Figure 34. Diagram of 02 adsorbed on a bridge site and potential atomic oxygen
adsorption sites that could block the 02 site... 125 Figure 35. Comparison of simulation output of molecular oxygen coverage for a
variety of different molecular oxygen binding rules... 127 Figure 36. Example output from simulation with different radii for blocking by atom ic oxygen... 128 Figure 37. Comparison of Monte Carlo simulation to experimental data for
molecularly adsorbed oxygen... 129 Figure 38. Comparison of Monte Carlo simulation to experimental data for
atomically adsorbed oxygen... 130 Figure 39. Apparent change in Au coverage after oxygen adsorption... 132 Figure 40. Schematic diagram of the displacement of surface Ni atoms after
exposure to oxygen ... 134 Chapter 3
Figure 1. Partial pressures of CO, CO2 and 02 measured during the exposure of
0.44 ML Au/Ni(1 11) alloy, covered with 0.22 ML of 02 to a molecular beam of CO... 147 Figure 2. Partial pressures of CO, CO2 and 02 measured during the exposure of
the back of the crystal manipulator to a molecular beam of CO using the s ame surface conditions as in Fig. 1...148 Figure 3. Partial pressures of CO2 measured during the exposure of oxygen
saturated Au/Ni(1 11) alloys at a variety of Au coverage between 0.15 ML and 0.63 ML Au, to a molecular beam of CO... 149 Figure 4. Integrated CO2 production observed when oxygen saturated Au/Ni(1 11)
alloy surfaces are exposed to a molecular beam of CO... 151 Figure 5. HREELS spectra of an oxygen saturated 0.46 ML Au/Ni alloy surface
before and after exposure to a 8.0 s molecular beam of CO... 152 Figure 6. Comparison of CO2 production with the intensities of molecular oxygen
features determined by HREELS... 154 Figure 7. Partial pressures of CO2 when an oxygen saturated 0.30 ML Au/Ni alloy
surface is exposed to a 8.Os molecular beam of CO... 156 Figure 8. Partial pressures of CO2 when an oxygen saturated 0.47 ML Au/Ni alloy
surface is exposed to a 8.Os molecular beam of CO... 157 Figure 9. Normalized CO2 production after a Au/Ni alloy surface is saturated
with oxygen and exposed to a molecular beam of CO multiple times. 158 Figure 10. Thermal desorption measurements of a 0.44 ML Au/Ni alloy surface
after exposure to molecular beam of 10% 02 in Ar, followed by a 8.0 s molecular beam exposure to CO...160 Figure 11. Partial pressures of CO2 when Au/Ni(1 11) alloy surfaces are exposed
to a 5.0 s dose of 10% 02 in Ar at 85 K, followed by an 8.0 s exposure to CO at 85 K and heated from 85 K to 400 K... 161 Figure 12. Integrated CO2 production as a function of Au coverage as Au/Ni
alloys are heated from ~85 K to 400 K at a rate of 2 K/s... 162 Figure 13. Comparison of integrated CO2 production as a function of Au coverage
as the crystal is heated from 85 K to 400 K with HREELS intensity of the 740 cm- feature attributed to molecular oxygen... 165 Figure 14. Partial pressures of CO when Au/Ni(1 11) alloy surfaces are exposed to
a 5.0 s dose of 10% 02 in Ar at 85 K, followed by an 8.0 s exposure to CO at 85 K and heated from 85 K to 400 K...166 Figure 15. Partial pressures of 02 when Au/Ni(1 11) alloy surfaces are exposed to
a 5.0 s dose of 10% 02 in Ar at 85 K, followed by an 8.0 s exposure to CO at 85 K and heated from 85 K to 400 K...167 Figure 16. Partial pressures of CO, CO2 and 02 measured during the exposure of
an oxygen saturated 0.47 ML Au/Ni(1 11) alloy to a molecular beam of CO after being heated to 300 K... 169 Figure 17. Partial pressures of CO, CO2 and 02 measured during the exposure of
the back of the crystal manipulator to a molecular beam of CO after an oxygen saturated 0.47 ML Au/Ni(1 11) alloy was heated to 300 K.. 170 Figure 18. Partial pressures of CO2 measured during the exposure of oxygen
saturated Au/Ni(1 11) alloys to a molecular beam of CO. The crystal was radiatively heated to 300 K prior to exposure to CO... 172 Figure 19. Integrated CO2 production observed when oxygen saturated Au/Ni
surfaces are exposed to a molecular beam of CO... 173 Figure 20. Partial pressures of CO and CO2 when oxygen saturated Au/Ni
surfaces are exposed to a molecular beam of CO... 174 Figure 21. Partial pressures of CO and CO2 when oxygen saturated Au/Ni
surfaces are heated to 300 K and exposed to a molecular beam of CO. 175 Figure 22. Calibration of CO2 production between unheated oxygen saturated
Au/Ni alloy surfaces and Au/Ni alloy surfaces that have been heated to 300 K are exposed to CO at 85 K... 176 Figure 23. HREELS spectra of a 0.55 ML Au/Ni surface after a 5.0 s dose of 10
% 02 in argon with the molecular beam, after radiatively heating the crystal to 300 K and after exposure to an 8.Os dose of CO using the m olecular beam ... 178 Figure 24. Partial pressures of CO, CO2 and 02 as an 8.0 s molecular beam of CO
is directed at a 0.47 ML Au/Ni alloy that has been saturated with oxygen and radiatively heated to 400 K prior to CO exposure... 180 Figure 25. HREELS spectra of a 0.53 ML Au/Ni alloy surface after being exposed
to a 5.0 s dose of 10% 02 in Ar at 85 K. Spectra were acquired before heating the crystal as well as after heating the crystal to 300 K
and 400 K ... 182
Chapter 4
Figure 1. Cross section of 21" access flange #11 showing detail of the sealing and differential pumping grooves... 189 Figure 2. Assembly drawings of 21" access flange #11 from the
front and side... 190 Figure 3. Front and rear views of flange #75, showing the features for mounting
and aligning the main chamber quadrapole mass spectrometer and 2.75" knife-edge flanges for electrical feedthroughs... 192 Figure 4. Cross section of manipulator flange assembly... 195 Figure 5. Cross section of bottom and base flanges and their
retaining hardw are... 198 Figure 6. Cross section and front view of 14" OD source pumping flanges..200 Figure 7. Cross section and front view of 12" OD access flanges and window
retaining rings... 202 Figure 8. Drawing of main chamber turbomolecular pumps,
gate valve and stands... 205 Figure 9. Cross section of ionizer cryostat for new experimental apparatus..209 Chapter 5
Figure 1. Diagram of water manifold in Room 6-136... 214 Figure 2. Schematic diagram of AC power distribution in the pump room.. 219 Figure 3. Schematic diagram of AC power distribution
in the laboratory, 6-134... 221 Figure 4. Diagram of the front panel of interlock box... 223 Figure 5. Schematic of main chamber interlock system...231
CHAPTER 1 FORMATION OF Au/Ni(111) ALLOYS AND Au COVERAGE DETERMINATION
I. INTRODUCTION
Heterogeneous catalysis is currently a multibillion dollar industry. Many industrial scale chemical processes rely on heterogeneous catalysis. Understanding the behavior of molecules at the catalytic interface is of great importance, both scientifically and economically. A viable catalyst must possess several traits: it must be able to facilitate the reaction of interest, it must be able to do so selectively, it must be resistant to catalytic "poisoning" and it must be cost effective. Unfortunately, for many reactions, oxidation reactions in particular, the only catalysts with suitable performance are expensive. For example, automobile catalytic converters use a mixture of platinum, palladium and rhodium to catalyze the reaction CO + 02 -+ CO2 - While platinum is
very effective at enhancing this reaction, it presently costs more than $1,600 per ounce and the current global demand for platinum by the automotive industry alone is about 1.8 million ounces per year2. There is a strong economic incentive to develop a catalyst for oxidation reactions that is less expensive.
One way to develop novel catalytic systems is to take a relatively inexpensive base metal and modify it by alloying it with another metal. The addition of even small amounts of another element can cause large changes in the structure and properties of the base metal. In particular, the electronic band structure of an alloy can be very different from the pure metals of which it is composed. The band structure in turn has a drastic effect on the adsorption of gas phase molecules. For example, Greeley and Norskov3 in
2005 in their calculations on binary transition metal surface alloys found that the addition of 0.33 ML of another element to the surface of a transition metal can alter the binding energy of oxygen by more than 1 eV.
The use of an alloy instead of a pure material also creates an additional experimental parameter of interest. Specifically, the ratio of the two components of the alloy can be varied, allowing the analysis of trends in reactivity on a variety of novel catalysts. An example is the development of a Au/Pd catalyst for the selective hydrogenation of 1,3-butadiene by Hugon et al.4 in 2010. They found that a mixture of less than 10% Pd in Au was capable of hydrogenating 1,3-butadiene to 1-butene. Moreover, they determined that by altering the ratio of Pd to Au the selectivity or activity of the catalyst could be favored.
Pure Ni has long been used as a catalyst for certain systems and it meets many of the above requirements for a viable catalyst. For example, Ni is used as a catalyst for the hydrogenation of alkenes to alkanes5 and for the steam reforming reaction, CH4 + H20 -+ CO + 3H2. Unfortunately, Ni catalysts used for steam reforming tend to become poisoned with carbon, limiting their useful life. Work by Holmblad et al.' showed that the addition of Au to a Ni catalyst increased the barrier to methane dissociation and greatly reduced the tendency for the catalyst to become poisoned by carbon. Ultimately, this research led to a patent by the Danish company Haldor Topsoe for a commercial Au/Ni catalyst for steam reforming'.
By itself, Ni is not a useful catalyst for the CO oxidation reaction. However, previous work by our group9has shown that Au/Ni(1 11) alloys are effective at catalyzing
the oxidation of CO to CO2 at temperatures as low as 70 K. This finding could be of great practical importance in developing a new generation of catalytic converters for automobiles. The Au/Ni alloy is orders of magnitude less expensive than the Pt/Pd/Rh catalyst currently in use, particularly because Au/Ni is a surface alloy with Au present only at the surface, as discussed below. Additionally, the Au/Ni alloy has the benefit of oxidizing CO to CO2 even at cryogenic temperatures, while Pt must be heated to about 600 K to be an effective catalyst2. The ability to effectively catalyze CO oxidation at low
temperatures is of great importance because a substantial amount of CO is emitted from vehicles during a cold start'0.
The Au/Ni(1 11) alloy system has been studied in some detail before. As mentioned above, Holmblad et al. determined that the addition of Au to a Ni(1 11) surface prevented the buildup of carbon when the Ni(1 11) surface was used for steam reforming. Jacobsen et al." and Nielsen2 has studied the Au/Ni(1 11) alloy system using scanning
tunneling microscopy (STM). They observed a rich variety of behavior depending on the amount of Au present on the surface. The Au/Ni(1 11) alloys were formed by vapor depositing small amounts of Au on a Ni(1 11) single crystal. They determined that the Au/Ni alloy was a surface alloy and that at Au coverages below 0.3 ML, Au atoms are present in the same layer as the Ni atoms and are located in random positions. Above 0.3 ML, the lattice strain caused by the larger Au atoms causes the formation of a number of triangular misfit dislocation loops and dendritic island growth from step edges on the crystal". The triangular loops have an average spacing of ~25 A between them and the areas between the loops are a random surface alloy of Au and Ni. However, ion
scattering measurements3 indicate that a random alloy is present up to 0.4 ML, with Au
coverage above 0.4 ML resulting in triangular misfit dislocations. The precise Au coverage at which the phase transition between a random alloy and triangular misfit dislocations is uncertain. Nevertheless, the diverse morphology of the Au/Ni(1 11) alloy system results in a great number of potential adsorption sites for catalysis.
The previous success at catalytic oxidation of CO to CO2 on Au/Ni alloys by our
group inspired the desire to study this system in greater detail. Unfortunately, it was soon realized that there were a number of inconsistencies in our previous data. These inconsistencies were determined to be the result of a faulty Au dosing system creating Au/Ni(1 11) alloy surfaces with uneven Au coverage. Additionally, there were problems with the method used to determine the Au coverage of the alloy surfaces. The present work attempts to rectify these problems as well as present a broader investigation into the behavior of oxygen species on Au/Ni(1 11) alloys. This chapter reports on the methods used to create Au/Ni(1 11) surface alloys and the procedure to determine the Au coverage of these alloys.
II. EXPERIMENTAL
A. Description of Experimental Apparatus
The experimental apparatus has been described elsewhere in significant detail". Briefly, it consists of an ultra high vacuum (UHV) main chamber (base pressure of about 7 x 10-11 Torr) for analysis coupled to a triply differentially pumped molecular beam source15. The main chamber contains a Ni(1 11) single crystal attached to an open
8 K using liquid helium. A type E thermocouple is spot welded to the crystal and used to measure its temperature. A thoriated tungsten filament behind the crystal is provided for heating. The crystal can be heated to about 400 K using radiative heating with a filament current of -5 A and an applied voltage of 4 V. The crystal can be heated to about 1300 K
using electron bombardment heating with an applied bias of 1000 V. A proportional integral differential (PID) controller is used, along with the thermocouple to maintain a constant crystal temperature or to increase the crystal temperature at a defined, linear rate". The cryostat and crystal are attached to a manipulator capable of linear motion in three axes and rotation about the vertical axis. The manipulator is mounted off-center on a differentially pumped rotatable lid. Rotating the lid allows the crystal to be translated over larger distances to access all of the instruments.
A number of analytical instruments are contained within the main chamber. A quadrupole mass spectrometer (QMS) located on the molecular beam axis allows for time-of-flight measurements, thermal desorption spectroscopy (TDS), residual gas analysis (RGA) and monitoring partial pressures of gasses during beam doses.
A high-resolution electron energy loss spectrometer (HREELS) is also mounted in the main chamber17
. HREELS is a technique for vibrational spectroscopy where a beam of low energy, nearly monoenergetic electrons (typically Ej = 5.5 V, FWHM = 50 cm-1) is
directed towards the crystal. Most of these electrons scatter elastically, but some transfer a portion of their energy to molecules adsorbed on the crystal surface by exciting vibrational modes in the adsorbates. The electrons are then detected as a function of energy. The difference in energy between the elastically and inelastically scattered
electrons is equal to the energy of the vibrational mode excited by the electrons. HREELS therefore provides information about the vibrational modes of the adsorbates present on the crystal surface, which in turn provides information about their identity and geometry.
An Auger electron spectrometer (AES) is present in the main chamber. AES is a technique where a beam of high energy electrons, typically 2 keV, is aimed at the crystal. Some of these electrons collide with the core electrons of atoms on the crystal and eject a core electron, leaving a hole. An electron from an outer shell then fills the hole left by the core electron and a third electron, called an Auger electron, is emitted. These Auger electrons have different, well defined energies depending on which element they originated from. By measuring the emitted Auger electrons as a function of energy, it is possible to determine what elements are present on the crystal surface. Auger electron spectroscopy is used to determine the amount of Au present on the crystal surface and to detect contamination of the surface.
A Au evaporation source, to be described in detail later, is mounted in the main chamber. This Au source is used to vapor deposit Au onto the Ni(1 11) crystal to create Au/Ni(1 11) surface alloys.
A beam valve is located in the second differential pumping stage between the wall separating it from the main chamber and isolates the main chamber from the differential pumping chambers for the molecular beam under normal conditions. The valve is sealed with a viton O-ring and is capable of withstanding an atmosphere of pressure differential in either direction. When the molecular beam is in use, the beam valve is opened to
allow the beam into the main chamber. There are two openings in the valve with different diameters. The larger opening or big beam hole is large enough that the entire crystal is exposed to the beam when the crystal is in TDS position. This position is used primarily for HREELS where uniform coverage across the entire crystal surface is desirable, because the electron beam may not be positioned precisely at the crystal center. The smaller opening or small beam hole is sized so that the beam covers most of the front face of the crystal when it is in TDS position, but does not expose the crystal manipulator, crystal edges, cold shield or crystal support posts to the beam. The small beam hole is used primarily for performing reactions and thermal desorption spectroscopy where avoiding effects from the crystal edges is important. There is also a shutter present in the first differential pumping stage that blocks the beam when it is closed. The shutter is used with an electronic timing circuit to provide accurate control of the time of exposure.
B. Description of Au Source and Quartz Crystal Microbalance
A Au evaporation source is used to vapor deposit Au onto the Ni(1 11) crystal to form Au/Ni(1 11) surface alloys. At the beginning of this research, an Au evaporation source that has been previously described in detail" was used. Although this Au source functioned properly, it suffered from a few serious drawbacks. Most importantly, its physical construction was not very durable. A Au droplet was attached to a tungsten filament that was supported by long tantalum rods. These rods were of small diameter and were prone to bending or sagging over time, resulting in a misalignment of the Au
S 0 0.26- 0.24-e 0.22-<S .a 0.20-0.18 -0.16 - 0.14-I II I II -0.15 -0.10 -0.05 0.00 0.05 0.10 Position [Inches]
Figure 1: Au coverage versus crystal position along the vertical axis using the old Au source with the source and crystal improperly aligned.
source with the Ni(1 11) crystal and a spatially uneven Au deposition. An example of the variation in Au coverage as a function of position is shown as Figure 1.
Additionally, it was difficult to determine the time of exposure necessary to obtain a specific Au coverage because the flux of Au atoms could not be controlled reliably. The Au coverage was estimated during dosing by measuring the current flowing through the tungsten filament to which the Au droplet was bound. A timer was used to estimate the amount of Au dosed by comparison to the time and current used during previous Au doses. Unfortunately, this method was not very repeatable. Small variations in filament current lead to large variations in the dosing rate and the actual Au coverage, 19
Figure 2. Schematic diagram of Au vapor deposition source. QC: quartz crystal oscillator, BC: barrel connectors, CW: ceramic washers, TF: tungsten filament, HS: heat shield, GD: Au droplet crimped to tungsten filament.
as measured by Auger electron spectroscopy after exposure to Au, often varied by more than a factor of two from the desired coverage. This procedure led to substantial amounts of wasted Au and time.
A new Au evaporation source was designed to mitigate these problems. A schematic diagram is shown in Figure 2. Instead of using thin rods to support the filament, the new source is constructed using 1.25" diameter stainless steel tubing with 0.125" thick walls. This rigid construction adds considerable mechanical stability. At one end, the tube is mounted to a cylindrical stainless steel mounting block, which in turn is mounted to a 2.75" knife-edge flange. This flange is of the same size and specifications as the flange for the old Au source, allowing the new source to be easily mounted to the chamber in the same place. At the other end of the stainless steel tube is another cylindrical piece with five small holes drilled in it. One of the holes is 0.25" in diameter and is located on the axis of the Au source. This hole allows Au vapor to 20
escape from the source and impinge on the crystal while minimizing the amount of Au contaminating other instruments in the chamber. The other four holes are 3/16" in diameter and serve as the mounts for four lengths of #4 threaded stainless steel rod. These rods are electrically isolated from the body of the source using commercially available aluminum oxide ceramic "hat washers" (McAllister Technical Services). A 0.008" tungsten filament is electrolytically cleaned in -1M NaOH solution. The filament is then bent into a vee shape and spot welded to two of the threaded rods. A razor blade is used to cut a radial slit along the length of a ~ 2 mm section of 2.0 mm diameter Au wire (Alfa Aesar, Premion, 99.9995%). The apex of the filament is placed in this slit and a pair of pliers is used to crimp the Au wire in place. A diagram of these steps is shown as Figure 3. The electrodes of a quartz crystal (to be described later) are spot welded to the other two rods. A 0.25" thick heat shield made of 304 L stainless steel is supported by the threaded rods between the filament and quartz crystal. The heat shield is also isolated from the threaded rods using aluminum oxide hat washers. A 0.25" diameter hole in the heat shield allows Au vapor to pass through the shield and hit the quartz crystal. The ends of the four threaded rods were reduced in diameter to about 0.06" using a lathe so that standard beryllium copper barrel connectors could be attached. Short pieces of copper wire were attached to the other side of these barrel connectors, which in turn were connected to the wires from four electrical feedthroughs in the 2.75" knife-edge flange. These feedthroughs allow reliable connection of the filament and quartz crystal to equipment outside the vacuum chamber. The rigid construction prevents the new Au
W Filament
Au Wire
Side View
Au Wire
Front View
Step 1
Step 2
Step 3
-Figure 3: Diagram for attaching Au wire to the tungsten filament. Step 1: A slit is cut into the Au wire with a razor blade. Step 2: The apex of the filament is placed in the slit in the Au wire. Step 3: A pair of pliers is used to crimp the Au wire to the tungsten filament by pressing on the Au wire where the arrows indicate.
source from shifting position during repeated heating and cooling cycles like the old Au source tended to do.
To address the difficulties in obtaining the desired Au doses, the new Au source was also equipped with a quartz crystal microbalance (QCM) for determining the approximate Au flux during deposition. A quartz crystal microbalance uses a quartz crystal oscillator to detect minute changes in mass. The frequency of a crystal oscillator is dependent on its mass. When Au is deposited on the face of the quartz crystal during dosing, the mass of the crystal is increased, lowering the frequency of its oscillation. During Au deposition, the frequency of the QCM is monitored as a function of time. The rate at which the frequency decreases is proportional to the flux of Au to which the Ni(1 11) crystal is exposed. The absolute flux is determined by comparing the QCM frequency data with the Au coverage measured after deposition as described in Section III.
Although several manufacturers offer commercial QCM systems, a homemade QCM was used with the new Au source. The primary reason for this decision was that the physical dimensions of the new source were extremely limited because it had to fit in the same location as the old Au source and there did not appear to be a commercial system that was sufficiently compact to be usable. The quartz crystal used in the new Au source was a standard, inexpensive 5.0000 MHz quartz crystal used for electronics and purchased from an electronics parts supplier (Digi-Key Corporation, P/N:X1026-ND). The metal can containing the quartz crystal was carefully removed by grinding with a
5.00000 Mhz
Quartz Crystal Microbalance
I M
Out put
4049 CMOS 4049 CMOS
Inverter Inverter
24 pF
Figure 4: Schematic of the QCM oscillator circuit.
handheld electric grinder or with a file. The crystal is made to oscillate using a simple circuit inspired by Ref. 19 and depicted schematically in Figure 4. The frequency of the oscillator is measured using a standard digital frequency counter (Hewlett-Packard Model 5328A). Although the frequency counter is capable of measuring with a precision of 0.1 Hz, in practice it required too much integration time for the frequency to stabilize to be practical. Frequencies were thus measured in units of 1 Hz. The exact frequency change per monolayer of Au changes somewhat depending on the exact position of the Au droplet and the quartz crystal, so different results were obtained each time the Au or the quartz crystal were replaced. Typical values for the change in QCM oscillator frequency
were on the order of 100 Hz per monolayer of Au. Typical dosing rates were approximately 1 Hz per 2-3 seconds, yielding a deposition rate of about 0.005 ML Au/s, at a filament current of about 4 A and an applied voltage of about 6 V. A laboratory power supply (Hewlett Packard 6281A) was used to heat the filament.
After initial fabrication of the new Au source, as well as whenever the source was disassembled to replace the Au droplet or filament, a testing and calibration procedure was performed. A small test vacuum chamber was constructed using a tee with 2.75" knife edge flanges, with the Au source mounted on one leg of the tee, a glass viewport on the opposite leg and a connection for pumping using the third leg of the tee. Pumping was accomplished using the turbomolecular pump usually used for evacuating the gas manifold. The Au source was installed in this test chamber and it was pumped down to a pressure below 1 x 10⁻⁵ Torr using the turbomolecular pump. After a suitable pressure was obtained, a laboratory power supply (Hewlett Packard 6281A, 9 V, 5 A max.) was used to heat the filament. The glass viewport allowed observation of the filament and Au wire crimped to it. The filament current was increased very slowly from zero to about 4 A over a period of perhaps one hour. The approximate temperature of the filament could
be determined by the color and intensity of the light emitted. A bright orange glow indicates that the Au droplet is near the melting point. Once the droplet temperature reached the melting point of Au (approximately 1337 K), the Au could be observed to liquefy nearly instantaneously and form into a spherical shape due to surface tension. If the melting procedure was successful, the HP 6281A power supply was quickly shut off and the Au source was allowed to cool before venting the test chamber and installing the
0.424-0.422 -0.420 - A AS 0.418 - e e 0.416 - e I II 0.|10 -0.15 -0.10 -0.05 0.00 0.05 0.10 0.15 Position [Inches]
Figure 5: Au coverage versus distance from crystal center. Constant Au coverage is
indicative of uniform coverage across the crystal surface and therefore, alignment of the Au source with the Ni(1 11) crystal. Circles represent translation along the vertical axis while squares represent translation along the horizontal axis.
source in the main UHV chamber. Unfortunately, sometimes the Au would fall off of the filament during melting and a new filament and piece of Au would have to be prepared. The test chamber allowed for multiple attempts at melting, if necessary, in a relatively short period of time and without the hassle of repeatedly venting and pumping down the main chamber and allowed direct visual observation of the filament and the Au during the entire process.
After the Au source was installed in the main chamber and the apparatus was pumped down, an alignment procedure was performed. The filament current was
adjusted using the power supply until the QCM frequency began to drop slowly. The Ni(1 11) crystal was placed in front of the Au source and a moderate amount of Au was deposited. The Ni(1 11) crystal was then placed in front of the Auger spectrometer and a spectrum was acquired. The Ni(1 11) crystal was then moved by a small amount and another spectrum was taken. Spectra were acquired in this manner every 0.025" along the horizontal axis and every 0.031" along the vertical axis until the crystal surface was no longer in front of the Auger spectrometer, as evidenced by a substantial drop in the incident electron beam current to the crystal, as measured by the Auger spectrometer. The Au coverage at each point was evaluated using methods described in the following section. If the Ni(1 11) crystal and the Au source were properly aligned, there were no systematic variations in the Au coverage, only small random variations. An example pattern of Au deposition indicating that the Au source and Ni(1 11) crystal are properly aligned is shown as Figure 5. Figure 5 shows Au coverage determined by AES, using the method described below, as a function of position on the crystal surface. The Au coverage along the vertical axis is shown as circles and the Au coverage along the horizontal axis is shown as crosses. As Figure 5 shows, the variation in Au coverage across the crystal is small, on the order of +/- 0.005 ML Au, and there does not appear to be a pattern to the variation. If the Au source were misaligned, the pattern of deposited Au would indicate which direction the Ni(1 11) crystal should be moved for the next try. For example, observation of a monotonically decreasing Au coverage from the top of the crystal to bottom indicates that the crystal was positioned below the center of the Au
0.55 - 0.50-0.45- Y 0.40 -0.35 -0.30 -0.25 -0.20 + I I I I I I I 20 30 40 50 60 70 80
QCM Frequency Change [Hertz]
Figure 6: The amount of Au dosed in monolayers as a function of the change in frequency of the quartz crystal microbalance (QCM). The line represents the best fit to the data.
source and should be positioned higher for the next Au dose. A variation in Au coverage of less than 5% was considered acceptable.
An additional calibration procedure was performed when the Au source was first constructed to ensure that the change in QCM oscillator frequency was linear with the amount of Au deposited. This procedure was also used to determine the approximate sensitivity of the QCM by measuring the change in frequency per monolayer of Au dosed. A clean Ni(1 11) surface was prepared and placed in front of the Au source. A small amount of Au, resulting in a 1-2 Hz change in the frequency of the QCM, was deposited on the crystal and an Auger spectrum was acquired. These steps of a small Au
dose followed by acquisition of an Auger spectrum were repeated many times until a significant amount of Au had built up on the crystal. The Au coverage was determined using the method described below. A plot of the Au coverage versus the total change in QCM frequency during the experiment was prepared and is shown as Figure 6. A line was fit to the data points using least squares fitting in order to determine the approximate sensitivity of the QCM. The slope of the line indicated that the sensitivity is about 0.005 ML Au/Hz.
C. Preparation of Au/Ni(111) Alloys
Prior to forming a Au/Ni alloy, the Ni(1 11) crystal surface was thoroughly cleaned. The primary method of cleaning is Ar* ion sputtering. A beam of 1keV Ar *
3.8-
3.6-
3.4-
3.2-500 520 540 560
Auger Electron Energy (eV)
Figure 7: Auger spectrum of a clean 0.32 ML Au/Ni surface in the energy range of the oxygen Auger transition. No oxygen Auger transition is visible in the 510 -520 eV range.
2.0- 1.5-'5 1.0- 0.5- 0.0-150 200 250 300
Auger Electron Energy (eV)
Figure 8: Auger spectrum of a clean 0.32 ML Au/Ni surface in the energy range of the carbon and sulfur Auger transitions. No carbon Auger transition is visible around 272 eV No sulfur transition is visible around 153 eV.
ions is directed at the crystal for 5 minutes while the crystal is held at ~ 85 K. The crystal is then annealed at 1000 K for 20 minutes and finally at 1300 K for 1 minute. The annealing period at 1000 K is performed primarily to remove Ar buried in the subsurface region by sputtering and to reform the (111) crystal structure after it is damaged by sputtering. The anneal at 1300 K serves to remove carbon from the surface by dissolving it deep enough into the bulk of the crystal that it is undetectable2 0. The cleanliness of the crystal is verified by the absence of features corresponding to carbon, oxygen and sulfur
60x103 _ -40 50-4 -30 o '40-C1 CD o 30--20 ' 20'-10 10-0 0 200 400 600 800 1000 1200 Energy Loss [cm
Figure 9: HREELS spectrum of a clean 0.32 ML Au/Ni surface.
as detected by Auger electron spectroscopy and HREELS. Auger spectra were acquired using a primary electron beam energy of 2 keV, a peak to peak modulation amplitude of 3 V, a scan rate of 4 eV/s and a lock-in amplifier time constant of 1 s. Example Auger spectra of the regions containing the oxygen transition and the carbon and sulfur transitions from a clean 0.32 ML Au/Ni alloy surface are shown as Figures 7 and 8 respectively. An example HREELS spectrum from the same surface is shown as Figure 9.
An additional cleaning procedure is used when there is persistent oxygen contamination. Frequently, small amounts of oxygen contamination are below the
3.6-C
3.4-
3.2-500 520 540 560
Auger Electron Energy (eV)
Figure 10: Auger spectrum of a Ni surface contaminated with a very small amount of oxygen. Note the absence of the 0 Auger transition between 510-520 eV.
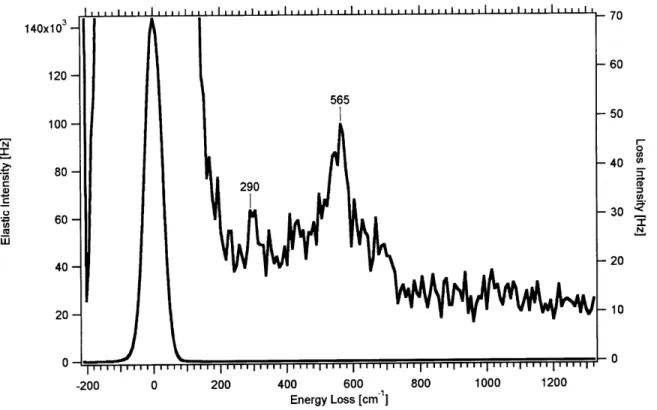
detection threshold for Auger electron spectroscopy. However, loss features attributable to atomic oxygen on Ni are readily visible in the HREELS spectrum. These features include the Ni-O stretch characteristic of atomic oxygen adsorbed on Ni at about 580 cm-and the S2 phonon at about 270 cm-1, which is much more prominent in vibrational spectra when small amounts of an adsorbate such as oxygen are present on the surface2 1.
Example Auger and HREELS spectra for a Ni surface contaminated with a small amount of oxygen that demonstrate this phenomenon are shown as Figures 10 and 11.
140x103 60 120-565 100- -50 = 0 80 -40 * 290 0-0 -200 0 200 400 600 800 1000 1200 Energy Loss [cm1]
Figure 11: HREELS spectrum of a Ni surface contaminated with a small amount of oxygen. The Ni-O stretch is readily visible at 565 cm'.
To remove this small but tenacious amount of 0 from the crystal, the crystal is positioned in front of the molecular beam in TDS position with the beam valve opened to the big beam hole position. The crystal is then heated to 1300 K via electron bombardment heating. The heater filament is turned off and the crystal is exposed to a beam of H2 with a stagnation pressure of 20 p.s.i. as it cools to below 100 K. The beam
is then shut off and the crystal is rapidly heated back to 1300 K to desorb the hydrogen, as well as any water formed. Ten to twenty such cycles is typically enough to remove the oxygen contamination.
After the crystal has been cleaned and its cleanliness verified using AES and HREELS, the Au/Ni surface alloy is formed by depositing Au vapor on the Ni(111) crystal surface. The crystal is held at 450 K using electron bombardment heating with a bias of 200 V during exposure to minimize carbon deposition from the Au source and to match the Au deposition conditions contained in Ref. 12. After Au deposition, the surface Au coverage is determined using AES and the methods described in Section III. The crystal is then annealed at 773 K for 10 minutes. Frequently, the surface cleanliness was then checked again using HREELS prior to collection of experimental data.
III. EVALUATION OF Au COVERAGE A. Auger Electron Spectroscopy
Gold coverage is determined via Auger Electron Spectroscopy (AES). Gold and Ni both emit Auger electrons with specific characteristic energies and the number of Auger electrons emitted is proportional to the amount of that element present in the system. The intensity of detected electrons at the proper energy can be used as a proxy for the concentration of the element under consideration. The primary spectral region of interest is between 50 eV and 120 eV because it contains intense Auger transitions for Au and Ni located at 74 eV and 64 eV, respectively. The energies given for these Auger transitions refer to the position of the local minimum when the Auger spectra are acquired in derivative mode. These transitions have sensitivity factors of 2.3433 and 1.5287 for the Au and Ni transitions, respectively22. The large sensitivity factors of these
transitions, relative to the reference element Ag as used in Ref. 22, result in a large signal and an excellent signal to noise ratio for the acquired spectra. Additionally, these
transitions are close together in energy, which minimizes potential error from the Auger spectrometer having a different sensitivity at different electron energies. The spectra are acquired in derivative mode to minimi e the effects of the large but gradually changing background.
If the Au and Ni transitions were spaced far apart in energy, it would be easy to determine the intensity of each transition and therefore the composition of the alloy by measuring the peak-to-peak height between the local maximum and local minimum of each of the transitions. However, the Au and Ni transitions are only about 10 eV apart, and have widths of the same order, making a simple peak-to-peak measurement impossible because the two transitions overlap. Additionally, at very low Au coverage, there are no visible maxima or minima that can be associated with the 74 eV Au transition. Rather, the presence of Au causes a small shoulder to appear on the much larger 64 eV Ni transition 1. For very low Au coverages, a peak-to-peak analysis is
impossible.
Because of these problems, a fitting procedure is used to determine the intensity of each transition. Two Gaussian derivatives are fit to the Au transition at 74 eV and the Ni transition at 64 eV to determine their intensities. Fitting was performed using the commercial data analysis software Igor Pro. Igor Pro utilizes the Levenberg-Marquadt algorithm with constraints23,24 for cui e fitting, which attempts to minimize the chi-squared values for the fit by iterativel adjusting the fitting coefficients. The intensity, energy and width of the Au and Ni tral sitions are allowed to vary independently, as well as a constant vertical offset. The inte val over which the fitting was performed ranged
3-
2-
0-
-1-50 55 60 65 70 75 80
Auger Electron Energy (eV)
Figure 12: Example output from the fitting routine for an Auger spectrum of a 0.44 ML Au/Ni surface. Crosses represent experimentally measured data points while the black line represents the fit to the data.
from 53 eV to about 74 eV. The upper limit for the fitting interval was adjusted for each Auger spectrum to minimize the fitting error for the intensities while keeping the local minimum within the fitting range. Standard deviations of the intensities of the Au and Ni transitions reported by the fitting routine are typically about 1% or less. An example of the output from the fitting routine for a Au/Ni alloy surface with about 0.44 ML Au is shown as Figure 12.
Although Auger electron spectroscopy is a surface sensitive technique, the electron beam from the Auger spectrometer does penetrate the crystal to some depth and the outgoing Auger electrons travel through several atomic layers. Therefore, atomic
layers other than the surface layer also contribute to the measured Auger signal. This factor complicates analysis of the Auger spectra because the Au/Ni alloy system is a surface alloy6 meaning that Au atoms are present only on the surface, while Ni atoms are present both at the surface and in the bulk.
If the sample were homogeneous throughout, it would be easy to determine Au coverage using the transition intensities and the sensitivity factors for each element and the following equation from Ref. 22:
pAuXAu IAu ^ A u (1)
Au Au Ni SNi
where pAu denotes the fraction of Au atoms in the surface layer, XAu is the mole fraction
of Au throughout the crystal, IAu and INi are the intensities of the Au and Ni transitions measured by the Auger spectrometer and SAu and SNi are the sensitivity factors for Au and Ni. However, since AES samples the composition of the crystal to some depth and Au atoms are only present on the surface while Ni atoms are present throughout, pAu is not equal to XAU and such a naive approach would underestimate the amount of Au present at the surface. The proper expression to use for the Au/Ni surface alloy system is:
PAU Au,Surface / Au / (2)
where IAu, Surface is the intensity of the Au transition coming only from Au atoms from the
first layer and INiSuface is the intensity of the Ni transition coming only from the Ni atoms in the first layer. Because Au atoms are only present in the top layer, IAu,Surface is equal to
IAU. However, the intensity of the Ni surface atoms, NiSurface is not a quantity that can
be measured directly. Only the total intensity INi can be measured, which is a sum of the intensity from the first layer as well as smaller intensity contributions from each subsurface layer:
INi ='Ni,Surface + Nil (3)
where INij is the contribution to the Ni intensity due to the lth layer. For the surface layer, we have:
Ni,Surface i,Surface Au
where I ure is the intensity from a pure Ni surface layer. For each subsequent layer,
the contribution becomes smaller because both the incoming electrons and outgoing Auger electrons are attenuated by the layers through which they must pass. For any given layer 1, the Ni intensity at the detector is given by:
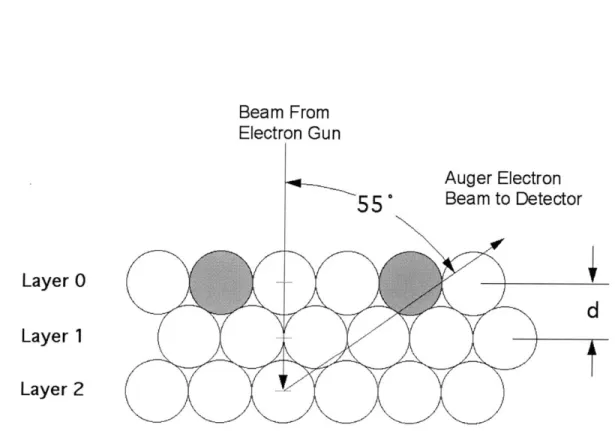
where di, and d, are the distances traveled by the incoming electrons and outgoing Auger electrons and Ai2 and A,, are the mean free paths for electrons at the relevant energies. Mean free paths were estimated from the universal curve2 5 using energies of 2 keV for the incoming beam and 64 eV for the outgoing electrons and are equal to 20 A and 5.5
A
respectively. The incoming beam is normal to the surface and the outgoing beam is approximately 550 from the normal due to the sampling angle of the Auger spectrometer. Therefore, the distances traveled are given by:d .'"ut =A-(1+0.5) and d, = 0.5)
cos(55*)
where A is the layer spacing (Figure 13). The complete expression for the measured Ni intensity then becomes:
0 -A-(1+0.5) -A-(l+0.5)
Ni NSurface eAu ASurf cos(55*)- (6 )
The summation converges after about 25 terms and is approximately equal to 0.525287.
SIN Surface ( u Surface -0.525287 (6b)
In principle, the quantity IJfaOce could be obtained from an experimental measurement of the Ni Auger intensity from a pure Ni surface. In this case, Eq. 6 becomes:
INi =i,Surface -1.525287 (7)
Equation 7 allows calculation of Ivju from a measurement of INi. Substituting Eq. 4 into Eq. 6 and rearranging yields:
INi,Surface = 'Ni - ure 0'525287 (8)
Beam From Electron Gun
Layer 0
Layer 1
Layer 2
Insertion of the value of IP"ffe into Eq. 8 would yield the desired value of INi,Surface and
hence allow calculation of the Au coverage from Eq. 2. However, there are two problems with this approach. The first problem is that the measured intensity of the Auger transitions varies somewhat from scan to scan, because of slight differences in crystal position and variations in the Auger spectrometer emission current. The potential changes in intensity between the measurement of a pure Ni surface and a Au/Ni alloy surface would add additional error to the Au coverage determination. The second problem is that after years of experimentation, a small amount of residual Au is present in the crystal that cannot be removed. This residual Au makes it impossible to determine the value of Ispure experimentally because the Ni crystal is not pure. Traces of Au present in the crystal would cause an experimentally measured value of Ispure to be too low because some of the Ni atoms are replaced with Au atoms.
Hence, the value of I pure must be determined iteratively. First, an estimated
value for pAu is calculated using Eq. 1. This value is then used to calculate Ipsurface using Eq. 6. A refined value for pAu is calculated using the new value of Ifre in Eq. 2. The last two steps are repeated until the value of PIAu converges after approximately 10 iterations.
Sensitivity factors used for this calculation were taken from Ref. 22 and are equal to 1.5287 for the Ni transition at 64 eV and 2.3433 for the Au transition at 74 eV. However, these sensitivity factors are measured at electron energies of 3 keV, while most of our Auger spectra were taken at 2 keV to make comparisons with previous data easier.