HAL Id: hal-02619087
https://hal.inrae.fr/hal-02619087
Submitted on 25 May 2020
HAL is a multi-disciplinary open access archive for the deposit and dissemination of sci-entific research documents, whether they are pub-lished or not. The documents may come from teaching and research institutions in France or abroad, or from public or private research centers.
L’archive ouverte pluridisciplinaire HAL, est destinée au dépôt et à la diffusion de documents scientifiques de niveau recherche, publiés ou non, émanant des établissements d’enseignement et de recherche français ou étrangers, des laboratoires publics ou privés.
Limited genetic structure and demographic expansion of
the Brassicogethes aeneus populations in France and in
Europe
Amandine Juhel, Corentin Barbu, Muriel Valantin-Morison, Bertrand Gauffre,
Raphaël Leblois, Jerome Olivares, Pierre Franck
To cite this version:
Amandine Juhel, Corentin Barbu, Muriel Valantin-Morison, Bertrand Gauffre, Raphaël Leblois, et al.. Limited genetic structure and demographic expansion of the Brassicogethes aeneus populations in France and in Europe. Pest Management Science, Wiley, 2019, 75 (3), pp.667-675. �10.1002/ps.5162�. �hal-02619087�
Version postprint
Accepted Article
Limited genetic structure and demographic expansion of the
Brassicogethes aeneus populations in France and in Europe
Amandine S JUHEL1, Corentin M BARBU1, Muriel VALANTIN-MORISON1, Bertrand GAUFFRE2, Raphaël LEBLOIS3,4, Jerome OLIVARES2, Pierre FRANCK2
1
UMR210 Agronomie, INRA, AgroParisTech, Université Paris-Saclay, 78850 Thiverval-Grignon, France
2
UR1115 Plantes et Systèmes de culture Horticoles, INRA, F-84914 Avignon cedex, France
3
CBGP UMR 1062, INRA, CIRAD, IRD, Montpellier SupAgro, Univ. Montpellier, Montpellier, France
4
Institut de Biologie Computationnelle, Univ. Montpellier, Montpelier, France
Correspondance: Amandine S. Juhel. UMR Agronomie, INRA, AgroParisTech, Université Paris-Saclay, 78850 Thiverval-Grignon, France.
Email: juhelamandine1@gmail.com. Tel: +33 1 30 81 54 08
Email address of all co-authors: corentin.barbu@inra.fr, pierre.franck@inra.fr, muriel.morison@inra.fr raphael.leblois@inra.fr bertrand.gauffre@inra.fr jerome.olivares@inra.fr
This article has been accepted for publication and undergone full peer review but has not been through the copyediting, typesetting, pagination and proofreading process, which may lead to differences between this version and the Version of Record. Please cite this article as doi: 10.1002/ps.5162
Version postprint
Accepted Article
Abstract
BACKGROUND: The pollen beetles, Brassicogethes aeneus (Fabricius, 1775), is one of the most significant pests of oilseed rape. To shed light on past and present pollen beetle demography (dispersal, population size), twelve microsatellite markers were developed and population genetic diversity and structure were analyzed at different spatial scales in France and in Europe from 433 individuals collected in 18 winter oilseed rape fields.
RESULTS: The genetic differentiation among the population samples was low but significant between the Estonian sample and the rest of Europe. Isolation by distance was only significant at the European scale. The genetic variability was similar among the 18 population samples. Demographic inferences suggested a recent expansion of B. aeneus population size over Europe, possibly corresponding to an increase of oilseed rape crop’s area during the last decades.
CONCLUSION: Current population size and dispersal are not straightforward to estimate from the distribution of genetic variability in B. aeneus over Europe because of the complexity of the demographic history of the pests. Nevertheless, as gene flow was important enough to prevent strong genetic differentiation at large geographical scales, the management of pollen beetle populations should likely be thought at the European continental level.
Keywords: Brassicogethes aeneus, genetic diversity, genetic structure, microsatellites, oilseed rape, pollen beetles
Version postprint
Accepted Article
1 Introduction
Population genetic studies on crop pests provide information on the spatial scales at which population structure and gene flow occurs. Such information can help defining spatially relevant strategies of pests control1. In addition, genetic diversity contains information on past and present demography that could be useful to characterize the demographic history of crop pests.
The pollen beetle (Brassicogethes aeneus, Fabricius, 1775), formally named Meligethes
aeneus (Fabricius, 1775) is one of the major pests of oilseed rape (OSR) crop in Europe2. After their emergence from overwintering areas in early spring, adults migrate to OSR fields to feed on pollen and oviposit in buds, thereby inflicting severe yield losses3. Larvae also feed on OSR flowers before dropping down on the ground to pupate2. The new generation emerges in early summer (June) and seeks for overwintering sites outside the crop, mainly in woodland habitat. Consequently, the pollen beetle dispersal is split in two phases, one in spring and one in summer4, between crops and semi-natural habitats5, suggesting important gene flows at the scale of a few kilometers.
In a study based on mitochondrial DNA, five phylogenetic groups of pollen beetles were identified in Europe: a first one in England and Wales, a second one in Scotland, a third one in South Eastern Europe (Italy, Romania and Greece), a fourth one in North Western Europe (France, Germany, Belgium), and a fifth in the Baltic and Scandinavian countries6. Studies based on amplified fragment length polymorphism (AFLP) suggested a high level of gene flow between pollen beetle populations in Sweden7, but confirmed genetic structure among European pollen beetle populations8. However, the study of contemporary processes affecting genetic variation and genetic structure requires more variable genetic markers9. Microsatellite markers are highly polymorphic with an estimated average mutation rate of roughly µ = 5 x 104,10 compared to an average of roughly µ = 6 x 10⁻⁸ for mitochondrial DNA. In addition, microsatellite are co-dominant genetic markers, abundant throughout the genome and cost effective to develop and screen. These properties have made microsatellite markers very popular in population genetics studies, as they allow the investigation of spatial genetic structure and demographic changes at small geographic and temporal scales11.
OSR cropped area in Europe has strongly fluctuated in the recent history, which may have affected the demography of the pollen beetle populations. OSR was first cropped during the middle age in Flanders and was the main source of vegetal oil until the middle of the nineteenth century in Europe12. In France, OSR cropped area peaked up to 200 kha in 1862,
Version postprint
Accepted Article
before coming down to 11 kha in 1939 because of the progressive replacement of OSR oil by peanut oil from the colonies12. Oleaginous crops in France raised up again after the Second World War: 391 kha in 1970, 460 kha in 1982, and 1600 kha in 201212,13. In Europe, the expansion of the OSR cropped area likely followed a similar trend but might have been even more sudden. For example in Finland, OSR cropped area raised from 10 kha in 1973 to 70 kha in 199314. Following the expansion of OSR cropped area over the last 60 years in Europe, pollen beetle population size would have been expected to increase. However, OSR crops were treated using large amounts of pesticides in most European countries since 195015, which might have inversely reduced pollen beetle population size. As a consequence of these treatments, the pollen beetle has developed resistance to several insecticides16,17, and resistance to the pyrethroids have spread throughout Europe since 200016, which may have reduced the impact of the pesticides on variations in pollen beetle population sizes.
The aim of this paper is to report analyzes of the genetic variation and structure in pollen beetle populations at various spatial scales in Europe using microsatellite markers. First, we developed microsatellite markers in B. aeneus and cross amplification on another OSR pest, Brassicogethes viridescens. Second, genetic structure among pollen beetle populations from 18 OSR fields was assessed using the newly designed microsatellite markers. Third, temporal change in pollen beetle population effective sizes was investigated to test if it increased with OSR cropped area in the recent history.
2 Material and Methods
2.1 Study sites and pollen beetle sampling
Pollen beetle adults were collected in 18 fields organized at three nested spatial scales: six OSR fields at a fine spatial scale in the Eure department in France (Fig. 1a), seven fields from various other regions in France (Fig. 1b) and five fields from five other European countries (Fig. 1c). Hereafter, each sampled field was considered as a different pollen beetle sampling site. Pollen beetle were collected by beating in one point of each field. Collection took place in spring 2015 with the exception of the sampling sites from Switzerland (spring 2014) and of the six French sampling sites from Eure (spring 2016). All individuals were identified at the species level comparing their meta-femur18. B. viridescens as a spine on the meta-femur whereas the meta-femur of B.aeneus is smooth. Most pollen beetles were identified as B.
aeneus (99%), but several B. viridescens individuals were collected at location 12 (70% were B. aeneus and 30% were B. viridescens). Hereafter, we only used the B. aeneus individuals
Version postprint
Accepted Article
2.2 DNA extraction
DNA extractions were performed in 96-well format plates. First, pollen beetle tissues were ground in 50 µL of H2O using a 2 mm steel bead using a 1600 MiniG (Spex® SamplePrep)
homogenizer at 1500 strokes/min for 30 seconds. Second, tissues were digested at 56°C for 14 hours in a 100 µl solution including 10% Chelex® 100 (Biorad) and 3% proteinase K using a Mastercycler thermocycler (Eppendorf). The tissue digestion was stopped by a final thermocycler step of 30 min at 98°C. Finally, the supernatant of this solution was used as DNA template for the PCR reactions.
2.3 Development of microsatellite markers
An enriched DNA library with microsatellite sequences was produced following Malausa et al.,19 on 9 pollen beetles from three different oil seed rape fields in France. The DNA library was produced by GenoScreen (Lille, France) using Roche 454 GS-FLX Titanium pyrosequencing. A total of 255 microsatellite markers were identified by their number of repetitions out of the 93,675 DNA sequences obtained (0.3%). The 48 longest microsatellite sequences were selected and a primer pair was chosen for each of them using Primer320. Each forward primer was tailed with a labelled M13 sequence21. PCR amplifications were carried out independently for each microsatellite locus in a 12 µl reaction volume containing 1X GoTaq® Flexi Buffer, 1.5 mM MgCl2, and 0.1 mg/ml Bovine Serum Albumin, 200 µM of
each dNTPs, 0.4 µM of reverse primer, 0.4 µM of labelled M13 forward primer, 0.04 µM of M13-tailed forward primer, 1 unit of GoTaq® Flexi DNA Polymerase (Promega) and 2 µl of DNA template. The PCR conditions were: 5 min at 95°C followed by 30 cycles at 95°C for 30 s, 54°C for 45 s, and 72°C for 45 s, followed by 10 cycles at 94°C for 30 s, 50°C for 45 s, and 72°C for 45 s with a final extension step at 72°C for 10 min.
We tested PCR amplification at these 48 microsatellite loci on six B. aeneus individuals with labelled M13 forward primers. For the loci that amplified, we verified their variability for population genetic studies on 20 additional B. aeneus individuals from location 1 (Fig. 1). For each microsatellite locus, we calculated the number of alleles, the observed heterozygosities (HO) and gene diversities (HE). We estimated the frequency of null alleles following Brookfield (1996). We tested deviations to Hardy-Weinberg equilibrium (HWE) using Genepop, version 4.2.222. We selected the polymorphic loci with less than 10% of null allele and at HWE.
The selected microsatellite loci were combined in PCR multiplex, labelling each forward primer with a fluorescent dye at their 5′-end (Table S1), either 6-FAM (6-carboxyfluorescein),
Version postprint
Accepted Article
or HEX (hexachloro-fluoresceine), or TAMRA (carboxy-tetramethyl-rhodamine), or ATTO
565 (Rhodamine dyesclass). These loci were also tested on nine B. viridescens individuals
from location 12 to verify interspecific cross-amplification.
2.4 Microsatellite analysis
A total of 433 pollen beetle individuals from the 18 OSR sample sites were genotyped at the selected microsatellite loci (Table 1). PCR amplification was carried out with a Mastercycler thermocycler (Eppendorf) in a 10 µl reaction volume containing 5 µl of master-mix (QIAGEN), 2 µl of primer-mix (primers concentration ranging from 0.13 to 2.50 µM, Table S1), and 2 µl of DNA template. The PCR conditions were: 15 minutes at 95°C followed by 35 cycles at 94°C for 30 s, 54°C for 90 s, and 72°C for 1 min with a final extension step at 72°C for 20 min.
Each PCR multiplex product was diluted in 40 µl H20. Two microliters of this dilution was
added to 7.8 μl of HiDi formamide, and 0.2 μl GeneScan™- 600 LIZ® Size standard (Applied Biosystems). This was injected on an ABI 3730xl DNA Analyzer using POP7 polymer (Applied Biosystems). Genotypes were scored using GeneMapper®, version 4.1 (Applied Biosystems).
2.5. Statistical analysis
2.5.1. Genetic diversity
For each sample site, deviation from Hardy-Weinberg equilibrium (HWE) for each locus and linkage equilibria for each locus pair were tested with GENEPOP version 4.2.222. The proportions of heterozygous genotypes (HO) and unbiased estimate of gene diversities (HE) were calculated at each locus for each sample site according to Nei23 using GENEPOP. Allelic richness (Ar) in each sample site was estimated using a rarefaction method, using the HP-RARE program24, which was parameterized with the smallest population sample size at site 8 (n=16) as the reference. Allelic richness, observed heterozygosities, and gene diversities were compared between population samples using Mann-Whitney-Wilcoxon tests.
2.5.2. Population genetic structure at multiple scales
First, to explore the number of homogeneous genetic clusters (K) within our dataset, population genetic structure across all sample sites was assessed using Bayesian clustering in STRUCTURE version 2.225. For each model with values of K from 1 to 20, we performed 10 runs of 2,000,000 iterations after a ‘burn-in’ period of 500,000 iterations. Individual assignations were computed assuming admixture among the K groups and non-equal
Version postprint
Accepted Article
contribution of the K sources to the admixture. As recommended by Wang26, the geographical locations of the sampled individuals was used as prior in the simulations. Results were summarized using the standard pipeline on the CLUMPAK web server27. The most likely number of clusters (K) was explored using the estimated logarithm of likelihood (LnP(D)) and the ∆K method 28 that finds the point of greatest change in the distribution of LnP(D) with STRUCTURE HARVESTER version 0.6.9229. Each individual was assigned to the cluster for which the membership coefficients Q was the highest25.
Second, genotypic differentiation between population samples was calculated (FST) and tested using GENEPOP and isolation-by-distance (IBD) was analysed by regressing pairwise estimates of FST /(1 – FST) against the logarithm of geographical distance between sample
sites30. We also tested the groups found with STRUCTURE. IBD was tested using a Mantel test (1000 permutations) at different spatial scales using i) all the 18 sample sites, ii) 17 sample sites excluding the Estonian sample site, iii) the 13 sample sites located in France and
iv) the six Eure sample sites (Fig. 1). The inverse of the IBD slope was used to estimate the
genetic neighborhood size Dσ² 31, a composite parameter that describes the strength of isolation by distance32, where D is the effective density of adults, and σ² is the mean squared parent-offspring dispersal distance.
2.5.3. Past demographic changes
Gene diversity (HE) at a locus within a population can differ from the gene diversity expected at mutation-drift equilibrium for the same number of alleles (Heq) due to demographic changes33. In order to test if there has been a recent population expansion in Europe (i.e. HE <
Heq), we have estimated Heq using two contrasted models of mutation for the microsatellite markers, the stepwise (SMM) and the two-phase (TPM) mutation models with BOTTLENECK version 1.233. Under the TPM, Heq was computed using 50% single-step mutations, 50% multiple-step mutations and a variance among multiple steps of 12. Difference between HE and Heq was tested for each sampling site separately, for pooled samples from Eure, for pooled samples from France and for all the samples pooled using the two tailed Wilcoxon’s signed-rank test.
Population demographic history was further explored using the OnePopVarSize model implemented in the MIGRAINE software, which uses coalescent simulations under a maximum likelihood framework34. The OnePopVarSize model infers parameters of a continuous past variation in population size for a single population using a generalized stepwise mutation model (GSM) adapted for microsatellite loci. MIGRAINE infers point estimates and 95% confidence intervals (95% CI) for up to five parameters: pGSM, the
Version postprint
Accepted Article
parameter of the geometric distribution describing the number of repeats removed or added to the ancestral state for each mutation; 2Nµ, the current population size scaled by the mutation rate per generation and locus; 2Nancµ, the scaled ancestral population size; and Dgµ, the duration of the population size change scaled by mutation rate. An additional composite parameter, Nratio, is inferred to better characterize the strength of the change between current and ancestral population sizes (Nratio.= N/Nanc). Past changes in population size are thus significant when the Nratio 95% confidence interval does not include one. We fixed initial large ranges for all parameter value since MIGRAINE can automatically expand or reduce the parameter range explored between different iterations. We inferred past changes in population size with a dataset pooling all the genotyped individuals from the 13 French sites and using the PACanc algorithm to estimate likelihood. Preliminary runs were performed using 2,000 points, 5,000 trees, and 5 iterations. Next, final runs were performed using 6,000 points, 20,000 trees, and 3-5 iterations with narrow parameter ranges deduced from the preliminary runs. We used a mutation rate of 5 × 10⁻⁴ per locus per generation for all microsatellite loci 10 to convert scaled parameter estimates into biological reliable ones (i.e. N, Nanc, and Dg).
3 Results
3.1 Design and selection of microsatellite markers
The DNA library produced using Roche 454 GS-FLX Titanium pyrosequencing provided 93,675 sequences among which 255 were available to design microsatellite markers. Out of the 48 markers designed, 23 amplified on the six pollen beetle individuals tested and were selected for amplification on a reference sampling site of 24 individuals from location 11 (Figure 1). Among these 23 loci, twelve were finally used to study the genetic of pollen beetle populations. First, we discarded two loci that were monomorphic (DMBX2,
Ma-ERC7C1). Second, we discarded nine additional loci that were not at HWE and that showed
proportions of null alleles over 10 % in the reference sampling site (C6CAE,
C5QWM, D904J, DCGTK, EJCJJ, EL5EB, C2D1M, DJDOQ, Ma-EGYLO).
At these twelve remaining loci, the number of alleles ranged from three to nine (mean = 6.00), the gene diversity (HE) ranged from 0.17 to 0.85 (mean = 0.63) and proportion of heterozygotes (HO) ranged from 0.18 to 0.87 (mean = 0.60) (Table 1). The proportions of null allele did not exceed 0.09 (mean = 0.03). Among these twelve B. aeneus microsatellite loci, nine markers successfully cross-amplified in B. viridescens, of which seven were observed
Version postprint
Accepted Article
polymorphic (Table S2). Furthermore, four of these loci had alleles observed in B. viridescens but not in B. aeneus (Ma-C4QRG, Ma-D3QFM, Ma-DDEYS, Ma-DQM5T).
3.2. Genetic variability in pollen beetle populations
In total, 433 individuals from 18 OSR fields in Europe were genotyped at the 12 microsatellite loci. The number of alleles per sampling site and per locus ranged from 4.8 to 6.5. The only significant linkage disequilibrium was observed between loci Ma-EL7YR and
Ma-DCH30 in one sampling site (location 5) deemed insufficient to discard one of them.
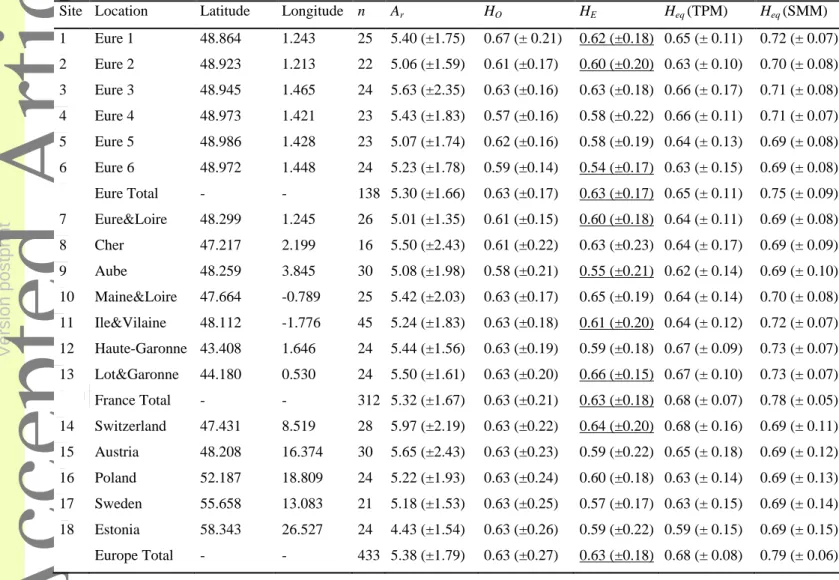
Multi-locus tests did not reveal any significant departure from HWE in any of the 18 sampling sites. Observed heterozygosities (HO) ranged from 0.54 to 0.67, with a mean value of 0.60 across all loci and sampling sites. Similarly, gene diversities (HE) ranged from 0.57 to 0.64 with a mean value of 0.62 across all loci and sampling sites. The mean allelic richness (Ar) ranged from 4.4 to 5.9 with a mean value of 5.2 across all loci and sampling sites (Table 2). No difference in polymorphism was detected between the 18 sampling sites using HE, HO or
Ar (p > 0.05).
3.3. Genetic structure at multiple scales
The most likely value of K from the STRUCTURE analysis based on the ∆K method28 method or on LnP(K) was three (Table S3). For 404 out of the 433 individuals, the estimated membership coefficients Q in each cluster, was the highest in the first cluster (343 individuals had Q>0.5 in this first cluster). All 24 individuals from Estonia had the highest Q value in the second cluster (all with Q>0.5). None of the 433 individuals had a Q value above 0.5 in the third cluster, but four individuals from Switzerland had their highest Q value in this third cluster (Fig. 2).
Out of the 153 pairwise FST values calculated between sample sites only 31 were associated to significant genetic differentiation (p < 0.05), all including at least one easternmost sample site (i.e. samples from Estonia, Poland or Sweden, Table S4). Consistently with the STRUCTURE results, all pairwise FST values including the Estonian sample site significantly differed from zero (p < 0.001), suggesting that pollen beetle from Estonia might be an outlier sampling site in comparison with the other genotyped sampling sites. Global FST over the Eure sampling sites and over the French sampling sites did not significantly differ from 0 (respectively, Fischer’s exact test, p = 0.79 and p = 0.18). Global FST over the European countries (grouping all individuals from France in one sampling sites) was 0.0082 (p < 0.001) or 0.0041 (p = 0.001), respectively with or without the Estonian sampling site. FST between all populations and Estonian population samples was 0.0218 (p < 0.001).
Version postprint
Accepted Article
Mantel’s test for isolation by distance revealed significant positive correlations between genetic differentiation and geographical distance when all sampling sites were considered (Fig. 3; FST /(1 − FST) = -0.0125+ 0.0029*ln(km); p = 0.001). Isolation by distance was also significant when excluding the Estonian sampling sites (FST /(1 − FST) = -0.0058 + 0.0014*ln(km ), p = 0.01), but not when only the French or the Eure sampling sites were considered (FST /(1 − FST) = -0.0030 + 0.0008*ln(km ), p = 0.20 and FST /(1 − FST) = -0.0040 + 0.0012*ln(km ), p = 0.23 respectively). Neighborhood size was not calculated on the full dataset as STRUCTURE analysis revealed that the Estonian sample site was isolated from the rest of Europe. The estimate of genetic neighborhood size Dσ² was 57 individuals based on the European dataset excluding the Estonian sample site and 100 for all France samples pooled.
3.4 Past demographic changes
Each sampling sites were analyzed separately with BOTTLENECK. In any case, the mean gene diversities (HE) was lower than the gene diversities (Heq) expected for the same number of alleles at mutation drift equilibrium with both TPM and SMM mutation models in agreement with signals of demographical expansions. The deficit of gene diversity HE in comparison with Heq was significant in nine out of the 18 sampling sites with SMM but was not significant for the TPM (Table 2). The deficit of gene diversity was significant under SMM for the pooled sampling sites from Eure, France and overall. No significant excess of gene diversity HE in comparison with Heq was detected with the TPM model.
To shed light on the history of past demographic changes in B. aeneus populations, a MIGRAINE analysis was performed on a dataset pooling all the genotyped individuals from the 13 French sites among which no genetic structure was detected. Outputs from the MIGRAINE analysis were consistent with those from BOTTLENECK analyses supporting a recent population expansion. The scaled current population size (2Nµ: 15.9, 95% CI: [4.7-2,715]) was larger than the scaled ancestral population size (2Nancµ: 2.7, 95% CI: [1.7-632]), and Nratio confidence interval excluded one, despite being relatively large (5.9, 95% CI: [1.2-41.2]). Dgµ was estimated to 0.02 (95% CI: [0.003-0.44]). Based on an average mutation rate of 5 x 10⁻⁴ 10, population expansion was estimated to begin 40 generations ago (95% CI = [5.4-1,740]) while current and ancestral population sizes were 7,970 (95% CI: [2,370-1,357,500]) and 2,930 (95% CI: [607-20,630]), respectively. Note that pGSM was estimated to be 0.375, which suggest that mutation on those markers are often multistep rather than single step, and thus do not fit a SMM.
Version postprint
Accepted Article
4 Discussion
We have developed a set of twelve microsatellite markers for B. aeneus, a coleopteran pest for which no such markers were previously available. Using this set of highly polymorphic genetic markers we genotyped 433 B. aeneus individuals collected in 18 different OSR fields in France and Europe. These 12 microsatellite loci were selected among 48 markers designed from an enriched DNA library using a high-throughput 454 pyrosequencing approach. The proportion of microsatellite loci selected to study B. aeneus population genetics was relatively low in comparison with the number of markers designed, but similar to the proportion of microsatellite loci selected for population genetic study with the same method in other coleopteran species such as the ground beetles Carabus nemoralis35 and Poecillus cupreus36 or the invasive western corn rootworm Diabrotica virgifera virgifera37. Interestingly, nine out of the twelve selected microsatellite loci in B. aeneus amplified and seven were polymorphic in B. viridescens, another closely related OSR pest38. These loci are likely good candidates for population genetic studies in other Brassicogethes species, though additional evaluation of their polymorphism and neutrality is necessary39. In addition, four loci had alleles detected in
B. viridescens that were absent in B. aeneus, which might be used to differentiate larvae of
these two sympatric species in the OSR crops40.
4.1. Lack of population genetic structure
Overall, the B. aeneus genetic structure based on microsatellites markers was low at the scale of our study area. The STRUCTURE analysis clearly supported an isolation of the Estonian samples from the rest of Europe. Genetic differentiation between all populations pairs including the Estonian sample were significant but FST values were always lower than 0.05, in agreement with little genetic differentiation41. The number of genetic clusters estimated with STRUCTURE in our dataset was three. It has been suggested that the STRUCTURE algorithm may detect non-existent clusters when geographical sampling is clumped along an IBD cline42 and IBD was significant at the European scale when excluding the Estonian sample site. The STRUCTURE plots was thus consistent with an overestimation of the genetic structure due to IBD as ancestry proportion of individuals assigned to the third cluster increased with eastern longitude in Austria, Poland, Sweden and Estonia. The detection of three clusters with STRUCTURE may also correspond to post glacial admixtures between B.
aeneus populations that had differentiated in different refuges in southern Europe during the
last glaciations43,44. Although, in general, the mitochondrial polymorphism does not inform a lot on population demography because of recurrent adaptive evolution45, it is very suitable to
Version postprint
Accepted Article
reveal population structure because of absence of recombination43. Ouvrard et al.6 analyzed mitochondrial DNA sequences (COI) from number of pollen beetles collected over the European continent. Interestingly, they also delimited three groups of pollen beetle populations in the Baltic and Scandinavia, in western and central Europe and in south-eastern Europe, which roughly overlaps with the genetic structure we observed with the microsatellite loci in this study. Kazachkova (2008)8 found an even stronger genetic structure between European populations using AFLP markers. Differences between studies in the degree of population genetic structure are likely to mainly correspond to differences in the markers used, notably because of the dominance of AFLP markers, and to differences in the geographical distributions of the analyzed population samples. At a smaller spatial scale, genetic differentiation was low and not significant among the samples from the French department Eure (FST = 0.001) and among the French samples (FST = 0.003) in agreement with the lack of population genetic structure observed in Sweden with the AFLP7.
4.2. B. aeneus demographic changes in recent history
Consistent with the lack of genetic structure, genetic diversity was similar across the different European sampling sites suggesting a common demographic history of the pollen beetles across Europe46. Temporal variations of the effective population size were expected given the variations in OSR cropped surfaces in Europe as pollen beetles need oilseed rape buds for their oviposition2. The OSR cultivated surfaces are in the 2010’s at an all-time high. OSR is recent on the evolutionary time scale (1,000 years or generations of pollen beetles), and the cultivated surfaces went up 4, 145, or 8 folds in respectively 40, 80 or 150 years in France (figures likely to be generalizable at the European scale). It was reasonable to expect an increase of B. aeneus population not only with the late increase of OSR surfaces but even more drastically since the middle age with the apparition of OSR crops14. The hypothesis of a demographic expansion of B. aeneus population was confirmed by the results of both the BOTTLENECK and MIGRAINE analyses. Point estimates of the demographic parameters computed with MIGRAINE supported a limited expansion of the pollen beetle populations of about 6 folds in the last 40 years. However, we should take into consideration large CI’s that encompass very high current population size and much older start of expansion that might result from successive expansion and contraction of B. aeneus population in the recent history. For example, before insecticide resistance became widespread in the 2000s16, pesticides might have limited the expansion of pollen beetle populations, and increased population genetic structuration47. Nevertheless, Kazachkova et al.7 did not found any effect
Version postprint
Accepted Article
of pesticides on B. aeneus population structure, which can be understood if reduction in population size due to insecticide uses was no greater than increase in population size because of larger availability of OSR resources.
MIGRAINE estimates of the current B. aeneus effective population size in France ranged between 2,370 and 1,357,500 individuals in France, which correspond to approximately 1.5 to 850 individuals per kha of OSR crop13. These genetic estimates of the pollen beetle density may seem high, but remain extremely low in comparison with the ecological density of pollen beetles reported in the literature, which are about 2.5 adult individuals per plant which corresponds to having more adults in an OSR field than the maximum genetic estimate of the population size for France48–50. Such discrepancies between genetic and ecological estimates of the pollen density may be induced by huge variances of reproductive success between pollen beetle individuals and drastic changes of pollen beetle densities between years and between OSR crop production regions. Genetic neighborhood sizes estimated based on isolation by distance patterns ranged between 50 to 100 individuals and were quite high in comparison with neighborhood sizes reported in insect taxa30. However, this number of individuals is still extremely small given the number of individuals per field and the known dispersal over several kilometers of the adults51.
5 Conclusion
The high variability observed in the 12 developed microsatellite loci indicates they are useful for measuring genetic patterns in B. aeneus populations. We confirmed the weak genetic structure of pollen beetle populations in Europe and the absence of genetic structure in France. Pollen beetle population were mainly structured by isolation by distance at the European continental scale. We also found the signature of an expansion of the B. aeneus population, which likely correspond to the OSR apparition in the middle age and the rapid expansion of the OSR cropping area in Europe since the Second World War. In any cases, given the unity of the population at the European scale and the important dispersal according to ecological studies, some gene flow likely occurs at the continental scale, implying that the managements of pollen beetle populations in OSR fields and evolution of insecticide resistances, including area-wide management of B. aeneus habitats, OSR in crop rotation, and insecticide interdictions, should be considered at the European continental scale. Finally, this case study shows how inferring current demographical characteristics based on molecular markers is challenging for insect pests because of their huge population sizes and demographic fluctuations in the recent past.
Version postprint
Accepted Article
Acknowledgments
We are grateful to the ‘Agence Nationale de la Recherche’ for it financial support to CB (LabEx BASC, ANR-11-LABX-0034), to RL (project GENOSPACE, ANR-16-CE02-0008) and to PF, CB, MVM, JO and AJ (project PEERLESS, ANR-12-AGRO-0006). AJ’s phD grant was supported by the PEERLESS project and the INRA meta-program SMaCH. We would like to thank the participating farmers for their interest in the project and European researchers (I. Ahman, R. Bomarco, M. Brandes, A. Gardarin, G. Grabenweger, U. Heimback, A. Pollier, N. Schuler, G. Seimandi-Corda, E. Veromann, and P. Wegorek) and Terre Inovia who sent us samples. Part of this work was carried out by using the resources of the INRA MIGALE (http://migale.jouy.inra.fr) and GENOTOUL (Toulouse, idi- yre e s bioinformatics HPC platforms, as well as the CBGP and the Montpellier Bioinformatics Biodiversity (MBB) HPC platform services.
References
1 Zimmer CT, Maiwald F, Schorn C, Bass C, Ott M-C, and Nauen R, A de novo
transcriptome of European pollen beetle populations and its analysis, with special reference to insecticide action and resistance: Next-generation sequencing of the pollen beetle, Insect Mol Biol 23:511–526 (2014).
2 Williams IH, ed., Biocontrol-Based Integrated Management of Oilseed Rape Pests, Springer Netherlands, Dordrecht (2010).
3 Gagic V, Riggi LG, Ekbom B, Malsher G, Rusch A, and Bommarco R, Interactive effects of pests increase seed yield, Ecol Evol 6:2149–2157 (2016).
4 Mauchline AL, Cook SM, Powell W, Chapman JW, and Osborne JL, Migratory flight behaviour of the pollen beetle Meligethes aeneus, Pest Manag Sci (2017).
5 Taimr L, Sedivy J, Bergmannova E, and Hanker I, Further experience obtained in studies on dispersal flights of Meligethes aeneus F., marked with P23 (coleoptera), Acta Entomol Bohemoslovic 64:325–332 (1967).
6 Ouvrard P, Hicks DM, Mouland M, Nicholls JA, Baldock KCR, Goddard MA, et al., Molecular taxonomic analysis of the plant associations of adult pollen beetles (Nitidulidae: Meligethinae), and the population structure of Brassicogethes aeneus, Genome 59:1101–1116 (2016).
7 Kazachkova N, Meijer J, and Ekbom B, Genetic diversity in pollen beetles (Meligethes
aeneus) in Sweden: role of spatial, temporal and insecticide resistance factors, Agric
For Entomol 9:259–269 (2007).
8 Kazachkova N, Meijer J, and Ekbom B, Genetic diversity in European pollen beetle,
Meligethes aeneus (Coleoptera: Nitidulidae), populations assessed using AFLP
Version postprint
Accepted Article
9 Wang IJ, Recognizing the temporal distinctions between landscape genetics and phylogeography, Mol Ecol 19:2605–2608 (2010).
10 Goldstein D and Schlotterer C, Microsatellites: evolution and applications, Oxf Univ Press Oxf (1999).
11 Storfer A, Murphy MA, Evans JS, Goldberg CS, Robinson S, Spear SF, et al., Putting the “landscape” in landscape genetics, Heredity 98:128–142 (2007).
12 Doré C, Histoire et amélioration de cinquante plantes cultivées, Institut national de la recherche agronomique, Paris (2006).
13 Desrier M, L’agriculture française depuis cinquante ans : des petites exploitations familiales aux droits à paiement unique., Agric Nouv Defis, 2007.
http://agreste.agriculture.gouv.fr/IMG/pdf/AGRIFRA07c-2.pdf.
14 Hokkanen HM, The making of a pest: recruitment of Meligethes aeneus onto oilseed Brassicas, Entomol Exp Appl 95:141–149 (2000).
15 Węgorek P, Mrówczyoski M, and Zamojska J, Resistance of pollen beetle (Meligethes
aeneus F.) to selected active substances of insecticides in Poland, J Plant Prot Res
49:119–128 (2009).
16 Hansen LM, Insecticide-resistant pollen beetles (Meligethes aeneus F) found in Danish oilseed rape (Brassica napus L) fields, Pest Manag Sci 59:1057–1059 (2003). 17 Heimbach U and Müller A, Incidence of pyrethroid-resistant oilseed rape pests in
Germany: Pyrethroid-resistant oilseed rape pests in Germany, Pest Manag Sci
69:209–216 (2013).
18 Audisio P, Coleoptera : Nitidulidae-Kateretidae, Calderini Bologna (1993). 19 Malausa T, Gilles A, MegléCz E, Blanquart H, Duthoy S, Costedoat C, et al.,
High-throughput microsatellite isolation through 454 GS-FLX Titanium pyrosequencing of enriched DNA libraries, Mol Ecol Resour 11:638–644 (2011).
20 Rozen S and Skaletsky H, Primer3 on the WWW for General Users and for Biological Programmers, Bioinforma Methods Protoc:365–386 (1999).
21 Schuelke M, An economic method for the fluorescent labeling of PCR fragments, Nat Biotechnol 18:233–234 (2000).
22 Rousset F, genepop’007: a complete re-implementation of the genepop software for Windows and Linux, Mol Ecol Resour 8:103–106 (2008).
23 Nei M, Estimation of average heterozygosity and genetic distance from a small number of individuals, Genetics 89:145–163 (1978).
24 Kalinowski ST, hp-rare 1.0: a computer program for performing rarefaction on measures of allelic richness, Mol Ecol Notes 5:187–189 (2005).
25 Pritchard JK, Stephens M, and Donnelly P, Inference of population structure using multilocus genotype data, Genetics 155:945–959 (2000).
26 Wang J, The computer program Structure for assigning individuals to populations: easy to use but easier to misuse, Mol Ecol Resour (2016).
27 Kopelman NM, Mayzel J, Jakobsson M, Rosenberg NA, and Mayrose I, CLUMPAK : a
program for identifying clustering modes and packaging population structure inferences across K, Mol Ecol Resour 15:1179–1191 (2015).
28 Evanno G, Regnaut S, and Goudet J, Detecting the number of clusters of individuals using the software structure: a simulation study, Mol Ecol 14:2611–2620 (2005). 29 Earl DA and vonHoldt BM, STRUCTURE HARVESTER: a website and program for
visualizing STRUCTURE output and implementing the Evanno method, Conserv Genet Resour 4:359–361 (2012).
Version postprint
Accepted Article
30 Rousset F, Genetic differentiation and estimation of gene flow from F-statistics under isolation by distance, Genetics 145:1219–1228 (1997).
31 Wright S, Isolation by distance under diverse systems of mating, Genetics 31:39–59 (1946).
32 Guillot G, Leblois R, Coulon A, and Frantz AC, Statistical methods in spatial genetics, Mol Ecol 18:4734–4756 (2009).
33 Cornuet JM and Luikart G, Description and power analysis of two tests for detecting recent population bottlenecks from allele frequency data, Genetics 144:2001–2014 (1996).
34 Leblois R, Pudlo P, Néron J, Bertaux F, Reddy Beeravolu C, Vitalis R, et al., Maximum-Likelihood Inference of Population Size Contractions from Microsatellite Data, Mol Biol Evol 31:2805–2823 (2014).
35 Brouat C, Mondor-Genson G, Audiot P, Sennedot F, Lesobre L, and Rasplus J-Y, Isolation and characterization of microsatellite loci in the ground beetle Carabus
nemoralis (Coleoptera, Carabidae), Mol Ecol Resour 2:119–120 (2002).
36 Marrec R, Ruault S, Ribout C, Plantegenest M, Gauffre B, and others, Isolation and characterization of eleven polymorphic microsatellite markers from the beneficial carabid beetle, Poecilus cupreus (Coleoptera: Carabidae), and genetic structuring among three populations from western France, Eur J Entomol 111:726–730 (2014). 37 Kim KS and Sappington TW, Polymorphic microsatellite loci from the western corn
rootworm (Insecta: Coleoptera: Chrysomelidae) and cross-amplification with other Diabrotica spp, Mol Ecol Notes 5:115–117 (2005).
38 Mason PG, Olfert O, Sluchinski L, Weiss RM, Boudreault C, Grossrieder M, et al., Actual and potential distribution of an invasive canola pest, Meligethes viridescens (Coleoptera: Nitidulidae), in Canada, Can Entomol 135:405–413 (2003).
39 Tereba A and Niemczyk M, Variability and Cross-Species Amplification of Microsatellite Loci in Melolontha melolontha and Melolontha hippocastani (Coleoptera, Scarabaeidae), Entomol News 127:192–197 (2017).
40 Audisio P, De Biase A, Romanelli P, Cristina Angelici M, Ketmaier V, and De Matthaeis E, Molecular re-examination of the taxonomy of the Meligethes viridescens species complex (Coleoptera: Nitidulidae), Biochem Syst Ecol 28:1–13 (2000).
41 Hartl DL, Clark A., and Clark A., Principles of population genetics, Sunderland Sinauer Assoc 116 (1997).
42 Frantz AC, Cellina S, Krier A, Schley L, and Burke T, Using spatial Bayesian methods to determine the genetic structure of a continuously distributed population: clusters or isolation by distance?, J Appl Ecol 46:493–505 (2009).
43 Franck P, Garnery L, Celebrano G, Solignac M, and Cornuet J-M, Hybrid origins of honeybees from Italy (Apis mellifera ligustica) and Sicily (A. m. sicula), Mol Ecol
9:907–921 (2000).
44 Dennis RLH, Williams WR, and Shreeve TG, A multivariate approach to the
determination of faunal structures among European butterfly species (Lepidoptera:
Rhopalocera), Zool J Linn Soc 101:1–49 (1991).
45 Bazin E, Population Size Does Not Influence Mitochondrial Genetic Diversity in Animals, Science 312:570–572 (2006).
46 Frankham R, Relationship of genetic variation to population size in wildlife, Conserv Biol 10:1500–1508 (1996).
Version postprint
Accepted Article
47 Giles B. and Goudet J, A case study of genetic structure in a plant metapopulation differentiation., Metapopulation Biology: Ecology, Genetics, and Evolution, Hanski I, Gilpin ME (1997).
48 Kaasik R, Kovács G, Mölder J, Treier K, Vaino L, and Veromann E, The impact of semi-natural habitats on the abundance of pollen beetle adults on winter oilseed rape fields, IOBC-WPRS Bull 104:85–89 (2014).
49 Rusch A, Valantin-Morison M, Sarthou JP, and Roger-Estrade J, Effect of crop management and landscape context on insect pest populations and crop damage, Agric Ecosyst Environ 166:118–125 (2013).
50 Schneider G, Krauss J, Riedinger V, Holzschuh A, and Steffan-Dewenter I, Biological pest control and yields depend on spatial and temporal crop cover dynamics, ed. by Manning P, J Appl Ecol 52:1283–1292 (2015).
51 Juhel A., Barbu C, Franck P, Valantin-Morison M, Roger-Estrade J, Butier A, et al., Characterization of the pollen beetle, Brassicogethes aeneus, dispersal from woodlands to winter oilseed rape fields, PLoS ONE.
Figure Legends
Fig. 1: Geographical positions of the 18 B. aeneus population samples. a) Population samples
from the Eure department. b) Population samples from France. c) Population samples from other countries in Europe. Details on the population locations are in Table 2.
Fig. 2: Summary of the results based on the STRUCTURE analysis for K = 2 and K = 3: plots
indicate proportional assignment of individuals (bars) to the colour-coded genetic clusters. The population of origin is indicated on the x-axis.
Fig. 3: Isolation by distance among European populations of Brassicogethes aeneus. Pairwise
comparison between the Eure population samples (Squares), between the French population samples (circles), between population samples from different countries (triangles), between populations including the Estonian population (diamonds). Solid line: all populations, FST /(1 − FST) = -0.0125+ 0.0029 * ln(km) (p < 0.001). Long dash line: all populations except the Estonian sample, FST /(1 − FST) = -0.0058 + 0.0014*ln(km )), (p < 0.01). Dashed line: French populations, (p > 0.05). Dotted line: Eure populations (p > 0.05).
Tables
Table 1: Characterization of the genetic variation at 21 polymorphic microsatellite loci based
on 24 Brassicogethes aeneus samples collected in an oil seed rape (Brassica napus) field at location 1. The name of each locus was underlined. Accession Number (Acc. No.), sequences
Version postprint
Accepted Article
of the forward (F) and reverse (R) primers, motif and number of repeat in the sequenced microsatellite allele, and size of the sequenced microsatellite allele were reported for each locus. Number of alleles (A), range of allele sizes, estimates of the proportion of null alleles, of observed (HO) and expected (HE) proportion of heterozygotes were reported for each locus in the B. aeneus population sample from location 1.
Locus
Acc. No. Primer sequences (5'-3') Repeat motif Size (bp) A Size range Null alleles HE HO Ma-CEALQ F: TTTCATTAAGCAACCTGTCG (TC)6 222 3 206-222 0.00 0.17 0.18 MF321854 R: GTGAGAGTAAGTTAAAGGCG Ma-D3QFM F: GGAGCACGTAGCAGGAC (AC)8 103 6 93-109 0.00 0.44 0.43 MF321855 R: GCTGCTGCGTAATTATAGTG Ma-DCH30 F: CGCAGATCTAAATTCGTGTG (AC)7 117 5 111-125 0.00 0.72 0.87 MF321862 R: GTATAGCGAAACAACAAGTGC Ma-DDEYS F: GTACACCGAGAGGCTTTGTC (CA)7 128 5 122-134 0.00 0.62 0.67 MF321863 R: GACTGTTCGGCTAGTTTTTATG Ma-EL7YR F: CAGGATGATTTCAGTGGAG (GGA)9 193 4 184-193 0.00 0.58 0.71 MF321871 R: CGGAAGAGTTGTTTTGTATG Ma-ESPVQ F: GTTAGGATATGAATGTTTCTGC (CA)8 134 9 130-160 0.00 0.79 0.86 MF321873 R: CATATGCGACATCGTTGG Ma-ESV1Z F: GTCAGTTGTTTGGCTTATTG (GAA)7 110 7 104-116 0.00 0.53 0.50 MF321874 R: CAGGAACTCGAACAAAGC Ma-EPL2N F: CCGACTTATCAGGTGTATGG (GGA)11 171 8 177-198 0.03 0.77 0.70 MF321872 R: CGTTCGACGTTGTGTTACC Ma-DQM5T F: GGGAGAGTGATGTACCTTTG (TG)9 153 5 143-153 0.07 0.65 0.52 MF321866 R: GGCAAGATAACTCAGATCC Ma-EB7XX F: CTTACTCGCTCGTCCTATATC (AC)7 238 8 218-232 0.08 0.85 0.70 MF321867 R: CACCTATCGTGCAGATCAC Ma-C4QRG F: AAGAGTATAAGTCGTCGAGC (CT)6 305 3 301-305 0.08 0.65 0.50 MF321857 R: AGTGGATGTAGAGAAATAGTGG Ma-DM3QY F: CATGTAAGCTATTTTGGGACG (AC)12 195 7 183-197 0.09 0.77 0.61 MF321865 R: CTATTTGCTTTGCTTGGATGC Ma-C6CAE F: CCTCTACGTCATGGTATGG (GT)7 126 4 121-129 0.23 0.49 0.17 MF321859 R: CCAAGATTAGGTCCACTCG Ma-EGYLO F: TCAAGTCTGACAACCAAAAG (GA)7 172 2 168-190 0.15 0.41 0.22 MF321868 R: GTTTCTGATTCGTTCTTGTC Ma-C5QWM F: TATTATGCTCCACCATTAGG (AC)8 257 4 250-256 0.22 0.67 0.31 MF321858 R: CCTTCAACTGTAATCAAAGC
Version postprint
Accepted Article
MF321860 R: GTGTACGTGTTATAAGGCTGTG Ma-DCGTK F: ATCGTAGCCATCTATTGAGC (CTT)12 162 9 159-180 0.17 0.62 0.36 MF321861 R: TGGACCTCTTGGTATATTGG Ma-EJCJJ F: CCGACAAGTGCATTACG (AG)8 176 5 154-170 0.21 0.70 0.35 MF321869 R: CAATAGACACCATCAATTAGG Ma-EL5EB F: CATAGTCTGTAAAGCATGTTG (TC)7 295 3 295-311 0.28 0.51 0.10 MF321870 R: CAAGAAACTTGACACTTAAATC Ma-C2D1M F: CCAAGAAAGGGAACAGG (AG)8 313 3 282-313 0.18 0.46 0.18 MF321856 R: CAGTAACCATAGCTCGACAC Ma-DJDOQ F: ACGTTTAATTAGTTGGTTGG (GA)13 119 3 153-163 0.24 0.43 0.11 MF321864 R: TATTGACGAGCTAATTTTGGVersion postprint
Accepted Article
Table 2: Mean genetic variability (± standard deviation) over 12 microsatellite loci in 18 B.
aeneus population samples. Latitude (Lat) and longitude (Long) of the location of the
population sample, number of individuals genotyped per population sample (N), allelic richness (Ar) computed for n=16, observed proportion of heterozygous genotypes (HO), observed gene diversity (HE) and expected gene diversity (Heq) at the mutation-drift equilibrium under the Two-Phase mutations (TPM). Significantly lower HE values than Heq under the SMM were underlined.
Site Location Latitude Longitude n Ar HO HE Heq (TPM) Heq (SMM) 1 Eure 1 48.864 1.243 25 5.40 (±1.75) 0.67 (± 0.21) 0.62 (±0.18) 0.65 (± 0.11) 0.72 (± 0.07) 2 Eure 2 48.923 1.213 22 5.06 (±1.59) 0.61 (±0.17) 0.60 (±0.20) 0.63 (± 0.10) 0.70 (± 0.08) 3 Eure 3 48.945 1.465 24 5.63 (±2.35) 0.63 (±0.16) 0.63 (±0.18) 0.66 (± 0.17) 0.71 (± 0.08) 4 Eure 4 48.973 1.421 23 5.43 (±1.83) 0.57 (±0.16) 0.58 (±0.22) 0.66 (± 0.11) 0.71 (± 0.07) 5 Eure 5 48.986 1.428 23 5.07 (±1.74) 0.62 (±0.16) 0.58 (±0.19) 0.64 (± 0.13) 0.69 (± 0.08) 6 Eure 6 48.972 1.448 24 5.23 (±1.78) 0.59 (±0.14) 0.54 (±0.17) 0.63 (± 0.15) 0.69 (± 0.08) Eure Total - - 138 5.30 (±1.66) 0.63 (±0.17) 0.63 (±0.17) 0.65 (± 0.11) 0.75 (± 0.09) 7 Eure&Loire 48.299 1.245 26 5.01 (±1.35) 0.61 (±0.15) 0.60 (±0.18) 0.64 (± 0.11) 0.69 (± 0.08) 8 Cher 47.217 2.199 16 5.50 (±2.43) 0.61 (±0.22) 0.63 (±0.23) 0.64 (± 0.17) 0.69 (± 0.09) 9 Aube 48.259 3.845 30 5.08 (±1.98) 0.58 (±0.21) 0.55 (±0.21) 0.62 (± 0.14) 0.69 (± 0.10) 10 Maine&Loire 47.664 -0.789 25 5.42 (±2.03) 0.63 (±0.17) 0.65 (±0.19) 0.64 (± 0.14) 0.70 (± 0.08) 11 Ile&Vilaine 48.112 -1.776 45 5.24 (±1.83) 0.63 (±0.18) 0.61 (±0.20) 0.64 (± 0.12) 0.72 (± 0.07) 12 Haute-Garonne 43.408 1.646 24 5.44 (±1.56) 0.63 (±0.19) 0.59 (±0.18) 0.67 (± 0.09) 0.73 (± 0.07) 13 Lot&Garonne 44.180 0.530 24 5.50 (±1.61) 0.63 (±0.20) 0.66 (±0.15) 0.67 (± 0.10) 0.73 (± 0.07) France Total - - 312 5.32 (±1.67) 0.63 (±0.21) 0.63 (±0.18) 0.68 (± 0.07) 0.78 (± 0.05) 14 Switzerland 47.431 8.519 28 5.97 (±2.19) 0.63 (±0.22) 0.64 (±0.20) 0.68 (± 0.16) 0.69 (± 0.11) 15 Austria 48.208 16.374 30 5.65 (±2.43) 0.63 (±0.23) 0.59 (±0.22) 0.65 (± 0.18) 0.69 (± 0.12) 16 Poland 52.187 18.809 24 5.22 (±1.93) 0.63 (±0.24) 0.60 (±0.18) 0.63 (± 0.14) 0.69 (± 0.13) 17 Sweden 55.658 13.083 21 5.18 (±1.53) 0.63 (±0.25) 0.57 (±0.17) 0.63 (± 0.15) 0.69 (± 0.14) 18 Estonia 58.343 26.527 24 4.43 (±1.54) 0.63 (±0.26) 0.59 (±0.22) 0.59 (± 0.15) 0.69 (± 0.15) Europe Total - - 433 5.38 (±1.79) 0.63 (±0.27) 0.63 (±0.18) 0.68 (± 0.08) 0.79 (± 0.06)
Version postprint
Accepted Article
Figures
Version postprint
Accepted Article
Version postprint
Accepted Article
Version postprint
Accepted Article
Supporting Information
Table S1: Polymorphic microsatellite loci selected in this study with reference to the labelled
dye of the forward primer and the molar concentration (C) of each locus each multiplex. 6-FAM (6-carboxyfluorescein), HEX (hexachloro-fluoresceine), TAMRA (carboxy-tetramethyl-rhodamine), ATTO 565 (Rhodamine dyesclass).
Locus ID Dye C (nM) Multiplex 1 Ma-D3QFM 6-FAM 0.07 µM Ma-ESPVQ Tamra 0.50 µM Ma-DM3QY Hex 0.20 µM Ma-C4QRG Hex 0.15 µM Ma-ESV1Z Atto-565 0.15 µM Ma-EPL2N Atto-565 0.30 µM Multiplex 2 Ma-DDEYS 6-FAM 0.05 µM Ma-DCH30 Tamra 0.25 µM Ma-EL7YR Tamra 0.50 µM Ma-DQM5T Hex 0.15 µM Ma-EB7XX Hex 0.10 µM Ma-CEALQ Atto-565 0.15 µM
Table S2: Characterization of genetic variation in eight Brassicogethes viridescens
individuals in twelve B. aeneus microsatellite. B viridescens individuals were collected in a seed rape field at site14. Sizes of the PCR products, number of alleles per locus and allele specific of B. viridescens but not B. aeneus were reported.
Locus Number of alleles Size range
Alleles only present in B.
viridescens Ma-C4QRG 2 313-315 313, 315 Ma-CEALQ 2 222-224 / Ma-EL7YR 1 175 / Ma-EB7XX / / / Ma-D3QFM 1 91 91 Ma-DCH30 / / / Ma-DDEYS 3 110-116 110, 112 Ma-DM3QY / / / Ma-DQM5T 5 151-161 155, 157 Ma-EPL2N 3 161-170 / Ma-ESPVQ 2 132-134 / Ma-ESV1Z 2 113-116 /
Version postprint
Accepted Article
Table S3: Summary of the STRUCTURE analysis performed on the full dataset for a range K
ranging between 1 and 20. The highest ΔK value and the two highest means LnP(K) are in bold font. The posterior probabilities of K=2 and K=3 are 0.001 and 0.999 respectively.
K Reps Mean LnP(K) Stdev LnP(K) Ln'(K) Ln''(K)| ΔK
1 10 -14021.40 0.00 — — — 2 10 -13995.95 13.66 25.45 18.33 1.34 3 10 -13988.83 9.82 7.12 101.91 10.38 4 10 -14083.62 39.55 -94.79 65.75 1.66 5 10 -14112.66 47.01 -29.04 41.65 0.89 6 10 -14183.35 61.23 -70.69 26.97 0.44 7 10 -14227.07 71.71 -43.72 50.82 0.71 8 10 -14321.61 74.66 -94.54 145.18 1.94 9 10 -14270.97 84.94 50.64 35.55 0.42 10 10 -14255.88 81.65 15.09 61.35 0.75 11 10 -14302.14 122.57 -46.26 56.69 0.46 12 10 -14291.71 96.92 10.43 6.42 0.07 13 10 -14274.86 88.99 16.85 67.53 0.76 14 10 -14325.54 135.01 -50.68 81.85 0.61 15 10 -14294.37 143.59 31.17 1.07 0.01 16 10 -14264.27 87.80 30.10 95.09 1.08 17 10 -14329.26 156.77 -64.99 110.42 0.70 18 10 -14283.83 95.97 45.43 36.06 0.38 19 10 -14274.46 85.56 9.37 40.50 0.47 20 10 -14224.59 119.09 49.87 — —
Version postprint
Accepted Article
Table S4. Pairwise FST estimates (left part) and significant FST values (right part) between 18 population samples of Brassicogethes aeneus (for
details on locations and code see Table 2). Bold character indicate significant FST values.
1 2 3 4 5 6 7 8 9 10 11 12 13 14 15 16 17 18 1 / NS NS NS NS NS NS NS NS NS NS NS NS NS * *** NS *** 2 0.0077 / NS NS NS NS NS NS NS NS NS NS NS NS NS NS NS *** 3 0.0030 0.0010 / NS NS NS NS NS NS NS NS NS NS NS NS * NS *** 4 0.0099 0.0164 0.0037 / NS NS NS NS NS NS NS NS NS NS NS *** * *** 5 -0.0016 -0.0033 -0.0031 0.0107 / NS NS NS NS NS NS NS NS NS * NS NS *** 6 -0.0044 0.0031 -0.0033 0.0100 -0.0054 / NS NS NS NS NS NS NS NS * NS * *** 7 -0.0029 -0.0035 -0.0035 0.0067 -0.0094 -0.0053 / NS NS NS NS NS NS NS NS *** NS *** 8 0.0070 -0.0026 0.0066 0.0154 -0.0044 0.0042 0.0008 / NS NS NS NS NS NS NS *** NS *** 9 -0.0039 0.0017 0.0017 0.0140 -0.0055 0.0016 0.0008 0.0002 / NS NS NS NS NS NS * NS *** 10 -0.0014 0.0001 0.0003 0.0093 -0.0081 -0.0071 -0.0049 0.0037 -0.0067 / NS NS NS NS NS NS NS *** 11 -0.0016 -0.0002 -0.0011 0.0057 -0.0044 0.0014 -0.0044 0.0023 -0.0045 -0.0049 / NS NS NS NS NS NS *** 12 0.0024 0.0095 0.0013 0.0001 -0.0073 0.0026 -0.0013 0.0134 0.0005 -0.0027 -0.0061 / NS NS NS NS NS *** 13 -0.0005 0.0045 0.0044 0.0140 -0.0042 0.0004 -0.0050 0.0088 -0.0033 -0.0010 0.0022 0.0058 / NS NS * NS *** 14 0.0051 0.0051 0.0042 0.0026 0.0036 0.0050 0.0029 0.0051 0.0051 -0.0020 0.0034 -0.0036 0.0087 / NS *** NS *** 15 0.0134 0.0072 0.0067 0.0113 0.0085 0.0070 0.0110 0.0077 0.0082 0.0012 0.0046 0.0021 0.0161 -0.0051 / NS * *** 16 0.0099 0.0057 0.0018 0.0104 -0.0052 0.0016 0.0028 0.0091 0.0035 -0.0057 -0.0033 -0.0049 0.0041 0.0014 0.0039 / NS *** 17 -0.0018 0.0066 0.0028 0.0118 -0.0061 0.0046 -0.0004 0.0062 -0.0032 -0.0034 -0.0051 0.0037 -0.0020 -0.0005 0.0146 -0.0014 / *** 18 0.0277 0.0230 0.0267 0.0418 0.0212 0.0254 0.0305 0.0313 0.0214 0.0194 0.0087 0.0280 0.0331 0.0281 0.0285 0.0077 0.0110 /