HAL Id: hal-01025179
https://hal.univ-brest.fr/hal-01025179
Submitted on 17 Jul 2014
HAL is a multi-disciplinary open access
archive for the deposit and dissemination of
sci-entific research documents, whether they are
pub-lished or not. The documents may come from
teaching and research institutions in France or
abroad, or from public or private research centers.
L’archive ouverte pluridisciplinaire HAL, est
destinée au dépôt et à la diffusion de documents
scientifiques de niveau recherche, publiés ou non,
émanant des établissements d’enseignement et de
recherche français ou étrangers, des laboratoires
publics ou privés.
cobalt distribution in the deep western Atlantic Ocean
Gabriel Dulaquais, Marie Boye, M.J.A Rijkenberg, Xavier J. Carton
To cite this version:
Gabriel Dulaquais, Marie Boye, M.J.A Rijkenberg, Xavier J. Carton. Physical and remineralization
processes govern the cobalt distribution in the deep western Atlantic Ocean. Biogeosciences, European
Geosciences Union, 2014, 11 (6), pp.1561-1580. �10.5194/bg-11-1561-2014�. �hal-01025179�
www.biogeosciences.net/11/1561/2014/ doi:10.5194/bg-11-1561-2014
© Author(s) 2014. CC Attribution 3.0 License.
Biogeosciences
Physical and remineralization processes govern the cobalt
distribution in the deep western Atlantic Ocean
G. Dulaquais1, M. Boye1, M. J. A. Rijkenberg2,3, and X. Carton4
1Laboratoire des Sciences de l’Environnement Marin UMR6539, Institut Universitaire Européen de la Mer UMS3113, Technopôle Brest Iroise, Place Nicolas Copernic, 29280 Plouzané, France
2Department of Marine Biology, University of Groningen, P.O. Box 14, 9750 AA Haren, the Netherlands 3Department of Marine Chemistry and Geology, Royal Netherlands Institute for Sea Research, P.O. Box 59, 1790 AB Den Burg, the Netherlands
4Laboratoire de Physique des Océans, Université de Bretagne Occidentale – UFR Sciences, 6 avenue Le Gorgeu, C.S. 93837, 29238 Brest Cedex 3, France
Correspondence to: G. Dulaquais ([email protected])
Received: 6 September 2013 – Published in Biogeosciences Discuss.: 16 October 2013 Revised: 23 January 2014 – Accepted: 28 January 2014 – Published: 24 March 2014
Abstract. The distributions of the bio-essential trace
ele-ment dissolved cobalt (DCo) and the apparent particulate Co (P Co) are presented along the GEOTRACES-A02 deep section from 64◦N to 50◦S in the western Atlantic Ocean (longest section of international GEOTRACES marine en-vironment program). P Co was determined as the difference between total cobalt (T Co, unfiltered samples) and DCo.
DCo concentrations ranged from 14.7 pM to 94.3 pM, and P Co concentrations from undetectable values to 18.8 pM.
The lowest DCo concentrations were observed in the sub-tropical domains, and the highest in the low-oxygenated At-lantic Central Waters (ACW), which appears to be the ma-jor reservoir of DCo in the western Atlantic. In the Antarc-tic Bottom Waters, the enrichment in DCo with aging of the water mass can be related to suspension and redissolution of bottom sediments a well as diffusion of DCo from abyssal sediments. Mixing and dilution of deep water masses, rather than scavenging of DCo onto settling particles, generated the meridional decrease of DCo along the southward large-scale circulation in the deep western Atlantic. Furthermore, the ap-parent scavenged profile of DCo observed in the deep waters likely resulted from the persistence of relatively high concen-trations in intermediate waters and low DCo concenconcen-trations in underlaying bottom waters. We suggest that the 2010 Ice-landic volcanic eruption could have been a source of DCo that could have been transported into the core of the North-east Atlantic Deep Waters. At intermediate depths, the high
concentrations of DCo recorded in the ACW linearly cor-related with the apparent utilization of oxygen (AOU), in-dicating that remineralization of DCo could be significant (representing up to 37 % of the DCo present). Furthermore, the preferential remineralization of phosphate (P) compared to Co in these low-oxygenated waters suggests a decoupling between the deep cycles of P and Co. The vertical diffusion of DCo from the ACW appears to be a significant source of
DCo into the surface waters of the equatorial domain.
Sum-marizing, the dilution due to mixing processes rather than scavenging of DCo and the above-mentioned remineraliza-tion could be the two major pathways controlling the cycling of DCo into the intermediate and deep western Atlantic.
1 Introduction
In the context of the international GEOTRACES program, unprecedent efforts are underway to map the distribution of trace elements and isotopes in the global oceans. Cobalt (Co) is among the important micronutrients highlighted in this program. Dissolved cobalt (DCo) typically occurs at concen-trations lower than 150 pM in the open ocean (Knauer et al., 1982; Martin et al., 1990; Fitzwater et al., 2000; Saito and Moffett, 2001; Saito et al., 2004; Ellwood, 2008; Noble et al., 2008; Pohl et al., 2011; Bown et al., 2011), requiring sensi-tive analytical techniques for its detection (Vega and van den
Berg, 1997; Cannizzaro et al., 2000; Saito and Moffett, 2001; Milne et al., 2010; Shelley et al., 2010). Previous studies have suggested that DCo could be an hybrid-type metal (Bruland and Lohan, 2003; Noble et al., 2008), with a nutrient-like distribution in surface waters (Martin et al., 1993; Saito and Moffett, 2002; Saito et al., 2004; Jakuba et al., 2008; Noble et al., 2008; Saito and Goepfert, 2008; Bown et al., 2011) and a scavenged-type distribution in the deep ocean (Knauer et al., 1982; Wong et al., 1995; Noble et al., 2008; Boyd and Elwood, 2010). Biological uptake by cyanobacteria (Saito et al., 2002), recycling, organic complexation, scavenging and regeneration processes are suspected to strongly impact the distribution of DCo in the surface ocean (Saito and Mof-fett, 2001, 2002; Noble et al., 2008, 2012; Bown et al., 2011, 2012a). In addition, other important sources of DCo to sur-face waters, such as river (Tovar-Sanchez et al., 2011) or at-mospheric deposition (Shelley et al., 2012), may significantly impact its surface distribution.
In the water column, cobalt and manganese (Mn) often cycle together through a removal pathway of co-oxidation with manganese driven by microbes, but the biological as-similation of DCo can uncouple the Mn–Co relationship in surface waters (Moffett and Ho, 1996). Furthermore, pre-vious studies showed high DCo concentrations in oxygen-depleted waters (Saito et al., 2004; Pohl et al., 2011; No-ble et al., 2012) that can be partly related to slowed micro-bial oxidation of DCo decreasing its scavenging rate (Noble et al., 2012). On the other hand, the low solubility of inor-ganic Co in oxygenated waters and the affinity of DCo for particles have been invoked to explain why DCo does not seem to accumulate in the deep waters along the thermo-haline circulation (Bruland and Lohan, 2003) and to inter-pret the apparent scavenged-type profile of DCo observed in the deep ocean (Aparicio-Gonzalez et al., 2012). In fact, the scavenging of DCo onto settling particles and its stabiliza-tion in solustabiliza-tion by the complexastabiliza-tion with organic binding ligands could be the two major pathways controlling the in-ternal cycling of DCo in the deep ocean (Saito and Moffett, 2001, 2002). Those pathways might drive the residence time of DCo in the deep waters, estimated 40–120 years, which is more than two orders of magnitude longer than in surface wa-ters (e.g., 0.32 year; Saito and Moffett, 2002). Hydrothermal vents (Bruland and Lohan, 2003) and sediment resuspension (Bown et al., 2012a) can be the prevailing external sources of DCo to the bottom ocean. In addition, advection of water masses enriched in DCo, following contact with continen-tal margins, can be a significant source of DCo and locally imprints the vertical DCo distribution in intermediate and deep waters (Wong et al., 1995; Saito et al., 2004; Noble et al., 2008; Bown et al., 2011, 2012b). Furthermore, large and mesoscale transport of DCo-enriched waters through the in-termediate oceanic circulation has recently been evidenced in the poor-oxygenated Atlantic Central Waters (Noble et al., 2012) and Upper Circumpolar Deep Waters (Bown et al., 2011), as well as close to the Kerguelen Plateau (Bown et al.,
2012b). Nevertheless, despite these major findings our under-standing of the biogeochemical cycle of cobalt in the ocean is still limited, notably in the western Atlantic Ocean where observations of the deep distribution of DCo are scarce.
In this study the vertical and meridional distributions of
DCo and apparent particulate cobalt (P Co) are presented
along the GEOTRACES-A02 section in the western Atlantic Ocean from the east coast of the Greenland Plateau (64◦N) to the Malvinas Plateau (50◦S). The GEOTRACES-A02 transect is revisiting the Atlantic GEOSECS (Geochemical Ocean Sections) program’s section of 1972, crossing distinct biogeochemical areas such as subtropical, equatorial or sub-polar domains where different trophic chains are growing in each. Moreover, this section also encounters several water masses involved in the thermohaline circulation and surface jets, such as the North Atlantic Drift, known for its important role in climate regulation. The spatial distributions of DCo and its transportation across the entire deep western Atlantic Ocean are examined. Intercomparison between this data set and others, at three crossover stations located in different bio-geochemical domains, are presented. The advection of DCo in the different intermediate and deep water masses flowing in the western Atlantic are studied to further understand its spatial distributions. In addition, the potential effect of the 2010 Icelandic volcano Eyjafjallajökull eruption on the dis-tribution of DCo is investigated. We also investigate the role of the remineralization in the distribution of DCo at inter-mediate depths, and its relationship with phosphate. Finally, the roles of the dynamic structures and the vertical diffusion are considered as they may provide a link between the deep and surface distributions of DCo. However, the complete de-scription of the cycling and budget of DCo in the surface wa-ters along the GEOTRACES-A02 section will be discussed elsewhere (Dulaquais et al., 2014). This large and deep sec-tion together with the relatively high spatial resolusec-tion has given us the opportunity to present, for the first time, the largest comprehensive data set of cobalt in the western At-lantic Ocean.
2 Methods
2.1 Cruise track and sampling
The samples were collected from stations (St.) along the GEOTRACES-A02 section in the western Atlantic Ocean, the longest section of the international GEOTRACES pro-gram. Four expeditions conducted between 2010 and 2012 were necessary to complete this section spreading from 64◦N to 50◦S along the western Atlantic Ocean (Fig. 1). Three cruises were operated aboard the Dutch R/V Pelagia (legs 1, 2, 4) and one cruise aboard the British RRS James
Cook (leg 3). The first cruise started in April 2010 from 64◦N to Bermuda in the Sargasso Sea (St. 1–19), followed by the second leg from the station BATS to the Equator (St. 21–41).
SAW
Fig. 1. GEOTRACES-A02 cruises track along the western Atlantic
Ocean. Sampling locations of the four legs are shown (leg 1 in red line from station 2 to station 19, leg 2 in green line from station 21 to station 41, leg 3 in blue line from station 1b to 18b and leg 4 in purple line from station 3c to 7c).
The section in the southwestern Atlantic (leg 3) from 50◦S to the Equator was achieved in March 2011 (St. 1b–18b). An additional cruise (leg 4) was operated in August 2012 to complete the first leg that had been fragmented due to bad weather (St. 3c–7c).
A total of 47 stations with a vertical resolution of 12– 16 depths between 9 m and 5930 m were sampled for dis-solved cobalt analyses (DCo), and 15 stations for total (un-filtered) cobalt determinations (T Co). The apparent partic-ulate cobalt concentrations (P Co) were calcpartic-ulated by sub-straction of DCo from T Co. The complete data set of cobalt (dissolved, total, and apparent particulate) at all stations will be available at the international GEOTRACES data center (http://www.bodc.ac.uk/geotraces/).
Samples were taken using the TITAN-CTD frame of NIOZ (Netherlands), with 24 ultra-clean 24.4 L sampling bottles made of PVDF (polyvinylidene fluoride) plastic (de Baar et al., 2008). The frame was placed in a Class-100 container for sub-sampling (de Baar et al., 2008). Unfil-tered samples were transferred into acid-cleaned 250 mL Nalgene™ LDPE (low-density polyethylene) bottles for
T Co analyses. The samples for DCo analyses were collected
after filtration using 0.2 µm Sartobran™ 300 (Sartorius) car-tridges under pure N2pressure (filtered 99.99 % N2, 0.7 atm) in acid-cleaned 250 mL or 500 mL Nalgene™ LDPE bottles. All samples were acidified at pH ∼ 2 using ultrapure HCl™ (Merck) immediately after their collection. Then the acidi-fied samples were dark-stored in double bags at ambient tem-perature in preparation of their analyses in the shore-based laboratory.
2.2 Analytical method for cobalt analyses
2.2.1 Method
Prior to the analyses, the samples were UV-digested (Saito and Moffet, 2002; Shelley et al., 2010) for 3 h in acid-cleaned silica tubes using a 600 W high-pressure mercury vapor lamp (Bown et al., 2011), and left for an equilibration time of 48 h. Preliminary tests indicated that 3 h of UV-digestion were re-quired to fully recover Co in surface and deep samples (data not shown).
Dissolved and total cobalt concentrations were determined by flow-injection analysis (FIA) and chemiluminescence detection following the method adapted from Shelley et al. (2010), as described in Bown et al. (2011). In this method, cobalt catalyzes the oxidation reaction of pyrogallol with hy-drogen peroxide in an alkaline solution in the presence of cetyltrimethylammonium bromide (CTAB) and methanol. A chemiluminescent emission in the visible wavelengths pro-portional to the cobalt concentration is produced during this reaction. The system consists of one 10-port injection valve (VICI valves from VALCO instruments), which operates as an autosampler, and of two micro-electronically actuated in-jection valves (VICI valves from VALCO instruments) that use Tygon® tubes to inject the sample and the reagents. The flow injection is provided by a peristaltic pump (205 CA, Watson Marlow).
The reagents were prepared with trace metals quality reagents, as described in Bown et al. (2011). All reagents were prepared under a laminar flow hood (ADS Laminaire, ISO 5 class) in 1 L LDPE Nalgene® bottles with ultrapure water (MiliQ, 18.2 M) the day before the analysis and kept at room temperature for an overnight equilibration.
The sample was buffered online with ammonium acetate (0.3 M, ACS Reagents) and loaded onto an IDA-Toyopearl chelating resin to preconcentrate the cobalt contained in the sample. Then a HCl solution (0.1 M, Suprapur® Merck) was injected through the column to elute Co. The eluent was warmed in a 60◦C thermostatic bath to limit the interferences in the detection system due to bubbles (Shelley et al., 2010). The detection system consisted of a photomultiplier detec-tor (Hamamatsu, H9319 series). The injection valves and the photomultiplier detector were operated on a laptop by a mod-ified Labview® 8.4 interface (E. Duvieilbourg and M. Boye,
LEMAR). The electrical devices were connected to a modu-lator of current (ELLIPSEMAX 600, MGE/UPS Systems).
The Co concentrations were calibrated against two cali-bration curves made with standard additions of cobalt of 0, 12.5, 25, 50, 75 and 100 pM to seawater, and performed be-fore and after each series of 8 or 12 samples. T Co and DCo concentrations were based on triplicate analyses of each sam-ple using the mean peak height of the chemiluminescent sig-nal, and corrected with respect to blank analyses. Two to four reagent blanks, including the buffer blank, were analyzed per series of 8–12 samples at the beginning and at the end of the series in acidified MilliQ water instead of the sample (Bowie and Lohan, 2009; Bown et al., 2011).
The final standard deviation of the measurement was cal-culated by an error propagation using the error on blanks, the calibration curves and the deviation of the triplicate analy-ses. The paired two-tailed t test shows that the differences between T Co and DCo (e.g., equivalent to apparent par-ticulate Co) are statistically significant at the 95 % confi-dent interval (P < 0.05, tcritical=2.84, texperimental=12.83,
n = 203), allowing reliable estimation of P Co
concentra-tion. The standard error on P Co was calculated by com-bining uncertainties of DCo and T Co measurements (e.g., SDP Co=(SD2DCo+SD2T Co)0.5).
2.2.2 Analytical performance
The mean reagent blank (based on all blank determinations) was 4.2 ± 2.1 pM (n = 180) of Co in MilliQ (n = 180). The limit of detection of the method estimated as three times the standard deviation of the mean reagent blank was 6.3 pM (n = 180). Each series of samples was calibrated by running one or two samples collected during the “Sampling and Analysis of iron” (SAFe) program or GEOTRACES pro-gram. SAFe and GEOTRACES samples were UV-digested for 3 h prior to analysis and the results of DCo concen-trations are reported in Table 1. The DCo concenconcen-trations we measured in the SAFe and GEOTRACES reference-samples are in excellent agreement with the consensus values (http://www.geotraces.org/science/intercalibration/ 322-standards-and-reference-materials). The DCo value ob-tained in the S-SAFe sample also falls in the consensus value despite the concentration being lower than the detection limit. The analytical precision of the method was determined from repeated analyses of the surface S-GEOTRACES ref-erence sample, yielding an uncertainty of ±3.8 % expressed as relative standard deviation on the mean (n = 15).
2.3 Hydrography
Hydrological parameters (S, T◦, O2, conductivity, fluores-cence and turbidity) were measured using an SBE9+ un-derwater sensor, an SBE3+ thermometer (±0.001◦C), an SBE4 conductivity sensor (±0.3 mS s−1), an SBE43
dis-solved oxygen sensor (±2 %), a Chelsea Aquatracka MKIII
Table 1. Comparison of dissolved cobalt analyses obtained in the
UV-oxidized samples by the FIA-chemiluminescence method used in the present study with consensus values reported by the Sampling and Analysis of iron (SAFe) and GEOTRACES programs. Water samples provided by SAFe and GEOTRACES from surface waters (SAFe S and GEOTRACES S) and deep waters (SAFe D1 and D2, and GEOTRACES D) were analyzed. Errors are given as standard deviation from average values.
Sample DCo measured (pM) Consensus
value (pM) SAFe S 5.1 ± 2.2 (n = 25) 4.8 ± 1.20 SAFe D1 42.3 ± 1.4 (n = 15) 45.4 ± 4.7 SAFe D2 44.2 ± 1.7 (n = 25) 45.7 ± 2.9 GEOTRACES S 29.8 ± 2 (n = 35) 31.8 ± 1.1 GEOTRACES D 63.2 ± 2.3 (n = 25) 65.2 ± 1.2
fluorometer (±0.2 µg l−1), and a Wetlabs C-Star
transmis-someter (±0.02 %◦C−1; 25 cm, deep, red).
2.4 Macronutrients analysis
Nutrient samples were collected in 125 mL polypropy-lene bottles using a CTD-rosette (Seabird®) equipped with Niskin bottles. The analyses were performed on board from surface to deep waters samples. All the nutrients were an-alyzed by colorimetric methods, following the methods of Murphyand Riley (1962) for phosphate (HPO2−4 ), of
Strick-land and Parsons (1968) for silicate (Si(OH)−4), and of
Grasshoff et al. (1983) for nitrate (NO−3) and nitrite (NO2).
3 Results
3.1 Circulation and dynamic structures
In the North Atlantic, the section crosses the subarctic gyre (SAG) between 64◦N and 50◦N, where the Labrador Sea Water (LSW) dives to form with the Arctic Bottom Water, the Western North Atlantic Deep Water (WNADW). Deeper, the Eastern North Atlantic Deep Water (ENADW) is also iso-lated in the SAG and forms, further south, with the WNADW the North Atlantic Deep Water (NADW) (Fig. 2). The well-oxygenated and dense waters of the subarctic gyre are sep-arated, in the south, from relatively low-oxygenated, saline and warm waters of the North Atlantic subtropical gyre (NASG) by the North Atlantic subtropical front (NSTF) at
∼45◦N. The NSTF is characterized by a high anomaly of temperature (+ 5◦C) and by a strong eastward geostrophic current in surface waters (data not shown) which is likely to be the North Atlantic Drift (Reid, 1994).
In the NASG, low-density waters occur in the top 600 m due to relatively high salinity and temperature (T◦> 10◦C;
S > 35) (Fig. 2). However, at 15◦N and, to a lesser extent, at 4◦N these saline waters are covered by relatively fresh
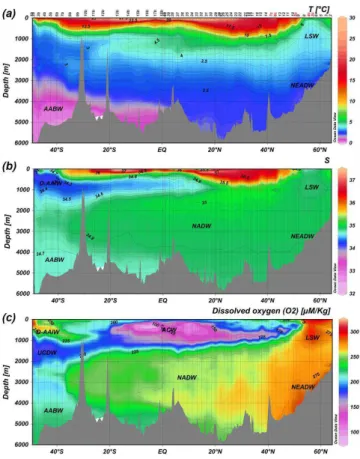
Fig. 2. Interpolated vertical sections of (a) temperature (T ), (b) salinity (S) and (c) dissolved oxygen (O2) along the GEOTRACES-A02 section in the western Atlantic, based on CTD data. The different water masses – LSW, NEADW, NADW, ACW, AABW, D-AAIW and UCDW – are identified by their physical fea-tures and are indicated in the figure panels. Stations sampled during leg 4 are labeled in red.
waters (Fig. 2) originating from the Amazon plume. The wa-ters influenced by the Amazon plume are characterized by a relatively high Si : N ratio and turbidity (data not shown).
Leaving the NASG southwards, the section enters into the equatorial area (EA). Here, the zonal geostrophic veloc-ities indicate the presence of several jets near the surface, such as the North Equatorial Current (NEC, at 5–10◦N), the North Equatorial Countercurrent (NECC, at ∼ 3◦N), the South Equatorial Current (SEC, at 5–10◦S) and the South Equatorial Undercurrent (SEUC, at ∼ 5◦S, 200 m depth), as described by Peterson and Stramma (1991). The equato-rial domain is bordered by the NEC in the north and by the SEC in the south, both of which are characterized by west-ward surface geostrophic propagating vectors of correlating speeds (respectively 0.2 and 0.15 m s−1). Below 100 m, the
salinities and temperatures are lower than in the NASG, re-vealing denser waters. An oxygen minimum zone (OMZ; O2< 150 µM) was also observed under these surface cur-rents, between 150 and 600 m (Fig. 2c). Part of this low O2 signature was due to the advection of the poor-oxygenated
Atlantic Central Waters (O2< 50 µM; Noble et al., 2012), flowing westward from the African border across the Atlantic basin.
Southward, the section enters into the South Atlantic sub-tropical gyre (SASG) characterized, like in the North At-lantic, by low-density waters associated with relatively high salinities and temperatures (Fig. 2a and b). Despite strong eddy activity in this area, clearly observed in the geostrophic current field, the Malvinas–Brazil confluence (MBC), an eastward jet resulting from the Brazil current flowing south-ward and the Malvinas current flowing northsouth-ward, can be lo-cated in the Argentine basin around 40◦S (e.g., at station 6b; data not shown). The MBC separates the SASG with saline and relative oxygen-poor waters from the subantarctic waters (SAW).
Several water masses involved in the large-scale ocean circulation were characterized by depth (Fig. 2). For in-stance, the LSW was characterized by 34.9 < S > 34.8 and O2> 275 µmol kg−1in the subarctic gyre at 60◦N (Fig. 2). The ENADW (S > 34.925) circulates underneath the LSW, following the topography below 2500 m in the northern side of the section. The core of the ENADW is situated between 62◦N and 45◦N. The WNADW and the ENADW both form the NADW, spreading southward into the deep ocean from 60◦N to 37◦S (Tomczak and Godfrey, 2003). The Antarc-tic Bottom Water (AABW), characterized by S < 34.8 and
T◦ < 1◦C, is formed in the Weddell Sea (Reid, 1989; Glady-shev et al., 2008) and spreads at the bottom of the ocean be-low 4000 m. The AABW enters the Atlantic Ocean by the south and follows the topography until 3◦N. To the north the bottom waters are a mix between AABW, Arctic Bottom Waters (ABW) and NADW (Tomczak and Godfrey, 2003). In the Southern Hemisphere, the relatively fresh Antarc-tic Intermediate Waters entering from the Drake Passage (D-AAIW; S > 34.2) are identified at intermediate depths between 500 and 1000 m. Finally, the oxygen distribution enables us to distinguish the different components of the Circumpolar Deep Waters (CDW; Whitworth and Nowlin, 1987), with its upper component (UCDW) at about 1500 m, marked by O2< 190 µmol kg−1, and its intermediate com-ponent (ICDW) at about 2500 m with O2> 210 µmol kg−1 (Fig. 2c). The intermediate waters in the equatorial do-main are formed by a mix of AAIW and UCDW that both flow northward and of the Atlantic Central Waters (ACW) originated from the east Atlantic basin (Poole and Tom-czak, 1999). However, it has to be noted that the transitions between the different water masses vary with the latitude (Fig. 2).
3.2 The nutrients distribution along the GEOTRACES-A02 section
Different biogeochemical domains were characterized in sur-face waters along the GEOTRACES-A02 section (Fig. 3). The surface waters of the SAG were marked by relatively
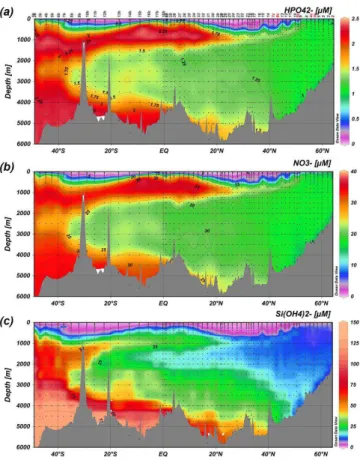
Fig. 3. Interpolated vertical sections of (a) phosphate, (b) nitrate
and (c) silicate based on 1440 analysis of water-column samples collected and measured by NIOZ along the Netherlands area of GEOTRACES-A02 section. Stations sampled during leg 4 are la-beled in red.
high phosphate and nitrate concentrations (NO3> 10 µM; PO4> 0.8 µM; Fig. 3). In the two subtropical domains, the extremely low nutrients concentrations (such as observed in the NASG where PO4< 0.5 µM, NO3< 5 µM, Si < 5 µM) were characteristic of oligotrophic conditions. However, a greater depletion of nitrogen relative to phosphate was ob-served in the upper 300 m of the SASG (N : P < 10) com-pared to the NASG (N : P > 25), probably due to a greater proportion of N2fixers, such as diazotrophic cyanobacteria, in the NASG than in the SASG (Mather et al., 2008). In the equatorial area, the intermediate waters were character-ized by relatively high concentrations of nitrate and phos-phate (NO3> 34 µM, PO4> 2.3 µM), whereas silicate con-centrations were low (5 µM < Si < 15 µM), suggesting the in-cursion of D-AAIW formed in the southwestern Atlantic. South of the south subtropical front, the nutrients distribu-tion showed, as for oxygen, the influence of the AAIW and UCDW with relatively high nutrients concentration in the top 200 m depths (NO3> 20 µM, PO4> 1.2 µM). In the deep ocean the nutrients distribution reflected a combination of aging and advection of water masses (Fig. 3). The spread-ing of young NADW can be followed with the low-nutrients
signature (Si < 35 µM; NO3< 20 µM; PO4< 1.5 µM). Phos-phate and nitrate concentrations increased southward in the deep ocean (Fig. 3) due to mixing of Arctic waters (poor in nutrients) with nutrients-enriched Antarctic waters. The AABW was characterized by relatively high nutrients concentration (Si > 130 µM; NO3> 30 µM; PO4> 2 µM), which decreased northward. The nutrients concentration in the Circumpolar Deep Waters was similar to those of AABW, but the concentrations in the ICDW were a little bit lower than those in the UCDW. The silicate levels are depleted in the AAIW compared to other Antarctic waters.
3.3 The comprehensive distribution of cobalt in the western Atlantic
The meridional and vertical distributions of DCo along the GEOTRACES-A02 section are presented in Fig. 4a. Dis-solved cobalt concentrations range from 14.72 ± 1.43 to 93.27 ± 3.31 pM along the section. The lowest concentra-tion was observed in surface waters of the SASG (e.g., at 9 m depth at St. 11b – 26◦S), whereas the highest were recorded in the OMZ of the equatorial area (e.g., at St. 15b – 9◦S at 290 m depth). The vertical distributions of the apparent particulate cobalt concentrations (P Co) are pre-sented in Fig. 4b. The apparent particulate cobalt concen-trations ranged from near undetectable values (e.g., the dif-ference between unfiltered and filtered samples analyses is nearly null) to 18.85 ± 3.97 pM (e.g., at St. 17 – 34.3◦N at 5510 m depth). The P Co/DCo ratio ranged from 0.06 % (St. 17; 2500 m) to 44 % (St. 26, 25 m), with a mean of 7 % (n = 192).
Different vertical distributions of DCo were observed in each biogeochemical domain (Figs. 4 and 5). The distri-bution of DCo showed an apparent scavenged-like profile in the northern subarctic gyre (Figs. 4a–5a), with relatively higher concentrations in surface waters (DCoupper 200 m > 70 pM) compared to deeper waters (DCobelow 2000 m< 60 pM). In this domain, lower surface DCo concentrations were recorded in 2012 during leg 4 (e.g., 42.1 ± 2.15 pM at St. 3c, and 44.23 ± 1.26 pM at St. 4c, at 25 m depth) com-pared to those observed in 2010 during leg 1 (e.g., mean
DCo = 64.56 ± 5.25 pM at 25 m (n = 4), with a DCo
max-imum of 68.2 ± 1.08 pM at St. 5). At intermediate depths (500–1000 m), the LSW was characterized by relatively high DCo concentrations (DCo ∼ 70 pM) compared to those found in the ENADW (DCo ∼ 55 pM below 2000 m). In this domain, the apparent particulate cobalt distribution showed relative P Co maxima in the subsurface (ranging from 5.9 ± 1 to 10.4 ± 1.96 pM), and decreasing concentra-tions with depth (until undetectable levels around 1500 m depth). Maxima of P Co (> 10 pM) were then observed near the bottom (at St. 2 and 11).
In contrast, DCo was depleted in the surface waters of the two subtropical domains and increased with depth below the nutricline, featuring a nutrient-like distribution
Fig. 4. Interpolated vertical sections of (a) dissolved cobalt (DCo, pM) and (b) apparent particulate cobalt (P Co, pM) based on 675 analyses
for DCo and 203 analyses for P Co along the GEOTRACES-A02 section in the western Atlantic. Stations sampled during leg 4 are labeled in red. The domains of SAG, NASG, EA, SASG and SAW are characterized by the macronutrients concentrations and by the surface currents (e.g., NAD, NEC, SEC, and MBA).
(Figs. 4a–5b). However, DCo are slightly lower and shal-lower in the SASG (mean DCo value of 23.01 ± 4.17 pM,
n = 9) compared to those found in the NASG (mean DCo
value of 28.8 ± 4.8 pM, n = 15). Subsurface relative maxima of DCo were observed at about 10 m depth at a few sta-tions in the NASG. Deep relative DCo maxima were also observed at around 1250–1750 m depth in the NASG, which are in the core of NADW and below the oxygen minima. On the contrary, relative DCo maxima and oxygen min-ima were often located at the same depth in the SASG, within the core of the mixed NADW. In the AABW of the SASG, DCo was on average equal to 42.8 ± 2.23 pM (n = 15). In the two subtropical gyres, the P Co concentrations ranged from undetectable value (e.g., at 2500 m of St. 17) to 18.85 ± 3.97 pM (at 5510 m–34.3◦N). Like in the northern
latitudes, relatively high P Co concentrations were observed in the surface waters, decreasing with depth, and increasing again near the seafloor (Fig. 5e). The P Co distribution also showed, like DCo, relatively lower P Co concentrations in
the subsurface waters of the SASG (< 5 pM) compared to the NASG (> 5 pM).
In the equatorial area, the DCo distribution was char-acterized by low concentrations in the top 100 m (mean
DCoR100 m=29.6 ± 9 pM, n = 44), a sharp increase be-tween 100 and 250 m (mean DCo∫100–250 m=61.7 ± 13 pM,
n = 10), which continued to increase, reaching
maxi-mum values at about 400 m depth (mean DCo∫250–400 m= 73.2 ± 10 pM, n = 19) (Figs. 4–5c). These maximum con-centrations were the highest values recorded along the sec-tion and reached values up to 93.27 ± 3.31 pM (at 9◦S). Furthermore, these DCo maxima strongly correlated with the oxygen depletion (1DCo/1O2= −0.28 µM M−1, R2> 0.66; n = 57; P < 0.05). Between 1000 and 2500 m depth, the DCo concentrations were in the same range as those observed at 100–250 m depths (mean DCo∫1000–2500 m= 67.6 ± 5.8 pM, n = 33). Deeper DCo concentrations de-creased to a mean value of 41 ± 4 pM (n = 15) below 4000 m. The distribution of P Co in the equatorial domain
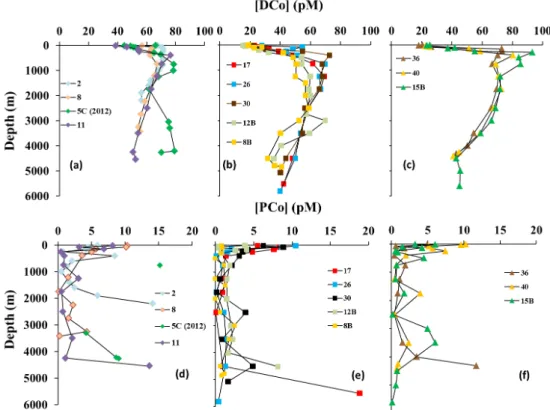
Fig. 5. Typical vertical distribution of dissolved (DCo) and apparent particulate (P Co) cobalt against depth in the different biogeochemical
domains: in the SAG, DCo (a) and P Co (d) are shown for Station 2 (64◦N, 34.25◦W), St. 8 (54◦N, 45.84◦W) St. 5c (50◦N, 44◦W) and St. 11 (48◦N, 39.4◦W); in the north and south subtropical domains DCo (b) and P Co (e) are shown at St. 17 (34.3◦N, 55.4◦W), St. 26 (23◦N, 65.55◦W), St. 30 (18.5◦N, 57.6◦W), St. 12b (22.47◦S, 32.7◦W) and St. 8b (35◦S, 39.4◦W); and in the equatorial area DCo (c) and P Co (f) are presented at St. 36 (7.8◦N, 48.9◦W), St. 40 (1◦N, 39.7◦W) and St. 15b (9◦S, 28◦W).
was similar to that observed in the other domains, with several extremely low (undetectable) values in deep waters and relatively higher concentrations (P Co > 5 pM) in surface waters, up to a maximum value of 10.24 ± 2.1 pM observed at 10 m at St. 40 (1.15◦N). A different pattern was, however, observed in the deep waters at 8◦N (St. 36), where significant and increasing P Co concentrations were detected between 3500 m (1.52 ± 0.7 pM) and 4315 m (11.73 ± 1.9 pM), as well as at 3◦S (St. 17b) where extremely high P Co
concen-trations were measured at 3500 m depth (12.53 ± 2.4 pM). In the surface waters, high P Co concentration (∼ 10 pM) was detected at 1◦N (St. 40) in the Amazon plume.
In the area of the Brazil–Malvinas confluence, DCo in-creased southward in the surface waters. The vertical distri-bution showed the highest DCo concentrations in the core of D-AAIW (100–600 m; Fig. 4a), whereas DCo levels de-creased in deeper waters, generating an apparent scavenged-type distribution at latitudes of 49–49.5◦S (St. 1b–2b). The
DCo concentrations observed in the youngest AABW
flow-ing in this area were the lowest values recorded in the core of the AABW along the section (DCo∫4000–6000 m= 34.9 ± 3 pM). Only one profile of P Co has been obtained in this area at 49◦S (St. 2b). It showed relatively high P Co
concentrations in the upper 300 m (P Co > 6 pM), and, as for
the other domains, undetectable P Co concentrations in deep-waters, except at 5000 m where P Co reached a maximum (11.8 ± 3.4 pM).
4 Discussion
4.1 Comparison of data sets of dissolved cobalt concentrations obtained at three crossover stations
Three crossover stations were occupied along the GEOTRACES-A02 section, at the Bermuda Atlantic Time Series BATS station (64.17◦W, 31.7◦N), at 9◦S during the US CoFeMUG cruise in 2007, and at 40◦S during the English GEOTRACES-A10 section in 2012 (Fig. 6).
Station BATS (St. 21) in the Sargasso Sea was occupied on 13 June 2010 during our GEOTRACES-A02 section sam-pling cruise. The DCo concentrations analyzed by the FIA-chemiluminescence method (this study, Fig. 6a and d: blue diamonds) are compared to those obtained by ICP-MS meth-ods either in the same samples (Middag et al., 2014; Fig. 6a and d: yellow dots), or during other sampling cruises (Biller and Bruland, 2012: green triangles in Fig. 6a and d; Middag et al., 2014: red squares in Fig. 6a and d). All samples were
Fig. 6. Intercomparison of DCo data sets at the crossover station BATS (a, d) between this study (blue diamonds) and ICP-MS method by
Biller and Bruland (2008) (green triangles) and by R. Middag et al. (personal communication, 2014) (yellow dots = samples from the 2010 Dutch GEOTRACES-A02 cruise; red squares = samples from the 2011 American GEOTRACES-A03 cruise); at the crossover station located at 9◦S (b, e) between this study (blue diamonds) and the CSV method by Noble et al. (2012) (green dots); and at the crossover station at 40◦S (c, f) between this study (blue diamonds) with FIA-chemiluminescence method by M. C. Lohan et al. (personal communication, 2014) (orange dots = samples from the 2010 English GEOTRACES-A10 cruise).
analyzed after UV treatment. In the deep waters, no signif-icant differences were observed between the different data sets, even when samples were taken in different years. On the contrary, differences were observed in surface waters (25– 200 m), with systematic higher DCo values using the ICP-MS compared to the FIA-chemiluminescence method. It is possible that seasonal variability, especially of the Co dust deposition – which widely varies in this area (Shelley et al., 2012), would cause those variations of DCo levels recorded in surface waters (Biller and Bruland, 2012; Middag et al., 2014; Fig. 6a and d: green triangles and red squares, respec-tively). However, further investigations are needed because differences are also observed in the same set of samples (this study; Middag et al., 2014: yellow dots in Fig. 6a and d), yielding an offset of 6–20 pM DCo in the top-100 m between the ICP-MS method and FIA-chemiluminescence analyses.
At 9◦S, the DCo concentrations analyzed by FIA-chemiluminescence in the samples collected during the GEOTRACES-A02 section sampling cruise (23 March 2011, St. 15b, this study) were compared with data analyzed by ca-thodic stripping voltammetry after UV-treatment, but in non-acidified samples (Noble et al., 2012). Despite the fact that the two stations are not exactly at the same location and that
they were sampled in different years, the hydrography and the nutrient distributions were similar (data not shown), al-lowing the comparison of the DCo data sets. The compar-ison showed an excellent correlation (R2> 0.98; Fig. 6e),
suggesting that both analytical methods were in good agree-ment. Less temporal variability in this area due to lesser dust inputs or coastal influences potentially allowed for the good agreement when comparing the two methods at this station.
At 40◦S, the two DCo data sets sampled during the
GEOTRACES-A02 section cruise (10 March 2011, St. 6b, this study) and the GEOTRACES-A10 section cruise (Jan-uary 2012; Lohan et al., 2014) were obtained using similar FIA-chemiluminescence methods after UV-digestion of the acidified sample. This method showed an overall good agree-ment between the two data sets in the upper 3000 m (Fig. 6c and f), and an offset of 8–15 pM in the deepest waters be-low 3000 m (Fig. 6c). The analytical methods and sample treatments were similar. However, this station was located on the Malvinas–Brazil confluence. Its position and intensity widely vary with season and with the incursion of subantarc-tic waters, notably of the Antarcsubantarc-tic Intermediate Waters and Circumpolar Deep Waters. The seasonal variations can ex-plain the differences of DCo observed at intermediate and
deeper depths between the two data sets. In the deepest wa-ters, the difference observed in the nepheloïd layer can be due to differences in the resuspension/dissolution of benthic sediments. Further investigation is needed to determine the sources of these differences.
4.2 Large-scale transportation of dissolved cobalt in the western Atlantic
The behavior of DCo in the deep ocean is still poorly under-stood due to the lack of observations in the full water col-umn, notably in the western Atlantic Ocean, as well as in the Indian and the central Pacific oceans. The few studies that report DCo concentrations in the deep ocean suggested a de-crease of DCo levels in the deep waters from the Atlantic Ocean (80.8 pM), to the Southern Ocean (39.7 pM), and to the Pacific (28.8 pM) (Bown et al., 2011; Aparicio-Gonzalez et al., 2012). This observation has lead to the hypothesis that there is no accumulation or conservation of DCo along the thermohaline circulation, and to classify DCo, in the lit-erature, among either the scavenged-type element like alu-minium (Aparicio-Gonzalez et al., 2012) or the hybrid-type metals, those elements that have a nutrient behavior in sur-face waters and are strongly influenced by scavenging pro-cesses in the deep waters (Noble et al., 2008). However the scavenging of DCo invoked to interpret the deep inter-basins fractionation contrasts with DCo known to be stabilized in solution by strong complexation with organic ligands (con-ditional stability constant KCoL> 1013) (Saito and Moffett, 2001; Saito et al., 2004, 2005, 2010; Bown et al., 2012a). On the other hand, other processes, such as mixing of water masses, have also been suggested to account for the decrease of DCo along the circulation in poor-oxygenated waters (No-ble et al., 2012). We further investigated the behavior of DCo along the water-masses transportation in the deep and inter-mediate western Atlantic, which is conceptualized in Fig. 7.
4.2.1 Transportation in bottom waters within the core of AABW
The Antarctic Bottom Waters spread northward with a trans-port of 3–5 Sv (where 1 Sv is equal to 106m3s−1)
follow-ing the topography, in an opposite direction to the overlay-ing NADW (Tomczak and Godfrey, 2003). The mean DCo concentration in the AABW below 4000 m is 41.75 ± 5.3 pM along the whole transect (n = 87), but higher DCo levels are found in the older AABW flowing in the Northern Hemi-sphere than in the more recently formed AABW flowing in the Southern Hemisphere (mean values of 44.52 ± 4.8 pM,
n = 42; and 39.29 ± 4.4 pM, n = 45, respectively). At the
same southern latitudes, DCo concentrations were similar to those reported in the core of the recently formed AABW, but in the eastern Atlantic Ocean (Bown et al., 2011; Table 2). Similar northward bottom enrichment of DCo in the core of AABW (see Supplement Fig. S1a), together with water mass
pathway and aging, has also been observed in the eastern At-lantic sector (Bown et al., 2011). Enrichment due to mixing of the AABW with the NADW in the subarctic basin is un-likely since DCo display similar concentrations in the cores of these two water masses (Table 2). Bottom enrichment due to resuspension of abyssal sediments and their dissolution during AABW transportation is more likely to account for the northward increase of DCo. Such enrichment of DCo in waters following contact with basaltic sediments has recently been highlighted in a study on the Kerguelen Plateau (Bown et al., 2012b). The significant increase of P Co observed close to the seafloor in the Northern Hemisphere (Fig. 5), rising up to 30 % of the total cobalt concentration at 34◦N, also suggested that sediment resuspension could be significant. This is further supported by the strong signal of high dis-solved aluminium concentrations observed in the bottom wa-ters of the northern section (40–50◦N) (R. Midagg, NIOZ,
personal communication, 2014). Additionally, the concomi-tant increase of P Co and transmissometry near the seafloor (data not shown) strongly suggested benthic remobilization of cobalt. Finally, there was no record of high DCo at the bot-tom of the Mid-Atlantic Ridge (Fig. 4a), suggesting that hy-drothermal activity may not be acting as a significant source of DCo, as previously thought (Bown et al., 2011).
4.2.2 Transportation within the core of the NADW
Comparison of the DCo concentrations recorded in this study in the cores of the NEADW, NADW and D-AAIW with those reported in the southeastern Atlantic (Bown et al., 2011) shows an excellent agreement (Table 2). This compar-ison suggests that DCo may not be scavenged during zonal (eastward) transportation across the South Atlantic at inter-mediate and deep depths.
To investigate the meridional transportation of DCo across the deep western Atlantic Ocean in the core of the NADW, this water mass was characterized along its route southward with respect to its mean DCo concentrations at three dif-ferent potential density anomaly, corresponding to its cen-ter (σ 0 = 27.85 ± 0.02), its upper-limit where the NADW interacts with intermediate waters (e.g., σ 0 = 27.65 ± 0.1), and its lower-limit in contact with bottom waters (e.g., σ 0 = 27.89 ± 0.015) (see Supplement Fig. S1b). No significant variations were observed along these isoclines from the sub-arctic gyre to the equatorial area (e.g., DCo = 68.7 ± 6 pM,
n = 62 at σ 0 = 27.65; 58.8 ± 3 pM, n = 19 at σ 0 = 27.85;
56.9 ± 7 pM, n = 21 at σ 0 = 27.89), suggesting conserva-tive behavior of DCo in the NADW. Around the Equa-tor, DCo concentration increased at two potential den-sities (71.4 ± 4.4 pM, n = 10 at σ 0 = 27.65; 62.6 ± 5 pM,
n = 14 at σ 0 = 27.85) and decreased in the denser waters
(DCo = 51.9 ± 8 pM, n = 20 at σ 0 = 27.89). There was no variation of P Co in this area at σ 0 = 27.65 and σ 0 = 27.85, and there was an increase of P Co at σ 0 = 27.89 (by 4.6 pM), all suggesting that remineralization of P Co could not be
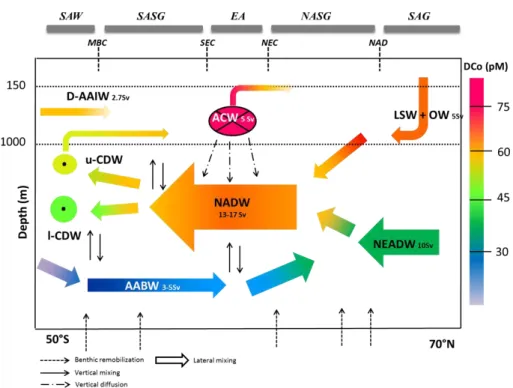
Fig. 7. Conceptual schema of the DCo transportation along the large-scale circulation in the intermediate and deep western Atlantic Ocean. Table 2. Averaged dissolved cobalt concentration (DCo) and standard deviation (SD) obtained in the different water masses encountered
along the western Atlantic GEOTRACES-A02 section: the Northeast Atlantic Deep Water (NEADW), Labrador Sea Water (LSW), North Atlantic Deep Water (NADW), Western Atlantic Central Waters (W-ACW), Northwest Antarctic Bottom Water (NW-AABW), Southwest Antarctic Bottom Water (SW-AABW), Upper Circumpolar Deep Water (UCDW) and Drake Antarctic Intermediate Water (D-AAIW).
Water mass DCo (pM)
(Others) DCo (pM) (This study) SD (pM) (This study) n (This study) NEADW 53.9 ± 3.3a 54.3 2.7 24 LSW 68.8 3.2 38 NADW 59.2 ± 2.05a 70 ± 11b 61.8 8.2 204 W-ACW 79 ± 11b 71 9 41 NW-AABW 44.52 4.8 42 SW-AABW 40.0 ± 2.49a 42 ± 12b 39.29 4.4 45 UCDW 57.3 ± 2.18a 58.7 3.9 4 D-AAIW 55.8 ± 3.68a 53.7 4.3 11
afrom Bown et al. (2011).bfrom Noble et al. (2012).
directly related to the increases in DCo at those depths. Hence, the enrichment of DCo in the upper NADW may be more likely due to mixing with the overlaying Western Atlantic Central Water (W-ACW), containing relatively high
DCo concentrations (> 85 pM).
Southward, the concentrations of DCo and P Co in the three layers were similar to those observed in the equa-torial area until 20◦S (σ 0 = 27.88) or 30◦S (along σ 0 = 27.65 and σ 0 = 27.85) (see Supplement Fig. S1b), again suggesting that DCo behaved conservatively at those south-ward latitudes. However, south of 20◦S, a decrease of DCo
concentrations was observed along the three isoclines (see Supplement Fig. S1b). This decrease was more pronounced at the upper and lower limits than in the center of the NADW (e.g., the difference of concentrations between the North and the South Atlantic are 1DCoσ 0 = 27.65= −11.5 pM;
1DCoσ 0 = 27.85= +1.5 pM; 1DCoσ 0 = 27.89= −10.3 pM).
There was no variation in the P Co concentrations associ-ated with the decreases in DCo at the three depths (Fig. 4b), again suggesting that scavenging of DCo onto particles is not likely. Mixing and dilution of the NADW with the overlaying waters (D-AAIW in the upper limit and AABW in the lower
layer) containing lower concentrations of DCo (Table 2) are thus more likely to explain the DCo decrease. Since mixing is stronger at the edges of the water masses, the center of the NADW would be less impacted by such mixing effect.
We further investigated the effect of water-masses mixing on the southward DCo gradients along the NADW by cal-culating the DCo concentrations resulting from the dilution of intermediate and deep water masses (Fig. 7). In the north-ern section, the NADW is formed by mixing 5 Sv of LSW with a mean DCo concentration of 68.8 ± 3.17 pM (n = 38; Table 2), with 10 Sv of NEADW with a mean DCo concen-tration of 54.3 ± 2.69 pM (n = 24; Table 2) (Tomczak and Godfrey, 2003). The resulting theoretical concentration of
DCo of 59.13 pM compared perfectly with the mean DCo
concentration observed in the NADW (61.4 ± 7.8, n = 204; Table 2). In the equatorial area, the mixing of 15 Sv of the NADW with the 4 Sv of the W-ACW (Schmitz, 1995) leads to a theoretical DCo concentration of 66.1 pM, which is in excellent agreement with our measurements in this area (DCo = 65.3 ± 7, n = 43). The slight increase observed in the DCo concentration of the NADW in this area can thus be due to mixing between the high DCo concentrations of the W-ACW and the NADW. The vertical mixing occurs through internal waves that can provide a mix of more than half of the NADW (up to 8 Sv) (Webb and Suginohara, 2001). Along the southward flow of the NADW in the Southern Hemi-sphere, the DCo concentrations are higher than in the north (DCo = 63.7 ± 7 pM, n = 23) until 30◦S, beyond which a strong decrease is observed (DCo = 54.6 ± 7 pM, n = 45). Here, the penetration of the 2.7 Sv of D-AAIW (You, 2002) in the intermediate ocean, along with the 5 Sv of AABW in the deep sea (Tomczak and Godfrey, 2003), leads to a the-oretical DCo concentration of 54 pM in the NADW, which is in excellent agreement with the concentration we mea-sured in the NADW for this area (54.3 ± 6.6 pM, n = 41). Thus, mixing with overlaying water masses seems to control the concentrations of DCo along the circulation pathway of the NADW from the subarctic gyre to the south-western At-lantic, rather than scavenging processes. The lack of scaveng-ing has previously been suggested in the central Atlantic (No-ble et al., 2012) and in the Ross Sea (Saito et al., 2010). Here we further support that dissolved cobalt would behave con-servatively in the deep western Atlantic Ocean along the ther-mohaline circulation. In turn, the apparent scavenged profile observed in the southern part of the section (SAW) resulted from the incursion of DCo-depleted waters at the bottom of the ocean (AABW) and D-AAIW in intermediate waters.
4.2.3 Temporal variation in the Subarctic gyre
Resampling of the subarctic gyre after 2 years showed that the DCo concentration increased by 20.5 ± 5 pM in the NEADW below 3000 m when comparing station 5c of leg 4 (2012) with the stations 8 and 11 of leg 1 (2010) at about 51◦N (Fig. 4a). Integrated on the thickness of the
NEADW (1250 m), this increase corresponded to about 25.6 ± 6.3 µmol m−2. Associated with these relatively high
DCo concentrations, relatively high P Co concentrations
were also observed below 3000 m depth (P Co > 5 pM; Figs. 4b and 5d). The transit time of the NEADW to the latitude where the increase of DCo was detected is esti-mated to be around 2 years (Fine et al., 2001). Two possi-ble hypotheses could be invoked to explain this anomaly ob-served at this location: (i) intensive sediments input in the NEADW through resuspension and dissolution, and/or diffu-sive processes during its circulation above the seafloor; and (ii) strong external input of cobalt to the Arctic surface wa-ters transferred to the deep ocean by the formation of the NADW and its transportation through the deep large scale circulation.
Considering an input of DCo from dissolution of basalt or granite rocks of 0.054 ± 0.014 to 2.00 ± 0.22 × 10⁻¹¹mol m−2d−1 (Hausrath et al., 2009) and assuming this input would be continuous during the transit of the NEADW, the maximum cumulative input after two years of transit would be 14.6 nmol m−2, which is three orders of magnitude lower than the excess observed. On the other hand, when considering a diffusive flux of Co from basalt of 31.1 nmol m−2d−1 estimated on the eastern Kerguelen Plateau (Bown et al., 2012a) and assuming a cumulative ef-fect along the transportation of the water masses, the in-put would be 22.7 µmol m−2, in the range of the excess in
DCo observed at station 5c. However, the relatively
poor-oxygenated waters (O2< 200 µM) flowing along the Ker-guelen eastern slope coupled to a relative high slope cur-rent (0.08 cm s−1) could have enhanced sediment resuspen-sion (Bown et al., 2012b) and makes the comparison with our rather well ventilated bottom waters (O2> 270 µM) difficult. Furthermore, if sediment resuspension and dissolution would have caused the DCo anomaly, an increase in DCo along the pathway of the NEADW would be expected; however, this was not observed (Fig. 4a). Therefore, it is unlikely that the benthic input of DCo would cause the enhanced DCo con-centrations that we observed in the core of the NEADW in 2012.
In April–May 2010 the Icelandic volcano Eyjafjallajökull erupted in the Arctic. The NEADW that forms in the Arctic transited for 2 years to reach the latitude where the excess of
DCo was observed two years after the eruption in 2012 (Fine
et al., 2002). It is thus conceivable that the DCo enrichment could be related to the input of these volcanic ashes and its advection by the NEADW. Volcanic ash emissions and sub-sequent deposition to the surface ocean have been reported to be a source of Co to the ocean (Frogner et al., 2001). Most of the ash deposition occurred close to the vent, with 98 % of the tephra being transported less than 600–700 km from the source, and then decreasing exponentially (Gudmundsson et al., 2012). Using an ash deposition model and the mean bulk density determined by Gudmundsson et al. (2012), we esti-mated an ash input of 1.68 ± 0.7×10¹⁴g of tephra in the first
9 × 10⁴km2around Iceland, where the NEADW is formed. Using this input and a cumulative release of 8.76 nmol of
DCo per gram of similar Iceland tephra (calculated after
1.5 h of release from Frogner, 2001), the input of DCo is thus estimated at around 16.3 ± 6.3 µmol m−2 DCo in this area.
Reported to the top 100 m, it represents an input of DCo of 163 ± 63 pM, which is at least 1.5 and up to 2.5 times the concentration observed in upper 100 m at similar latitudes in the western subarctic gyre (DCo∫100 m=67.2 ± 2 pM), and much higher than the excess of DCo observed south-ward two years later (20.5 ± 5 pmol). Similarly, it has been shown that the 2010 Icelandic eruption had significantly en-hanced iron concentrations in surface waters of the Arctic Sea, locally increasing by a factor 2.5 the iron concentration in solution even 6 days after the ash deposition (Achterberg et al., 2013). Furthermore, the mean input of DCo we es-timated from the volcanic ashes (16.3 ± 6.3 µmol m−2) was in the same order of magnitude than the excess of DCo we measured two years later (25.6 ± 6.3 µmol m−2). These
ob-servations strongly suggested that the volcanic eruption was a source of DCo that has been advected in the core of the NADW. Because of the quick release of Co from the ash (Frogner et al., 2001), and probably because of the short res-idence time of these particles in the surface waters, it is pos-sible that most of the input of DCo occurred under the ash plum. Its advection by the NADW then enhanced the con-centration of DCo far away from the eruption, similarly to the advection of DCo from continental margins (Bown et al., 2011).
4.2.4 The incursion of the Atlantic Central Waters
The highest concentrations of DCo observed at intermedi-ate depths in the equatorial area of the section were found in the core of the Atlantic Central Waters (ACW) that origi-nate from the eastern Atlantic (Poole and Tomczak, 1999), and those DCo maxima correlated with the O2 minimum (Figs. 2c, 4a and 5c). Actually, the incursion of the ACW constituted the major reservoir of DCo in the western At-lantic between the equatorial domain and the Caribbean basin (Fig. 4a). At these latitudes but in the eastern Atlantic, the O2 depletion (Tomczak and Godfrey, 2003) and the DCo con-centrations (> 150 pM; Noble et al., 2012) are even higher in the ACW compared to the western Atlantic, suggesting zonal westward transportation and decrease of DCo across the central Atlantic ocean. Reductive dissolution in the poor-oxygenated waters, resuspension of particulate matter in the sediments along the shelves of the eastern Atlantic, and rem-ineralization processes were suspected to cause the DCo en-richment in the ACW observed in the eastern Atlantic (No-ble et al., 2012). A decrease in DCo concentrations was also observed along the transit of the ACW in the eastern basin, where scavenging could not be discerned from water masses mixing (Noble et al., 2012). Once reaching our meridian section, the concentration of DCo continued to decrease
northward in the flow of the ACW (from 93 ± 1.3 pM at 290 m, St. 15b to 73 ± 0.6 pM at 150 m, St. 36). Accom-panying these decreases, there was no significant enrich-ment in P Co (Figs. 4b and 5f), suggesting that scavenging was negligible compared to mixing and vertical diffusion. As discussed above, mixing processes with the NADW can contribute to the decrease in the DCo concentrations along the westward transportation of the ACW. Furthermore, us-ing the mean decrease of 15 nmol m−3 of DCo concentra-tions integrated into the W-ACW from St. 15b (9◦S 28◦W) to St. 36 (8◦N 49◦W) and considering the 4 Sv introduced by the ACW in this area (Schmitz, 1995), we estimated a de-crease rate of DCo of about 5.2 ± 0.5 × 10³mol d−1due to the spread of the ACW northward. Reported to the surface of 2 × 10⁶km2occupied by the ACW between 9◦S and 8◦N in the western Atlantic, this decrease rate corresponded to 2.6 ± 0.25 nmol m−2d−1. This zonal decrease rate compared well with the one we estimated between 10◦E and 30◦W
using published DCo values for the eastern area (Noble et al., 2012). Indeed, we estimated a decrease in DCo con-centrations of 56 ± 14.8 nmol m−3across the central Atlantic Ocean (10×106km2), which corresponded to a decrease rate of 1.93 ± 0.5 nmol m−2d−1when considering the ACW flow rate. In addition to dilution of the ACW, we suggest hereafter that the decreases of DCo can also be partially caused by vertical diffusion and advection of DCo to the surface wa-ters, especially close to the equatorial currents where frontal systems and high turbulence were observed.
4.3 Remineralization and decoupling of the cobalt and phosphate relationship in the intermediate
western Atlantic
4.3.1 Remineralization of cobalt in the Atlantic Central Waters
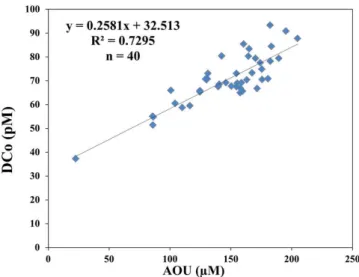
The highest DCo concentrations recorded along the section were observed in the ACW (Fig. 4a marked by the low-est concentrations of O2 (Fig. 2c)). Hence, we estimated the portion of DCo resulting from cumulative remineral-ization in the ACW by using the apparent oxygen utiliza-tion (AOU). The AOU represents the integrated oxygen con-sumption by heterotrophic bacteria in the breakdown of or-ganic matter and it is computed as the difference between the oxygen saturation concentration, which depends on ther-mohaline properties (Weiss, 1970), and the observed oxygen concentration. The significant correlation between AOU and
DCo recorded in these waters (Fig. 8) strongly suggests that
remineralization was driving the internal cycle of cobalt in these intermediate waters. Other studies have also reported relatively high DCo concentrations in low-oxygenated wa-ters (Saito et al., 2004; Pohl et al., 2011; Noble et al., 2012). This relationship is used to estimate the concentration of
DCo due to the cumulative remineralization in the ACW
Fig. 8. Relationship among the concentrations of dissolved cobalt
(DCo) and the apparent oxygen utilization (AOU) in the intermedi-ate wintermedi-aters of the equatorial area (150–750 m).
to the recorded concentration of DCo (%DCoremineralized, Eq. 2), as follows:
[DCo]remineralization=(RCo : P×RP : O2×AOU) (1) %DCoremineralized=100 × [DCo]remineralization
/[DCo]observed, (2) where RCo : Pis the stoichiometric Co : P ratio recorded in the surface waters of the equatorial area (with an average value of 27 × 10−6M M−1; Dulaquais et al., 2014), and RP : O2is the stoichiometric ratio between phosphate production and oxygen consumption (e.g., RP : O2=1/170 M M−1; Matear and Hirst, 2003; Oschlies et al., 2008; Krishna-Murty et al., 2009).
The concentration of DCo due to remineralization was thus estimated at about 23 ± 5 pM in the western ACW between 150 and 800 m, representing 32 % of the DCo measured (DCo∫150–800 m=71 ± 9 pM). In its layer fed by the central South Equatorial Current (CSEC, 400–800 m), the cumulative remineralized DCo could be even higher, representing up to 37 % of DCo (Table 3). If this rem-ineralized DCo was only supplied by the transportation through the CSEC from the eastern basin, this proportion should be greater in the eastern central Atlantic where di-lution with NADW does not affect this water mass yet. But we estimated a similar proportion in the eastern Atlantic (%DCoremineralized=38 ± 5 %) by using the DCo data set of Noble et al. (2012). This result suggested that the DCo provided by remineralization in the west equatorial Atlantic is likely a combination of a westward transportation of the
DCo remineralized in the eastern Atlantic basin, the
cumu-lative remineralization along the transportation of ACW in these O2depleted waters, and the mixing between NADW and ACW across the equatorial Atlantic and in the western basin.
4.3.2 Decoupling of the relationship between cobalt and phosphate
Several studies have shown that the biological utilization of
DCo can be proportional to that of phosphate (P) in the
surface waters of oligotrophic provinces (Saito et al., 2004, 2010; Jakuba et al., 2008; Noble et al., 2008; Bown et al., 2011). However, the lower apparent remineralization of DCo compared to P in intermediate and deep waters described by Bown et al. (2011) can suggest a decoupling between DCo and P in deeper waters. In our study, the absence of a sig-nificant correlation between DCo and P in intermediate and deep waters along the section (R2< 0.1, n = 446) further
supported a decoupling between DCo and P in deep waters. Furthermore, the overall lower DCo : P ratios observed in deep waters compared to the surface (data not shown) and the increase with depth of the Co : P ratio in the particles (Sher-rell and Boyle, 1992; Table 3) both suggested that the decou-pling can be either due to the preferential remineralization of P relative to Co, or to the preferential scavenging of DCo. However, our measurements shown that P Co concentrations were not increasing with depth but instead they were rather decreasing (Table 3), strongly suggesting that scavenging of
DCo could be negligible. Hence, we further investigated the
impact of the remineralization on the decoupling between
DCo and P in the equatorial area where the OMZ was
lo-cated and where ACW dispatched the highest DCo concen-trations recorded along the section. The proportion of P due to the cumulative remineralization (%Premineralized) was thus estimated according to
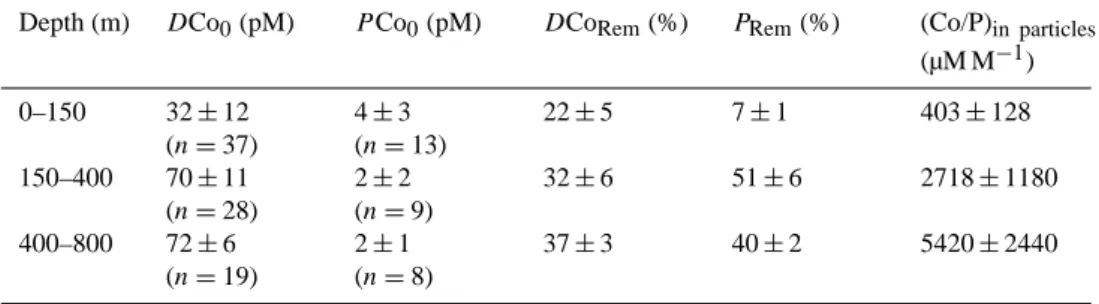
%Premineralized=100 × (RP : O2×AOU)/[P ]observed. (3) In this area, the proportion of P and Co produced by the cu-mulative remineralization was estimated in the surface layer mainly impacted by the geostrophic currents (0–150 m), the upper layer of the ACW which was influenced by the North Brazil Undercurrent, the equatorial and central branches of the South Equatorial Current, all forming the North Brazil Current at these depths (150–400 m), and the lower layer of the ACW mostly fed by the CSEC (400–800 m). It shown that the proportion of P provided by cumulative remineraliza-tion increased by a factor 7.4 between the surface layer and upper-ACW, whereas this increase was much lower for DCo (factor 1.5) (Table 3). This result suggested that the reminer-alization of P and DCo was not proportional in intermediate waters, and further supported the hypothesis that the prefer-ential remineralization of P relative to DCo can largely cause the decoupling in deeper waters. Furthermore, the strongest remineralization of DCo that occurred deeper than that of P in the core of the lower-ACW (Table 3) may also lead to the decoupling between the deep cycles of DCo and P. De-termination of the particles composition in Co and P would further help in understanding the processes involved in this decoupling.
Table 3. Mean dissolved cobalt concentration (DCo; pM), mean apparent particulate cobalt concentration (P Co; pM), and percentages of
dissolved cobalt and phosphate produced by cumulative remineralization (respectively DCoremand Prem; %) calculated in the surface layer (0–150 m), the upper layer of Atlantic Central Waters (150–400 m) and the lower layer of Atlantic Central Waters (400–800 m) between 10◦S and 10◦N (see text for definitions and calculation). The particulate ratios of Co : P ((Co/P)in particles; µM M−1) recorded in the western Atlantic (Sherrell and Boyle, 1992) are also indicated for comparison. Errors are given as standard deviation from averaged values.
Depth (m) DCo0(pM) P Co0(pM) DCoRem(%) PRem(%) (Co/P)in particles (µM M−1) 0–150 32 ± 12 (n = 37) 4 ± 3 (n = 13) 22 ± 5 7 ± 1 403 ± 128 150–400 70 ± 11 (n = 28) 2 ± 2 (n = 9) 32 ± 6 51 ± 6 2718 ± 1180 400–800 72 ± 6 (n = 19) 2 ± 1 (n = 8) 37 ± 3 40 ± 2 5420 ± 2440
4.4 Physical processes impacting the distribution of dissolved cobalt in surface waters
4.4.1 Lateral advection in surface waters
The lateral advection from continental margin is thought to be a source of DCo in the open surface ocean (Bown et al., 2011, 2012b; Noble et al., 2012), but this source is still largely uncharacterized. Therefore, we estimated the lateral advective DCo supply in the surface waters of the section (F DCoadv; Eq. 4) by calculating the local geostrophic veloc-ities (u, v; referenced 1000 dbars) based on sea level anoma-lies (SLA, www.aviso.oceanobs.com), and using the lateral
DCo gradients (x, y) integrated in the upper 150 m (z)
be-tween two nearby stations (a, b; Eq. 5), using the following equations:
F DCoadv(a) =GradDCo(x,y)×velocitya×z (4) GradDCo(x,y)=[(DCob ∫ 150 m)
−(DCoa ∫ 150 m)]/da→b, (5) where DCoi ∫ 150 mis the mean DCo concentration integrated
over the upper 150 m at station (i); velocityi is the lateral
geostrophic velocity at station (i) integrated over the upper 150 m; z is equal to 150 m; and da→bis the distance between
stations (a) and (b). A positive velocity is associated with a positive SLA and represents an advection from the consid-ered station, and inversely for a negative velocity.
The dynamic structures with high lateral geostrophic ve-locities were generally observed in the frontal zones along the section (Table 4) and were associated with strong local currents (up to 20 cm s−1, as observed at 5◦N), whereas rel-atively low velocities were estimated in the center of each oceanic domain (< 2 cm s−1). However, isolated events such
as eddies were also identified in the center of the NASG (Table 4). The estimations of the lateral advective fluxes of DCo in surface waters showed variations of more than two orders of magnitude between the different areas (Ta-ble 4). For instance, in the center of the domains like at
the station BATS, the geostrophic velocities and lateral DCo gradients were smooth, resulting in negligible lateral fluxes of DCo (−1 nmol m−2d−1< F DCoadv< 1 nmol m−2d−1). On the contrary, in the frontal zones where turbulence and significant lateral DCo gradients can be observed, the lateral advection fluxes of DCo were relatively high in surface wa-ters (from −61 nmol m−2d−1to 55 nmol m−2d−1, Table 4). The DCo fluxes from lateral advection in surface wa-ters can be important at a given station, but at the scale of a domain the impact was relatively limited, especially in the SASG. Indeed, at this scale the sum of the fluxes was low (−3 nmol m−2d−1< F DCo < 3 nmol m−2d−1).
Never-theless, the lateral advection within mesoscale structures, such as eddies, can be particularly important for the trans-portation of DCo to interior basins, as it has been previously observed in the oligotrophic domain of the southeastern At-lantic where inputs of DCo from continental margins were carried by Agulhas rings (Bown et al., 2011). Moreover, ed-dies can allow exchanges of DCo between the different do-mains along the section, especially between the central At-lantic and the NASG through the equatorial current system, and between the SASG and the ECC through the MBC. Lo-cal turbulence associated with eddies can also induce loLo-cal vertical advection (such as upwelling in the core of cyclonic eddies) as well as diffusion of DCo from the intermediate waters. It has been shown that such physical processes can affect the vertical distribution of DCo in surface waters (No-ble et al., 2008; Shelley et al., 2012). All these direct and indirect effects make these dynamical structures sources or sinks of DCo to the surface layer.
4.4.2 The vertical diffusion
The vertical diffusion has been described as an important source of iron (Fe) and other nutrients to the euphotic layer, sustaining phytoplankton development in Fe-depleted areas (Law et al., 2003; Croot et al., 2005; Blain et al., 2008). In the equatorial Atlantic this internal source of Fe may be even greater than the input of Fe from Saharan dust deposition
Table 4. Lateral gradient of dissolved cobalt (Grad DCo∫150 m; 10−5nmol m−3m−1), and lateral advective fluxes of dissolved cobalt (F DCoadv; nmol m−2d−1) generated by local geostrophic lateral advection (F wGeo; cm s−1) are given in the upper 150 m for several sampling stations corresponding to key dynamical structures or domains.
Location Structure Grad DCo∫150 m F wGeo F DCoadv
St. 5 (37◦W, 60◦N) Center of SAG +0.39 −0.23 −0.11
St. 15 (50◦W, 37.5◦N) Anti-cyclonic eddy +1.37 −9.73 −17.28
St. 21 (BATS) Center of NASG −0.39 −0.16 0.08
St. 25 (67◦W, 25◦N) Cyclonic eddy −0.15 +13.28 −2.54 St. 36 (48.9◦W, 7.8◦N) NEC −3.21 +10.03 −41.67 Btw St. 37–38 (45◦W, 5◦N) ECC −2.08 −19.99 54.82 Btw St. 16b–17b (28.5◦W, 5◦S) SEC −0.61 +3.92 3.19 St. 12b (32.7◦W, 22.5◦S) Center SASG +0.62 +1.15 +0.92 St. 6b (42.5◦W, 40◦S) MBC −1.58 −7.76 15.85 Btw St. 2b–3b (48◦W, 48◦S) Malvinas current +0.02 −7.54 −0.23
(Rijkenberg et al., 2012). However, the importance of this supply for DCo still has to be determined in the ocean. In the Southern Ocean and above the Kerguelen Islands the supply of DCo to surface waters by vertical diffusion has been es-timated to be negligible due to the small gradient in DCo concentrations between the euphotic and mesopelagic lay-ers caused by low biological assimilation of DCo in these diatom-dominated waters (Bown et al., 2011, 2012b). By contrast, strong vertical gradients in DCo concentrations be-tween the surface and the nutricline were observed along the section in the western Atlantic Ocean, especially in the equa-torial area (Fig. 5), allowing us to estimate this supply.
Briefly, the diffusion depends on the vertical gradient of DCo concentrations, the diffusion coefficient (DT) and
the turbulent diffusivity coefficient (Kz). Whereas DT is a
physico–chemical property of the component within water (molecular property), the turbulent diffusivity coefficient is solely a property of the turbulent fluid. If the vertical gradient of concentrations (∂DCo /∂z) is much higher than the lateral gradients (∂Co/∂x ≈ ∂DCo/∂y), the lateral diffusion is con-sidered negligible (see Tables 4 and 5). Furthermore, the val-ues of Kzestimated along the section (M. Rijkenberg, NIOZ,
personal communication, 2013) were three to six orders of magnitude higher than DT; hence, the molecular diffusivity
was considered negligible. The highest values of Kz were
found near frontal zones (M. Rijkenberg, NIOZ, personal communication, 2013) where strong geostrophic velocities were observed. One to two orders of magnitude lower turbu-lent diffusivities were found in the subtropical domains, co-herent with lower turbulence of the water column and lower wind stress.
The intrusion of the ACW in the southern side of the equa-torial area and its northward flow along the coast of South America through the Guyana and Caribbean Currents (Poole and Tomczak, 1999) transported relatively high DCo within the mesopelagic layer and at the bottom of the euphotic layer (100–250 m) between 10◦S and 10◦N (Fig. 4a). Due
Table 5. Vertical dissolved cobalt gradient (1DCo/1z100–300 m;
nmol m−3m−1), mean Kz100–300 m(cm2s−1) and vertical dissolved
cobalt fluxes from the mesopelagic layer to the euphotic layer (F DCovertical diff.; nmol m−2d−1) at few stations representative of the different areas crossed along the section (see text for the details of the calculations).
Location 1DCo/1z Kz F DCovertical diff.
100–300 m St. 15 (50◦W; 37.5◦N) 0.115 7.03 +6.96 St. 21 (BATS) 0.069 0.08 +0.05 St. 26 (65.5◦W; 23.3◦N) 0.121 0.07 +0.07 St. 36 (48.9◦W; 7.8◦N) 0.291 2.44 +6.13 St. 15b (28◦W; 9◦S) 0.305 1.23 +3.16 St. 12b (32.7◦W; 22.5◦S) 0.062 0.11 +0.06 St. 6b (42.5◦W; 40◦S) 0.084 3.72 +2.69
to relatively high DCo assimilation in surface waters at these latitudes (Dulaquais et al., 2014), strong DCo vertical gra-dients were generated between the surface and intermediate waters (Figs. 4a and 5). For instance, the DCo vertical gradi-ent can be as high as 0.31 nmol m−3m−1 in the equatorial area at 9◦S. By contrast, the vertical gradients are gener-ally smooth in the subtropical domains and in the subarctic gyre (<0.07 nmol m−3m−1). Combining the vertical
gradi-ents with the Kz pattern, it is obvious that the vertical
dif-fusion DCo supply was expected to be higher in the frontal zones of the equatorial area than in the other domains. To fur-ther assess the role of the vertical diffusion on the distribution of DCo in surface waters, we estimated the DCo vertical dif-fusion flux (F DCodiffusion) in the different domains using the following equation:
F DCodiffusion= −(Kz+DT) × (∂DCo/∂z) (6)
with 103< (Kz/DT) < 106.
The DCo supply to the euphotic layer by vertical diffu-sion (Table 5) varies by two orders of magnitude between the frontal zones (e.g., 7 nmol m−2d−1in the north subtropical