Accepted Manuscript
Emulsifying properties of legume proteins at acidic conditions: Effect of protein concentration and ionic strength
Yakoub Ladjal ettoumi, Mohamed Chibane, Alberto Romero
PII: S0023-6438(15)30269-3
DOI: 10.1016/j.lwt.2015.10.051
Reference: YFSTL 5046
To appear in: LWT - Food Science and Technology Received Date: 7 June 2015
Revised Date: 7 August 2015 Accepted Date: 19 October 2015
Please cite this article as: Ladjal ettoumi, Y., Chibane, M., Romero, A., Emulsifying properties of legume proteins at acidic conditions: Effect of protein concentration and ionic strength, LWT - Food Science and Technology (2015), doi: 10.1016/j.lwt.2015.10.051.
This is a PDF file of an unedited manuscript that has been accepted for publication. As a service to our customers we are providing this early version of the manuscript. The manuscript will undergo copyediting, typesetting, and review of the resulting proof before it is published in its final form. Please note that during the production process errors may be discovered which could affect the content, and all legal disclaimers that apply to the journal pertain.
M
AN
US
CR
IP
T
AC
CE
PT
ED
Emulsifying properties of legume proteins at acidic conditions: Effect of
1
protein concentration and ionic strength
2
Yakoub LADJAL ETTOUMIa*, Mohamed CHIBANEb, Alberto ROMEROc 3
a
Département des Science Alimentaires, FSNV, Université Abderahman Mira, Bejaia, Route
4
Targa Ouzemour, Bejaia 06000, Algérie.
5
b
Laboratoire de Gestion et Valorisation des Ressources Naturelles Assurance Qualité,
6
Université Akli Mohand Oulhadj de Bouira, 10000 Bouira, Algérie.
7
c
Departamento de Ingeniería Química, Facultad de Química, Universidad de Sevilla, 41012
8
Sevilla, Spain.
9
*Yakoub LADJAL ETTOUMI
10
Département des Science Alimentaires, FSNV, Université Abderahman Mira de Bejaia, Route
11
Targa Ouzemour, Bejaia 06000, Algérie.
12 E-mail: yakoblajel@hotmail.fr 13 Phone:+213 699 44 67 56. 14 Abstract 15
This work is focused on emulsifying properties of pea, chickpea and lentil protein isolates at
16
acidic conditions (pH 3), as affected by protein concentration and ionic strength. Emulsions
17
characteristics and stability (droplet size distribution, flocculation, coalescence and creaming)
18
were determined. The microstructure of selected emulsions was also studied. Results
19
indicated that emulsifying properties (ability and stability) are dependent to protein
20
concentration and highly sensitive to ionic strength. In our conditions, the best emulsifying
21
properties are found around 1.5% of protein, and at less than 50 mM of NaCl. Clearly, ionic
M
AN
US
CR
IP
T
AC
CE
PT
ED
strength affects emulsions microstructure. Thus, this study indicated that pea, chickpea and
23
lentil proteins would have great potential as emulsifiers in acidic food formulations.
24
Keywords: Acidic emulsions, legume protein, protein concentration, ionic strength, 25
microstructure.
26
1. Introduction 27
In the time being, the consumer demands originated from health concerns, allergenicity,
28
religious limitations (Halal) and rising trend of vegetarianism have increased the interest of
29
food industry in use of functional plant proteins as alternative to animal proteins (Aydemir &
30
Yemenicioglu, 2013; Carbonaro, Maselli, & Nucara, 2014). The production of plant protein
31
isolates is of growing interest to industry because of the increasing applications of plant
32
proteins in food and non-food markets (Zhang, Bo, Wanmeng, & Zhang, 2009). Nevertheless,
33
these applications in the food trade are almost limited to proteins from soybean and wheat,
34
whereas other vegetable proteins are available and less used. Thus, searchers, food
35
manufacturers and consumers are looking for alternative protein sources (Boye et al., 2010;
36
Taherian et al., 2011; Toews & Wang, 2013; Liang & Tang, 2014; Shen & Tang, 2014).
37
Among these are those from dry legumes that are extensively grown in different parts of the
38
world and, in particular, in the Mediterranean region.
39
There is increased interest in legume proteins as they can be used as good substitute for
40
animal and soybean proteins (Zhang et al., 2009; Joshi et al., 2012; Liang & Tang, 2014; Shen
41
and Tang, 2014). In this regard, the understanding of factors affecting the functional
42
properties of legume proteins enables better control of these properties, which will facilitate
43
the novel application of these proteins. The functional properties such as solubility, water and
44
oil absorption capacity, gelation, foam and emulsion formation of legume protein isolates
45
were studied to some extent previously (Makri, Papalamprou, & Doxastakis, 2005; Boye et
M
AN
US
CR
IP
T
AC
CE
PT
ED
al., 2010; Aydemir & Yemenicioglu, 2013). However, there is lack of fundamental knowledge
47
and supporting data on the emulsifying properties of legumes proteins. Particularly, studies on
48
emulsifying properties of legumes protein, taking into account, protein concentration, pH,
49
ionic strength and relationship between structure and functionality are scarce.
50
In general, the emulsifying properties of plant proteins are dependent on the physicochemical
51
properties of proteins, including, composition (e.g. vicilin/legume ratio), solubility,
52
conformational stability and Hydrophobicity (Lestari, Mulder, & Sanders, 2011; Kaushal,
53
Kumar, & Sharma, 2012; Liang & Tang, 2014). Also, environmental conditions, including,
54
pH, ionic strength, protein concentration and oil fraction have an effect (Yu, Ahmedna &
55
GoktepeIpek, 2007; Liang & Tang, 2014).
56
Our previous study (Ladjal E., Boudries, Chibane & Romero, 2015) demonstrated that legume
57
protein isolates have good emulsifying ability and stability at pH 3; suggesting their use in
58
acidic formulation, such as, salad dressing and mayonnaise. Thus, the present study is aimed
59
to investigate the effect of protein concentration and ionic strength on emulsifying properties
60
of protein stabilized emulsions at pH 3 using protein isolates derived from three legumes (pea,
61
chickpea and lentil). The microstructure of the selected emulsions is also studied.
62
2. Material and method 63
2.1. Preparation of legume protein isolates
64
Whole flours of pea (Pisum sativum), chickpea (Cicer arietinum) and lentil (Lens culinaris)
65
were prepared as previously (Ladjal & Chibane, 2015). Legume protein isolates was prepared
66
according to the method of Papalamprou, Doxastakis & Kiosseoglou (2010) with slight
67
modification. In brief, flour (100 g) was mixed with distilled water at a 1:10 ratio (w/v),
68
adjusted to pH 8.0 using 1 M NaOH and stirred at 500 rpm for 45 min at room temperature
69
(20–22 °C). The suspension was then centrifuged at 4,500×g for 20 min at 4 °C to collect the
70
supernatant. The resulting pellet was re-suspended in distilled water at a ratio of 1:5 (w/v),
M
AN
US
CR
IP
T
AC
CE
PT
ED
adjusted to pH 8.0, stirred for an additional 45 min, followed by centrifugation (4500×g, 20
72
min, 4 °C). Both supernatants were pooled and adjusted to pH=4.0 (pea) or pH=4.5 (chickpea
73
and lentil) using 0.1 M HCl to precipitate the protein. The protein was recovered by
74
centrifugation and collected (Karaca, Low, and Nickerson, 2011). The pH adjustment values
75
are deduced from our previous study on the protein solubility (Ladjal & Chibane, 2015).The
76
obtained precipitate was washed twice with distilled water (4°C) and re-dispersed in distilled
77
water with pH adjusted to pH 7 with 1M NaOH, and freeze-dried (Boye et al., 2010). The
78
protein contents were determined in quadruplicate as %N x 6.25 using a Leco CHNS-932
79
nitrogen micro analyser (Leco Corporation, St. Joseph, MI, USA) (Etheridge, Pesti, & Foster,
80
1998). Their protein contents were 85.7±0.6%, 85.9±0.2% and 84.8±0.1% (fresh matter) for
81
pea protein (PP), chickpea protein (CP) and lentil protein (LP), respectively.
82
2.3. Emulsions preparation
83
Three protein solutions with a different protein concentration (0.5 - 2%, w/v) were prepared at
84
pH adjusted to 3, stirred using a magnetic stirrer for 2 h at room temperature and, then, stored
85
overnight at 4 °C to allow complete hydration. Each protein solution or dispersion was mixed
86
with sunflower oil at oil fraction (ø) = 0.1, and pre-homogenized using the high-speed
87
dispersing and emulsifying unit (model IKA-ULTRA-TURRAX- T25 basic, IKA Works,
88
Inc., Germany) at 17,000 rpm for 1 min. Then, the pre-homogenized dispersions were further
89
homogenized by a high pressing emulsificator (Emulsiflex-C5, Canada) for one pass at a
90
pressure level of 40 MPa. To investigate the effect of ionic strength, we used the same
91
parameters with protein concentration of 1.5% and the salt concentration (salt dissolved in
92
deionised water) varied from 0 mM to 200 mM of NaCl. The fresh emulsions were stored for
93
various periods of time (e.g., 24 h) prior to further analysis. All other materials and chemicals
94
used were purchased from regular suppliers and were of analytical grade.
95
2.4. Emulsions characterization
M
AN
US
CR
IP
T
AC
CE
PT
ED
Droplet-size distribution (d4,3), flocculation and coalescence indices (FI and CI) as well as
97
creaming indices of prepared emulsions were evaluated as reported by Liang & Tang (2013).
98
2.5. Emulsion microstructure
99
The microstructure of the selected emulsions was determined by means of confocal scanning
100
laser microscopy a ZEISS LSM 7 DUO (Germany). A small aliquot of freshly prepared
101
emulsion was placed on a microscope slide and covered with a cover slip prior to analysis.
102
Emulsions were colored by Nile bleu. The emission of Nile bleu was detected in the 633 nm).
103
This technique provides images of dark fat droplets and a bright water phase where proteins
104
were found. a 63x objective was used. The microstructure images were analyzed using image
105
analysis software (ZEN_2012SP1_black_SP2_blue).
106
2.6.Statistical analysis
107
Statistical analysis was carried out using analysis of variance (ANOVA) and the significant
108
difference between the samples was determined using LSD test at p < 0.05.
109
3. Result and discussion 110
3.1. Effect of protein concentration on emulsifying properties
111
3.1.1. Droplet size distribution
112
The effects of protein concentration on emulsifying properties were measured at pH 3.0 and
113
an oil fraction of 0.1, at various protein concentrations (0.5, 1, 1.5 and 2%, (w/v)). The d4,3 of
114
the droplets, diluted in 1% SDS or deionized water, was calculated and summarized in Table
115
1. In general, the smaller the droplet sizes of protein-stabilized emulsions, the better the
116
emulsifying ability of the protein is (Shen & Tang, 2014).
117
Generally, with the exception of PP-stabilized emulsions, CP and LP-stabilized emulsions
118
exhibited the best emulsifying ability (corresponding to the lowest diameter) at 2%
M
AN
US
CR
IP
T
AC
CE
PT
ED
concentration. But the other concentrations did not display significant difference in their
120
emulsifying ability. This trend was noted both in SDS and water dilutions. For PP emulsion,
121
the smallest droplet size was found at 1.5% in water dilution and at 1% and 1.5% in SDS
122
dilution. From this concentration, there was a slight increase in droplets size indicating an
123
excess of non adsorbing protein which promote droplets flocculation by depletion
124
phenomenon. The high d4,3 values of the emulsions containing 0.5% protein suggested that 125
protein content may not be enough to cover the oil droplets and form sufficiently dense
126
adsorption layer (Sanchez and Patino, 2005). As a result, protein acted as bridges among the
127
oil droplets and led to droplets aggregation (Sun and Gunasekaran, 2009; Guo & Mu, 2011).
128
Our results are in agreement with those reported by Sun and Gunasekaran (2009), and
129
corroborate well with those of Joshi et al. (2012), which suggest that the higher the protein
130
concentration (lentil protein), the greater was the reduction in interfacial tension, displaying
131
stabilized emulsion with high turbidity and small oil droplet.
132
3.1.2. Flocculation in fresh emulsions
133
The flocculated state of oil droplets was evaluated in terms of flocculation index (FI), as
134
shown in Table 1. The FI (0h) varied with type and concentration of protein. Basically, the FI
135
(0h) varied considerably from 0.88 in 1.5% LP emulsion to 3.72 in 1% PP emulsion.
PP-136
stabilized emulsion exhibited the lowest FI (1.19) at 2% concentration. Whereas, 1.5%
137
concentrations displayed the lowest FI in CP and LP emulsions (1.82 and 0.88 respectively).
138
At any concentration (except to 2% PP emulsion), LP-stabilized emulsions exhibited lower
139
flocculation phenomenon than PP and CP emulsions, which might be due to its lower content
140
of SH and SS bounds (Ladjal E. et al., 2015). Thus, SH groups can form bridge and enhance
141
droplets flocculation. In general, FI% progressively decreased to a minimal value, as the
142
concentration increased from 0.5 to 1.5%, while a further increase in concentration (2%)
143
contrarily led to a gradual increase in FI%. An increase in protein concentration enhanced
M
AN
US
CR
IP
T
AC
CE
PT
ED
protein adsorption and surface coverage of oil droplets, which effectively inhibited droplet
145
aggregation (Sun and Gunasekaran, 2009). However, further increase in protein concentration
146
(up to 1.5% in our case), could promote depletion flocculation. Interestingly, protein
147
stabilized emulsions showed low FI at 1.5% concentration, suggesting that the oil–water
148
interface is saturated by protein molecules. Joshi and collaborators (2012) suggest a
149
concentration of 1% as interface saturation point in lentil protein stabilized emulsion with oil
150
fraction of 10%. According to Liang and Tang (2014), the flocculated state of droplets
151
displayed inverse trend in pea proteins stabilized emulsions, where FI% progressively
152
increased up to a maximal value, as the concentration increased from 0.25 to 1.0 g/100ml,
153
while a further increase in concentration contrarily led to a gradual decrease in FI%.
154
3.1.3. Flocculation and coalescence stability
155
Emulsions are inclined to break down over time through a variety of physicochemical
156
mechanisms, including gravitational separation, flocculation, coalescence and Ostwald
157
ripening. The stability of various emulsions formed at various concentrations upon storage of
158
24 h was evaluated in terms of flocculation (FI) and coalescence indexes (CI).
159
The FI (24h) varied with concentration and type of proteins. PP-stabilized emulsion exhibited
160
high FI at 0.5 and 1.0% concentration, and low FI at 1.5 and 2% concentrations. In the
161
contrary, CP emulsion showed high flocculation index at 2% concentration, but the other
162
concentration displayed low values. In the case of LP emulsion, the FI decreased when
163
concentration increased to reach the minimal value at 2.0% concentration.
164
Regarding coalescence, there was also great variation in the results, depending to the type and
165
concentration of protein. CI% values diverged from 2.98% in 1.5% LP emulsion to 46.51% in
166
2% LP emulsion. PP-stabilized emulsions showed low CI at 0.5% and 2% concentrations,
167
while CI was more or less high at 1% and 1.5% concentrations respectively. In the case of CP
168
emulsions, the lowest CI value was obtained at 1.5% concentration, and the highest value was
M
AN
US
CR
IP
T
AC
CE
PT
ED
obtained at 0.5% concentration. Differently, LP-stabilized emulsions displayed very low CI at
170
0.5% and 1.5% concentrations, and high values at 1% and 2% concentrations. Basically,
171
protein-stabilized emulsions showed good emulsifying stability at 1.5% and 2%
172
concentrations.
173
This divergence between protein emulsification behaviors might be due to the difference in
174
physicochemical properties, such as, molecular weight, hydrophobicity, free SH and SS
175
bounds as determined previously (Ladjal E. et al., 2015). Clearly, LP-stabilized emulsions are
176
the most stable comparing to the others. According to our results, the underlying mechanism
177
for emulsion instability was by means of droplet flocculation and coalescence. Stable
178
emulsions can be prepared when the interface is completely covered with particles. However,
179
upon insufficient loading of the interface, droplet coalescence cannot be fully prevented, and
180
partial coalescence may take place (Scholten, Moschakis, & Biliaderis, 2014). The thickness
181
of the interfacial layer determines the magnitude and range of the steric repulsion between
182
droplets. Droplet flocculation can be inhibited if the range of the steric repulsion is longer
183
than the range of any attractive interactions, such as van der Waals or hydrophobic (Chung &
184
McClements, 2014). Hence, emulsion stability at high protein concentration can be attributed
185
to the formation of multilayered protein shell around oil droplet which successfully prevents
186
the coalescence of oil droplets Joshi et al. (2012).
187
3.1.4. Creaming stability
188
The creaming index of the three protein emulsions at different protein concentrations, upon
189
quiescent storage up to 7 days was investigated. As expected, various emulsions showed
190
different creaming behaviors, depending on the type of proteins and the applied concentration.
191
Clearly, for any emulsion at 0.5% concentration, the creaming index was the highest. It
192
increased with storage to reach the maximum values on the 7th day. It should be noted that
M
AN
US
CR
IP
T
AC
CE
PT
ED
there was no creaming in 2% CP emulsion and 1.5% and 2% LP emulsion even after 7 days of
194
storage. In the contrary, low concentration (0.5%) displayed clear creaming even after one
195
day of storage (in the case of PP and LP emulsions).
196
These observations indicated that increasing the concentration progressively improved the
197
creaming stability of these emulsions. The improvement of the creaming stability could be in
198
part due to the progressive decreases in d4,3 (water dilution; Table 1). A similar improvement
199
of creaming stability upon increasing protein concentration has been observed for emulsions
200
stabilized by pea proteins (Liang and Tang, 2014). Higher protein concentration lowered
201
creaming rate possibly due to the unadsorbed protein in the aqueous phase which increase the
202
viscosity (Sun and Gunasekaran, 2009). Hence, higher protein concentration may facilitate the
203
adsorption of protein to the interface of oil droplets, slightly increase their density, and
204
consequently prevent gravitational separation (Piorkowski and McClements, 2013). In
205
addition, increasing protein concentration enhanced the surface coverage of oil droplets
206
against flocculation and reduced the scope for protein bridging, leading to decreased creaming
207
(Sun and Gunasekaran, 2009).
208
For each system, there is a critical concentration of proteins, above which the droplet size and
209
emulsion stability, may be independent of concentration (at constant oil fraction). Under the
210
investigated conditions of the present work, and taking into account emulsifying ability and
211
stability, we can approximately see that this critical concentration was about 1.5%.
212
3.2. Effects of ionic strength on emulsifying properties
213
Another factor that plays a role in protein-emulsifying properties is salt presence. NaCl affects
214
the protein-emulsifying properties mainly by two mechanisms: (1) salts reduce the
215
electrostatic repulsion between droplets through electrostatic screening and (2) high
216
concentrations of electrolytes alter the structural organization of water molecules, which alters
217
the strength of the hydrophobic interactions between non-polar groups (Zhang et al., 2009).
M
AN
US
CR
IP
T
AC
CE
PT
ED
To investigate the effect of ionic strength on emulsifying properties of pea, chickpea and lentil
219
protein, we fixed the same parameters (pH 3, oil fraction 0.1) using the critical protein
220
concentration (1.5%), and then we tested different ionic strengths (0- 200 mM).
221
3.2.1. Droplet size distribution
222
Emulsifying properties of various legume proteins (PP, CP and LP) at different ionic strength
223
(0, 50, 100, 150 and 200 Mm NaCl) were evaluated at pH 3, protein concentration of 1.5%
224
and an oil fraction of 0.1 using droplet-size analysis. The d4,3 of the droplets, diluted in 1%
225
SDS or deionized water, was calculated and summarized in Table 2.
226
Emulsions were highly sensitive to changes in ionic strength. Although the particle size in
227
SDS dilution was approximately in the same range (ranging from ≈ 1.5 and 4 µm), the mean
228
particle diameter in water dilution significantly increased with NaCl addition, indicating that
229
salt addition promoted droplet aggregation without affecting the initial droplet size. At ionic
230
strength of 0 and 50 mM, the particle diameter of emulsions remained relatively small and
231
emulsions were more stable against aggregation. At relatively high ionic strength (≥100 mM),
232
emulsions were instable manifesting droplet aggregation, maintaining relatively small droplet
233
sizes in SDS dilution. The large diameter in water dilutions, at high ionic strength, is due to
234
the screening of the surface charges that encouraged protein–protein interaction, but,
235
however, reduced protein–oil interaction (Zhang et al., 2009). The most likely stabilization
236
mechanism preventing droplet aggregation of protein stabilized emulsion is, hence,
237
electrostatic repulsion (Joye and McClements, 2014). For example, at pH 3, the droplets had a
238
high net charge, which would generate a strong electrostatic repulsion that prevents droplet
239
aggregation. By increasing the ionic strength, the net charge on the droplets is decreased and
240
the proteins tend to aggregate (solubility decrease), as a result, emulsion is destabilized by
241
flocculation (Joye and McClements, 2014).
242
3.2.2. Flocculation in fresh emulsions
M
AN
US
CR
IP
T
AC
CE
PT
ED
High flocculation was observed even though droplet size distribution (SDS dilution at 0h) was
244
not clearly affected by ionic strength. All emulsions were destabilized by salt addition and
245
displayed extensive aggregation behavior expressed as FI (0h). FI (0h) values varied from
246
0.88 to 7.09 in 0 mM LP and 200 mM CP-stabilized emulsions, respectively. Basically, the
247
higher the ionic strength, the higher the FI is. Where, low ionic strength exhibited the lowest
248
FI and vice versa. Interestingly, there was a positive correlation between ionic strength and FI
249
(0h). Flocculation is due to “electrostatic screening” phenomenon, which occurs when the
250
ionic strength of the aqueous phase is increased (Piorkowski and McClements, 2013) (i.e. the
251
accumulation of counter-ions around the surfaces, Salminen and Weiss, 2014). Inducing the
252
neutralization of the protein external charge, as a result, the electrostatic repulsions will be
253
reduced, encouraging the protein aggregation.
254
3.2.3. Flocculation and coalescence stability
255
Regarding results in Table 2, it can be seen that, after 24h of storage, the flocculation
256
increased with ionic strength increase. An extensive flocculation (FI, 24h) was observed at
257
high ionic strengths. Markedly, for the three protein emulsions, the FI increased with ionic
258
strength increase, to reach the maximal values at 150 mM of ionic strength. This finding
259
corroborate with Joye and McClements (2014)’s suggestions, indicating that by increasing the
260
ionic strength, the net charge on the droplets is shielded or decreased and the emulsion is
261
destabilized by flocculation.
262
The coalescence phenomenon also was determined as coalescence index (CI %) (Table 2).
263
For example, CI% was ranging from 2.88% to 156 % in 0 mM LP and 200 mM CP
264
emulsions, respectively. For any emulsion, the highest CI% was found at the highest ionic
265
strength (200 mM). It is well known that, coalescence rate can be reduced if the protein, in
266
addition to decreasing the interfacial tension, can form a film with good viscoelastic
267
properties in the oil–water interface, to resist droplet-droplet collision (Lestari et al., 2011).
M
AN
US
CR
IP
T
AC
CE
PT
ED
Based on our results, we can deduce that, at high ionic strength, legume proteins form films
269
with insufficient steric repulsion and weak viscoelastic properties at the interface, which
270
accelerate emulsion destabilization.
271
3.2.4. Creaming stability
272
Table 3 shows the creaming index of the three protein emulsions at different ionic strengths
273
(from 0 to 200 mM), upon quiescent storage up to 7 days. As expected, emulsions showed
274
different creaming behaviors, depending to the type of proteins and the applied ionic strength.
275
Clearly, for any emulsion, the creaming index increase when the ionic strength increase. It
276
increased with storage to reach the maximum values on the 7th day. Interestingly, creaming
277
was the lowest at the lowest ionic strength (0 and 50 mM). LP emulsions exhibited the most
278
stable state comparing to PP and CP stabilized emulsion. The ability of an emulsion to resist
279
creaming is highly dependent on the droplet size, density difference between the dispersed
280
and continuous phases, and the viscosity of the continuous phase. Emulsions with smaller
281
droplets, a lower density contrast between phases, and higher viscosity are more stable to
282
creaming (Karaca et al., 2011).
283
As reported in Joshi et al. (2012), low salt concentrations enhance solubility because hydrated
284
salt ions especially the anions weakly bind to the charged group of proteins. This phenomenon
285
is known by “the salting-in effect” of proteins resulting into high solubility in the presence of
286
low concentration of salt (Yuliana, Truong, Huynh, Ho, & Ju, 2014). At low concentrations,
287
salts can stabilize proteins through non specific electrostatic interactions, dependent only on
288
the ionic strength of the medium (Hamada, Arakawa, & Shiraki, 2009), and the increased
289
solubility of proteins comes from the water bound with the ions (Joshi et al., 2012). However,
290
at high concentrations, salts exert specific effects on proteins depending on the type and
291
concentration of the salts (Molina-Bolivar, Galisteo-Gonzalez, & Hidalgo-Alvarez, 2001;
292
Hamada et al., 2009). When NaCl concentration increase (above 0.15 mM), it can rather
M
AN
US
CR
IP
T
AC
CE
PT
ED
reduce the protein solubility (Joshi et al., 2012). Since, the monovalent Na+ ions are
294
counterions for the negatively charged protein molecules, whereas the monovalent Cl- ions are
295
counterions for the positively charged (Rao, Chen, & Chen, 2009), leading to a decrease in
296
electrostatic repulsion, thus enhancing hydrophobic interactions (Yuliana et al., 2014). When
297
net charge of protein molecules is screened sufficiently, molecules will be able to approach
298
closely enough together to aggregate (Chantrapornchai and McClements, 2002). This can be
299
also attributed to the increase of interfacial tension between the protein surface and bulk
300
solvent (Hamada et al., 2009). In the other hand, the decrease in emulsion stability at high
301
ionic strengths can be attributed also to the hydration of adsorbed counterions (Fisicaro,
302
Compari, & Braibanti, 2011). This phenomenon is known by “the salting-out effect”. Proteins
303
can interact with water through hydrogen bonding with greater or comparable strength to
304
water-water interactions. This is because the water molecules prefer to form strong hydrogen
305
bonds with the ions instead of weaker bonds with the hydrated biopolymers (proteins)
306
(Salminen and Weiss, 2014). This promotes protein–protein interaction and protein aggregate
307
formation, which ultimately results into slow diffusion of protein molecules into oil-water
308
interface at high salt concentration (Joshi et al., 2012). Furthermore, it has also been
309
suggested that salt at its high concentrations can compete with protein for water to ionize
310
itself. This competition effectively reduces the availability of water and increases the protein
311
dehydration (Joshi et al., 2012). When the hydration repulsion becomes negligible compared
312
with the van der Waals attraction, the particles will aggregate (Salminen and Weiss, 2014),
313
encouraging creaming.
314
Likewise, the ionic strength has an effect on protein hydrophobicity. Zhang and co-workers
315
(2009) reported that the emulsifying activity and hydrophobicity of chickpea proteins take the
316
same trend as function of ionic strength; they decrease first and then increase with the
317
increase of ionic strength, the lowest values (both parameters) occurred at ionic strength
M
AN
US
CR
IP
T
AC
CE
PT
ED
0.1M. The ionic strength seems also to have an effect on the conformational structure of
319
legume proteins (Zhang et al., 2009).
320
Under the investigated conditions of the present work, and taking into account emulsifying
321
ability and stability, we can approximately see that the critical ionic strength was in the range
322
of 0-50 mM NaCl.
323
3.2.5. Emulsion microstructure
324
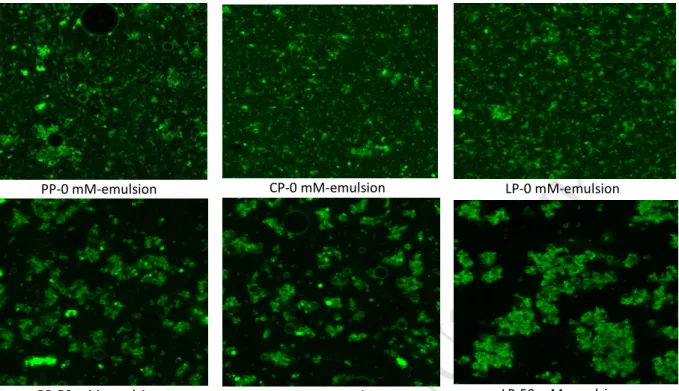
According to the results of emulsifying properties of the investigated emulsions, we selected
325
two emulsions for each protein; 0 mM and 50 mM NaCl (at 1.5% protein concentration). Fig.
326
1 shows the CLSM microstructural observations of various fresh emulsions formed at 0 mM
327
and 50 mM of NaCl. Proteins are stained in green and oil droplets appear as dark bubbles.
328
In emulsions at 0 mM, it can be observed that most of the droplets were present in the
329
separated and unflocculated form. However, in emulsions with 50 mM NaCl, droplets were in
330
flocculated state. The results confirmed that emulsions at 0 mM were stable to aggregation,
331
however, emulsions at 50 mM showed even bigger aggregates. This can be explained by the
332
electrostatic screening and dehydration effects of ionic strength on proteins, thus increasing
333
the attractive interactions of protein-protein as detailed above. Herein, these results evidence
334
that emulsions instability in presence of salt was related to protein aggregation, leading to
335
physical separation (coalescence and creaming). It should be noted that LP-stabilized
336
emulsion was more sensitive to ionic strength, showing intensive aggregation at 50 mM of
337
NaCl. Our results are in agreement with those reported on whey protein stabilized emulsions
338
containing various concentrations of CaCl2 (Ye and Singh, 2000). Equally, Shao &Tang 339
(2014) reported the same remark about the effect of NaCl on the microstructure of soy
340
protein-stabilized emulsions.
341
4.Conclusion 342
M
AN
US
CR
IP
T
AC
CE
PT
ED
This study confirms that, at pH 3, protein concentration and ionic strength (sodium chloride)
343
have a major influence on the characteristics of legume protein-stabilized emulsions,
344
including, droplet size distribution, flocculation, coalescence creaming and microstructure.
345
Basically, it was found that 1.5 % (w/v) of protein and 0 mM to < 50 mM of NaCl are the best
346
conditions to produce stable emulsions with legume proteins. It should be noted that high
347
ionic strength (≥50 mM) promotes flocculation and accelerates destabilization of legume
348
protein emulsions, whilst, high protein concentration improves their stability. Our results
349
suggest the use of these proteins as emulsifiers in acid food formulation, such as, mayonnaise
350
and salad dressing.
351
Acknowledgments 352
The authors wish to thank Béjaia University and the Universidad de Seville for the valorous
353
technical support. The authors acknowledge also to the Microscopy Service
(CITIUS-354
Universidad de Sevilla) for providing full access and assistance.
355
References 356
Aydemir, L. Y., & Yemenicioglu, A. (2013). Potential of Turkish Kabuli type chickpea and
357
green and red lentil cultivars as source of soy and animal origin functional protein
358
alternatives. LWT - Food Science and Technology, 50, 686-694.
359
Boye, J.I., Aksay, S., Roufik, S., Ribéreau, S., Mondor, M., Farnworth, E., & Rajamohamed
360
S.H. (2010). Comparison of the functional properties of pea, chickpea and lentil protein
361
concentrates processed using ultrafiltration and isoelectric precipitation techniques.
362
Food Research International, 43(2), 537-546.
363
Carbonaro, M., Maselli, P., & Nucara, A. (2014). Structural aspects of legume proteins and
364
nutraceutical properties. Food Research International.
365
http://dx.doi.org/10.1016/j.foodres.2014.11.007.
M
AN
US
CR
IP
T
AC
CE
PT
ED
Chantrapornchai, W., and McClements, D. J. (2002). Influence of NaCl on optical properties,
367
large strain rheology and water holding capacity of heat induced whey protein isolates
368
gels. Food Hydrocolloids, 16, 467-476.
369
Chung, C. & McClements, D.J. (2014). Structure-function relationships in food emulsions:
370
Improving food quality and sensory perception. Food Structure, 1, 106-126.
371
Etheridge, R. D, Pesti, G. M., & Foster, E. H. (1998). A comparison of nitrogen values
372
obtained utilizing the Kjeldahl and Dumas combustion methodologies (Leco CNS) on
373
samples typical of an animal nutrition analytical laboratory. Animal Feed Science and
374
Technology, 73, 21-23.
375
Fisicaro, E., Compari, C., & Braibanti, A. (2011). Hydrophobic hydration processes: thermal
376
and chemical denaturation of proteins. Biophysical Chemistry, 156,51-67.
377
Guo, Q., & Mu, T.H. (2011). Emulsifying properties of sweet potato protein: Effect of protein
378
concentration and oil volume fraction. Food Hydrocolloids, 25, 98-106.
379
Hamada, H., Arakawa, T., & Shiraki, K. (2009). Effect of Additives on Protein Aggregation.
380
Current Pharmaceutical Biotechnology, 10, 400-407.
381
Joshi, M., Adhikari, B., Aldred, P., Panozzo, J.F., Kasapis, S., & Barrow, C.J. (2012).
382
Interfacial and emulsifying properties of lentil protein isolate. Food Chemistry, 134,
383
1343–1353.
384
Joye, I. J., & McClements, D. J. (2014). Emulsifying and Emulsion-Stabilizing Properties of
385
Gluten Hydrolysates. Journal of Agricultural and Food Chemistry, 62, 2623-2630
M
AN
US
CR
IP
T
AC
CE
PT
ED
Karaca, A. C., Low, N., & Nickerson, M. (2011). Emulsifying properties of chickpea, faba
387
bean, lentil and pea proteins produced by isoelectric precipitation and salt extraction.
388
Food Research International, 44, 2742–2750.
389
Kaushal, P., Kumar, V., & Sharma, H.K. (2012). Comparative study of physicochemical,
390
functional, antinutritional and pasting properties of taro (Colocasiaesculenta), rice
391
(Oryza sativa) flour, pigeonpea (Cajanuscajan) flour and their blends. LWT - Food
392
Science and Technology, 48 (1), 59-68.
393
Ladjal, E. Y., & Chibane, M. (2015). Some physicochemical and functional properties of pea,
394
chickpea and lentil whole flours. International food research journal, 22(3), 987-996.
395
Ladjal, E. Y., Boudries, H., Chibane, M. & Romero, A. (2015). Pea, chickpea and lentil
396
protein isolates: Physicochemical characterization and emulsifying properties. Food
397
Biophysics. Accepted manuscript. http://dx.doi.org/10.1007/s11483-015-9411-6.
398
Lestari, D., Mulderb, W. J., & Sanders, J. P.M. (2011). Jatropha seed protein functional
399
properties for technical applications. Biochemical Engineering Journal, 53, 297-304.
400
Liang, H.-N., & Tang, C.-H. (2013). pH-dependent emulsifying properties of pea
401
[Pisumsativum (L.)] proteins. Food Hydrocolloids, 33, 309-319.
402
Liang, H.-N., & Tang, C.-H. (2014). Pea protein exhibits a novel Pickering stabilization for
403
oil-in-water emulsions at pH 3.0. LWT - Food Science and Technology, 58, 463-469.
404
Makri, E., Papalamprou, E., & Doxastakis, G. (2005). Study of functional properties of seed
405
storage proteins from indigenous European legume crops (lupin, pea, broad bean) in
406
admixture with polysaccharides. Food Hydrocolloids, 19, 583–594.
M
AN
US
CR
IP
T
AC
CE
PT
ED
Molina-Bolivar, J.A., Galisteo-Gonzalez, F., & Hidalgo-Alvarez R. (2001). Specific cation
408
adsorption on protein-covered particles and its influence on colloidal stability. Colloids
409
and Surfaces B: Biointerfaces, 21, 125–135.
410
Papalamprou, E.M., Doxastakis, G. I., & Kiosseoglou, V. (2010). Chickpea protein isolates
411
obtained by wet extraction as emulsifying agents. Journal of the Science of Food and
412
Agriculture, 90(2), 304–313.
413
Piorkowski, D. T., & McClements, D. J. (2013). Beverage emulsions: Recent developments in
414
formulation, production, and applications: Review. Food Hydrocolloids, 1-37.
415
http://dx.doi.org/10.1016/j.foodhyd.2013.07.009.
416
Rao, J.-J., Chen, Z.-M., & Chen, B.-C. (2009). Modulation and stabilization of silk
fibroin-417
coated oil-in-water emulsions. Food Technology and Biotechnology, 47 (4), 413–420.
418
Salminen, H., & Weiss, J. (2014). Electrostatic adsorption and stability of whey protein-pectin
419
complexes on emulsion interfaces. Food Hydrocolloids, 35, 410-419.
420
Sanchez, C. C., & Patino, J. M. R. (2005). Interfacial, foaming and emulsifying characteristics
421
of sodium caseinate as influenced by protein concentration in solution. Food
422
Hydrocolloids, 19, 407-416.
423
Scholten, E., Moschakis, T., & Biliaderis, C. G. (2014). Biopolymer composites for
424
engineering food structures to control product functionality. Food Structure, 1, 39-54.
425
Shao, Y., & Tang, C.-H. (2014). Characteristics and oxidative stability of soy
protein-426
stabilized oil-in-water emulsions: Influence of ionic strength and heat pretreatment.
427
Food Hydrocolloids, 37, 149-158.
M
AN
US
CR
IP
T
AC
CE
PT
ED
Shen, L., & Tang, C.-H. (2014). Emulsifying properties of vicilins: Dependence on the
429
protein type and concentration. Food Hydrocolloids, 36, 278-286.
430
Sun, C., & Gunasekaran, S. (2009). Effects of protein concentration and oil-phase volume
431
fraction on the stability and rheology of menhaden oil-in-water emulsions stabilized by
432
whey protein isolate with xanthan gum. Food Hydrocolloids, 23, 165–174.
433
Taherian, A. R., Mondor, M., Labranche, J., Drolet, H., Ippersiel, D., & Lamarche, F. (2011).
434
Comparative study of functional properties of commercial and membrane processed
435
yellow pea protein isolates. Food Research International, 44, 2505–2514.
436
Toews, R., & Wang, N. (2013). Physicochemical and functional properties of protein
437
concentrates from pulses. Food Research International, 52, 445-451.
438
Ye, A., & Singh, H. (2000). Influence of calcium chloride addition on the properties of
439
emulsions stabilized by whey protein concentrate. Food Hydrocolloids, 14, 337–346.
440
Yu, J., Ahmedna, M., & Goktepe, I. (2007). Peanut protein concentrate: Production and
441
functional properties as affected by processing. Food Chemistry, 103, 121-129.
442
Yuliana, M., Truong, C. T., Huynh, L. H., Ho, Q. P., & Ju Y.-H. (2014). Isolation and
443
characterization of protein isolated from defatted cashew nut shell: Influence of pH and
444
NaCl on solubility and functional properties. LWT - Food Science and Technology, 55,
445
621-626.
446
Zhang, T., Bo, J., Wanmeng, M., & Zhang, W. (2009). Emulsifying properties of chickpea
447
protein isolates: Influence of pH and NaCl. Food Hydrocolloids, 23, 146-152.
448
M
AN
US
CR
IP
T
AC
CE
PT
ED
Table 1Emulsion characteristics, including volume-mean droplet size (d4,3), flocculation and coalescence indices (FI
and CI) of legume protein-stabilized emulsions at various protein concentration, freshly prepared or after a storage of 24 h. FI and CI are calculated using mean values of droplet size (d4,3).
E m u ls io n P ro te in % (w / v ) d 4,3 (µm) Indices 0 h 24 h FI CI (%) Water SDS Water SDS 0 h 24h P P e m u ls io n s 0.5 9.10±0.56a 2.69±0.07b 9.94±0.69a 3.00±0.13b 2.38 2.31 11.52 1.0 8.12±0.24b 1.72±0.01d 9.02±0.81ab 1.83±0.01d 3.72 3.40 19.18 1.5 6.14±0.70c 2.06±0.14c 6.22±0.67c 2.61±0.15c 1.98 1.37 27.02 2.0 8.15±0.27b 3.72±0.18a 8.48±0.04b 4.23±0.03a 1.19 1.00 13.70 C P e m u ls io n s 0.5 8.48±0.08a 2.51±0.14a 8.98±0.7a 3.64±0.00a 2.37 1.46 45.01 1.0 8.00±1.85ab 2.75±0.03a 7.50±2.07a 3.56±0.07a 1.91 1.10 29.45 1.5 7.41±0.14ab 2.62±0.29a 8.15±0.25a 2.69±0.17b 1.82 1.92 6.48 2.0 6.83±0.31b 1.97±0.02b 6.96±0.31a 2.24±0.13c 2.46 2.11 13.51 LP e m u ls io n s 0.5 6.69±0.25a 2.85±0.08a 8.94±0.97a 2.98±0.12b 1.34 2.00 4.31 1.0 6.38±0.83a 2.66±0.12b 8.11±0.34a 3.65±0.11a 1.39 1.21 37.46 1.5 5.26±0.20b 2.79±0.13ab 5.59±0.19b 2.87±0.17b 0.88 0.94 2.98 2.0 5.19±0.12b 2.05±0.03c 5.62±0.62b 3.01±0.2b 1.52 0.86 46.51 Values expressed are mean ± standard deviation. Means in the column (in the same protein emulsion) with different superscript are significantly different at p< 0.05. PP: Pea protein; CP: Chickpea protein; LP: Lentil protein.
Table 2
Emulsion characteristics, including volume-mean droplet size (d 4,3), flocculation and coalescence indices (FI
and CI) of legume protein-stabilized emulsions at various ionic strength, freshly prepared or after a storage of 24 h. FI and CI are calculated using mean values of droplet size (d 4,3).
E m u ls io n Ion ic st re n g th (m M N a C l) d 4,3(µm) Indices 0 h 24 h FI CI (%) Water SDS Water SDS 0 h 24 h P P e m u ls io n s 0 6.14±0.70c 2.06±0.14c 6.22±0.67c 2.61±0.15b 1.98 1.37 27.02 50 6.21±0.18c 2.33±0.10c 7.06±0.36c 2.53±0.09b 1.65 1.78 8.55 100 10.48±0.23b 3.58±0.52a 14.86±1.06b 4.20±0.72a 1.82 2.33 20.16 150 13.91±0.62a 2.70±0.04bc 16.44±1.21ab 3.44±0.10ab 4.14 3.77 27.17 200 14.05±0.73a 3.32±0.67 ab 17.19±0.98a 4.72±1.50a 3.06 2.63 36.56 C P e m u ls io n s 0 7.41±0.14d 2.46±0.12 a 8.49±0.33c 2.71±0.15b 2.01 2.13 10.16 50 7.67±0.15cd 1.56±0.11c 8.47±1.23c 2.04±0.09c 3.91 3.14 30.70 100 8.11±0.09c 1.68±0.01c 10.27±2.31bc 2.01±0.07c 3.81 4.10 19.36 150 10.64±0.56b 1.90±0.00b 13.03±3.34b 2.26±0.26c 4.60 4.76 18.94 200 12.70±0.37a 1.57±0.01c 17.83±1.61a 4.03±0.43a 7.09 3.42 156.68 L P e m u l 0 5.26±0.20d 2.79±0.13b 5.59±0.19d 2.87±0.17cd 0.88 0.94 2.86 50 5.61±0.32d 2.95±0.22b 6.78±0.29d 3.41±0.21b 0.89 0.98 15.55
M
AN
US
CR
IP
T
AC
CE
PT
ED
100 9.35±0.62c 4.28±0.10a 11.24±0.71c 5.07±0.20a 1.18 1.21 18.35 150 12.49±0.59b 2.05±0.0c 20.43±1.78b 2.55±0.18d 5.09 7.00 24.55 200 17.13±2.34a 2.31±0.08c 25.09±1.95a 3.23±0.24bc 6.41 6.76 39.82Values expressed are mean ± standard deviation. Means in the column (in the same protein emulsion) with different superscript are significantly different at p< 0.05. PP: Pea protein; CP: Chickpea protein; LP: Lentil protein.
Table 3
Creaming index of various legume protein emulsions formed at various ionic strengths, upon storage up to 7 days. Each data is means of at least duplicate measurements.
Values expressed are mean ± standard deviation. PP: pea protein, CP: chickpea protein and LP: lentil protein. ±: Slight creaming not objectively evaluated; +: clear creaming not objectively evaluated; ND: not determined. Emulsion Ionic strength
(mMNaCl)
Creaming index
1 day 4 days 7 days
PP 0 0.00 24.50±1.50 29 .00±1.00 50 13.33±5.77 25.22±1.34 27.27±2.36 100 26.69±7.84 34.67±2.27 35.47±2.82 150 26.21±3.35 32.20±5.78 33.00±6.45 200 31.92±2.98 37.01±5.92 37.54±5.48 CP 0 ± ± + 50 + 29.00±0.00 34.00±0.00 100 29.00±0.00 29.00±0.00 29.00±0.00 150 30.00±0.00 31.00±0.00 32.00±0.00 200 22.72±3.85 23.63±5.14 23.63±5.14 LP 0 0.0±0.0 0.0±0.0 ND 50 0.0±0.0 0.0±0.0 ND 100 11.87±0.88 16.87±2.65 ND 150 16.31±0.85 20.76±1.08 ND 200 29.86±10.80 36.38±7.45 ND
M
AN
US
CR
IP
T
AC
CE
PT
ED
Figure listPP-0 mM-emulsion CP-0 mM-emulsion LP-0 mM-emulsion
PP-50 mM-emulsion CP-50 mM-emulsion LP-50 mM-emulsion
Fig. 1. CLSM images of legume protein-stabilized emulsions at 0 and 50 mM NaCl. PP: Pea protein, CP: Chickpea protein and LP: Lentil protein.
M
AN
US
CR
IP
T
AC
CE
PT
ED
Highlights• Emulsifying properties of pea, chickpea and lentil protein isolates at pH 3;
• Effect of protein concentration and ionic strength on emulsifying properties of legume proteins at acidic conditions (pH 3).