Introduction
Clusters are aggregates of individuals or a collection of multiple measurements belonging to the same person and which are likely to be correlated. Clusters may be families, schools, communities, universities, or orthodontic practices (Lawrence et al., 2008; Harrison et al., 2010). In orthodontics, a patient’s mouth, jaw, or quadrant may serve as a cluster because it consists of several individual teeth. Additionally, repeated measurements on the same person, as for example in growth assessment via cephalometrics at consecutive time points, may also be considered as clusters since they represent a collection of measurements belonging to the same individual.
In studies using clusters, the outcome is most likely to be more similar within clusters compared to between clusters (Kerry and Bland, 1998a; Hayes and Bennett, 1999). For example, if we are studying the effect of a fluoride on caries, reduction and measurements are collected at different time points, the measurements, at the predetermined time points, within each patient are expected to be more similar
Does published orthodontic research account for clustering
effects during statistical data analysis?
Despina Koletsi*, Nikolaos Pandis**, Argy Polychronopoulou*** and
Theodore Eliades****
*Department of Orthodontics, School of Dentistry, University of Athens, Greece, **Department of Orthodontics and Dentofacial Orthopedics, Dental School/Medical Faculty, University of Bern, Switzerland, ***Department of Community and Preventive Dentistry, School of Dentistry, University of Athens, Greece and ****Department of Orthodontics and Paediatric Dentistry, University of Zurich, Switzerland
Correspondence to: Theodore Eliades, Department of Orthodontics and Paediatirc Dentistry, Center of Dental
Medicine, University of Zurich, Plattenstrasse 11, CH-8032 Zurich, Switzerland. E-mail: [email protected]
SUMMARY In orthodontics, multiple site observations within patients or multiple observations collected at consecutive time points are often encountered. Clustered designs require larger sample sizes compared to individual randomized trials and special statistical analyses that account for the fact that observations within clusters are correlated. It is the purpose of this study to assess to what degree clustering effects are considered during design and data analysis in the three major orthodontic journals. The contents of the most recent 24 issues of the American Journal of Orthodontics and Dentofacial Orthopedics (AJODO), Angle Orthodontist (AO), and European Journal of Orthodontics (EJO) from December 2010 backwards were hand searched. Articles with clustering effects and whether the authors accounted for clustering effects were identified. Additionally, information was collected on: involvement of a statistician, single or multicenter study, number of authors in the publication, geographical area, and statistical significance. From the 1584 articles, after exclusions, 1062 were assessed for clustering effects from which 250 (23.5 per cent) were considered to have clustering effects in the design (kappa = 0.92, 95 per cent CI: 0.67–0.99 for inter rater agreement). From the studies with clustering effects only, 63 (25.20 per cent) had indicated accounting for clustering effects. There was evidence that the studies published in the AO have higher odds of accounting for clustering effects [AO versus AJODO: odds ratio (OR) = 2.17, 95 per cent confidence interval (CI): 1.06–4.43, P = 0.03; EJO versus AJODO: OR = 1.90, 95 per cent CI: 0.84–4.24, non-significant; and EJO versus AO: OR = 1.15, 95 per cent CI: 0.57–2.33, non-significant). The results of this study indicate that only about a quarter of the studies with clustering effects account for this in statistical data analysis.
compared to measurements between study participants. This similarity or correlation of the within participant measurements creates clustering effects that have important implications on the required study sample and data analysis (Kerry and Bland, 1998b; Campbell et al., 2004).
As individuals/observations within clusters are more similar, each observation within a cluster provides less information compared to an observation in a study with no clustering. The result of the reduced information provided by each unit of the cluster is that the required sample size in a clustered design is greater compared to its non-clustered counterpart (Hayes and Bennett, 1999). Additionally, clustered designs require appropriate statistical analyses accounting for the fact that observations within clusters are more similar (Donner, 1982; Campbell and Grimshaw, 1998; Kerry and Bland, 1998; a,b; Donner and Klar, 2000;
Hayes and Moulton, 2009). Failure to account for clustering effects can lead to incorrect inferences (Altman and Bland, 1997; Campbell et al., 2004; Hayes and Moulton, 2009) especially if the interpretation is based solely on P values
(Savitz, 1993; Chia, 1997; Polychronopoulou et al., 2011). We will use an example in order to explain how clustering effects affect statistical inferences. Let us assume that we would like to conduct an randomized controlled trial in order to assess bond failures between two orthodontic adhesives and let us further assume that we randomize 25 patients into adhesive A and 25 patients to adhesive B. In this scenario, each patient is considered as a cluster as he/ she contributes 20 teeth in the study. The total number of teeth per treatment arm will be 500; however, it is an error to disregard the fact that each group of 20 teeth constitutes a cluster (one patient) for whom the bond failures are likely to be correlated. This means that less cooperative participants may have more bracket failures than cooperative patients and by using in the analysis, only individual teeth may potentially hide the fact that failures may be concentrated within certain patients. Therefore, if by chance in one of the adhesive groups less cooperative patients are concentrated, we may wrongly infer that there is a difference in bond failures between adhesives when in fact the increased bond failures are due to fact that one adhesive group includes more of the less cooperative patients.
In general, treating the individual teeth as independent and not accounting for the correlated nature of the data increases the chance of getting significant results, which are not genuine. To understand this, we would like to remind the readers that the basic form of a statistical test is (Kirkwood and Sterne, 2003)
Test statistic = estimate/standard error (d/se), where se = sd/√n, d = estimate, sd is the standard deviation, and √n the square root of n (sample size).
From the above formula, it may be inferred that the larger the sample size the larger the value of the test statistic and it follows that the lower the P value, thus increasing the chance of observing a statistically significant result.
Therefore, if we treat the 1000 teeth as individual observations, then the standard error will become small as the sample size on the denominator increases. However, as explained in clustered designs, each cluster contributes less information and the amount of the information contributed by each cluster is reversely proportional to the within cluster correlation of the observations (Kerry and Bland, 1998c; Hayes and Bennett, 1999; Eldridge et al., 2006). The larger the correlation of the within clusters observations the lower the contribution of each individual tooth to the analysis. As the contribution of each individual tooth decreases so does the effective sample size and again by looking at the test statistic formula with decreasing sample size, standard errors increase resulting in a smaller test statistic and hence larger P values. This way correlated data treated as uncorrelated may give significant results and when treated as correlated may give non-significant results.
From the above, it is obvious that discounting clustering effects may lead to erroneous conclusions especially if conclusions are drawn solely on P values and not on effect estimates and confidence intervals (CIs).
Studies with clustering effects can be analysed at the cluster level, taking the cluster as the unit of analysis or at the individual level accounting for clustering, where analysis is carried out on the observations within a cluster. In the bond failure example, the cluster is the patient and the individual the tooth used to bond a bracket. Analysis at a cluster level is based on the calculation of a summary value per cluster followed by simple statistical tests to compare the effect estimate between treatment arms (Hayes and Moulton, 2009). For variable cluster size, a weighted average for proportions or odds and weighted t-test are available (further details on cluster level analyses with variable cluster size can be found in the following texts:
Donner and Klar, 2000; Hayes and Moulton, 2009). As the analysis is based on cluster summaries, there is some loss of information; analysis at the individual level where the clustered nature of the data is taken into account is generally preferred, providing the number of clusters is reasonable.
Analyses using the individual as the unit of analysis are most commonly undertaken using regression models that adjust for clustering, such as robust standard errors, generalized estimating equations, and random effects (Hayes and Moulton, 2009). In these approaches, analysis is carried out at the individual level taking into account to the clustering present in the data.
To our knowledge, no studies exist in the orthodontic literature, which assess whether clustering effects in orthodontic studies have been considered and accounted for during data analysis.
Therefore, the aim of the present study was to search the orthodontic literature for studies presenting a clustering effect and to identify articles that accounted for those effects during data analysis. Additionally, potential associations between specific study characteristics such as type of study, journal of publication, continent of origin, number of authors, collaboration with an epidemiologist/statistician, single or multicenter involvement, statistical significance of the results, and accounting for clustering effects in data analysis will be explored.
Materials and methods
The following three major orthodontic journals were included in this study: American Journal of Orthodontics and Dentofacial Orthopedics (AJODO), Angle Orthodontist (AO), and European Journal of Orthodontics (EJO). The contents of the most recent 24 issues of each journal from December 2010 backwards were hand searched by the first author in order to identify original research publications in which clustering effects were evident from the methodology reported. Articles were included in the study if they
presented a clustering effect. Editorials, articles evaluating technique description, case reports, and review articles as well as in vitro and animal studies were not considered. Presence of clustering effects was considered when: 1. Multiple measurements at different time points
(repeated measures) were conducted on the same sample or
2. Multiple observations were nested within individuals (i.e. several teeth bonded per individual)
When there was doubt regarding studies included, the second author evaluated the studies and possible disagreements were addressed through discussion and consensus. At the end, the second author assessed 20 per cent of the selected publications to determine whether clustering effects were evident and considered in the data analysis.
The articles were classified as interventional for any human trial (clinical trial or randomized clinical trial) where an experiment/intervention was performed with a control and observational for any cohort, case–control, and cross-sectional study, either prospective or retrospective.
Additional parameters recorded were the following: 1. Statistical significance: if the reported study results for
the main outcome were significant or not (binary). 2. Involvement of a statistician: presence or not (binary).
Collaboration with epidemiologist/statistician was determined mainly by the affiliation information given for the authors.
3. Single or multicenter study (binary): the definition of single or multicentre trial was assessed by the affiliation details and any information given in the materials and methods section, regarding where the study or the data collection was conducted.
4. Number of authors in the publication.
5. Geographical Area: the continent of location of the first author was recorded and three categories were created (Americas, Asia and other, and Europe).
Statistical analysis
Descriptive statistics on the selected article characteristics were calculated. Interater agreement was assessed using the kappa statistic. Univariable and multivariable logistic regression analyses were used to examine the association between the consideration clustering effects (dependent variable) and journal type, continent of authorship, single or multicenter study, number of researchers, and study type (independent variables). Backward elimination (P = 0.2) was applied in order to isolate variables that were important outcome predictors. Statistical significance was set at 0.05. All statistical analyses were conducted with statistical software (Stata 11.1,Statacorp, College Station, Texas, USA).
Results
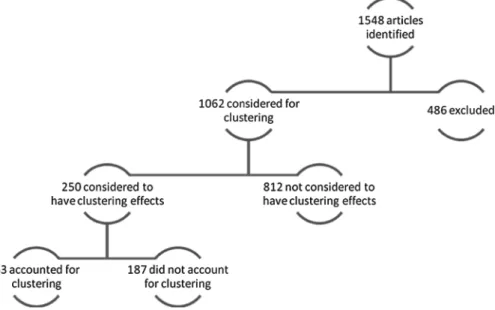
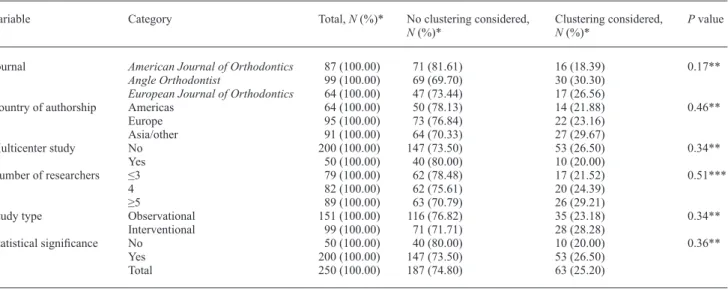
In the three orthodontic journals, 1584 articles were identified. After applying the predefined exclusion criteria, 1062 articles were left for assessment of the presence of clustering effects, from which 250 (23.50 per cent) studies was concluded to have clustering effects and were eventually included in the analyses (Figure 1). The kappa statistic indicated excellent agreement between the two reviewers (kappa = 0.92, 95 per cent CI: 0.67–0.99). Table 1 shows in detail the distribution of studies with clustering effects and whether clustering effects were considered by journal, continent of authorship, type of center (single or multiple),
number of researchers, study type, and reporting of statistical significance result at least for the main study outcome. From the 250 selected studies, only 63 (25.20 per cent) accounted for clustering effects. For journal type, the numbers/percentages of accounting for clustering were as follows: AJODO 16 (18.4 per cent), EJO 17 (26.6 per cent), and AO 30 (30.3 per cent). For continent of authorship, Asia/other had the highest 29.7 per cent for accounting for clustering, followed by Europe (23.2 per cent) and the Americas (21.9 per cent). For single 26.5 per cent and for multicenter 20 per cent of the studies considered clustering in the analysis. The percentage of accounting for clustering effects increased as the number of involved researchers increased; however, the association did not reach statistical significance. Twenty eight per cent of interventional studies accounted for clustering effects and 23.2 per cent of the observational studies. None of the previous associations reached statistical significance.
Table 2 displays frequencies and percentages of the statistical methods used for the selected 250 articles which were considered to have clustering effects in the study design. The highest frequencies were noted for the t-test (36 per cent), mixed models (21.6 per cent), and analysis of variances (ANOVA; 19.6 per cent). It is worth noting that 4.4 per cent of the included studies did not perform statistical analysis.
Table 3 displays frequencies and percentages of the statistical methods used only for the 63 articles, of selected 250 articles, in which the authors accounted for clustering effects during the analysis. Only three types of tests were reported in those articles. The highest frequency was noted
Table 1 Distribution of the 250 orthodontic articles with clustering effects by article characteristic and consideration or not of clustering
effects during the statistical analysis.
Variable Category Total, N (%)* No clustering considered,
N (%)* Clustering considered, N (%)* P value Journal American Journal of Orthodontics 87 (100.00) 71 (81.61) 16 (18.39) 0.17**
Angle Orthodontist 99 (100.00) 69 (69.70) 30 (30.30)
European Journal of Orthodontics 64 (100.00) 47 (73.44) 17 (26.56)
Country of authorship Americas 64 (100.00) 50 (78.13) 14 (21.88) 0.46**
Europe 95 (100.00) 73 (76.84) 22 (23.16) Asia/other 91 (100.00) 64 (70.33) 27 (29.67) Multicenter study No 200 (100.00) 147 (73.50) 53 (26.50) 0.34** Yes 50 (100.00) 40 (80.00) 10 (20.00) Number of researchers ≤3 79 (100.00) 62 (78.48) 17 (21.52) 0.51*** 4 82 (100.00) 62 (75.61) 20 (24.39) ≥5 89 (100.00) 63 (70.79) 26 (29.21)
Study type Observational 151 (100.00) 116 (76.82) 35 (23.18) 0.34**
Interventional 99 (100.00) 71 (71.71) 28 (28.28) Statistical significance No 50 (100.00) 40 (80.00) 10 (20.00) 0.36** Yes 200 (100.00) 147 (73.50) 53 (26.50) Total 250 (100.00) 187 (74.80) 63 (25.20) NS, non-significant. *Row percentage. **Based on chi-square test.
***Based on Kruskal–Wallis rank test.
Table 2 Displays frequencies and percentages of the statistical
methods used for the selected 250 articles which were considered to have clustering effects in the study design.
N (%) ANOVA 49 (19.60) Chi-square 16 (6.40) Correlation 4 (1.60) Linear regression 6 (2.40) Logistic regression 7 (2.80) Mixed models 54 (21.60) No statistics 11 (4.40) Survival 13 (5.20) t-test 90 (36.00) Total 250 (100.00)
Analysis of variance (ANOVA) category includes k-way ANOVA, multiple analysis of variance, and non-parametric ANOVA. Chi-square category includes chi-square, Fisher’s exact test, Homogeneity test, and McNemar’s test. Mixed models category includes mixed models and Friedman/repeated measures ANOVA. No statistics category includes descriptive statistics or nothing reported. Survival category includes Cox regression, Kaplan–Meir, and log-rank tests. T-test category includes independent and paired t-test, non-parametric equivalents (Mann–Whitney, Wilcoxon, and Signed rank tests).
for mixed models (85.72 per cent) and then t-test (7.94 per cent) and ANOVA (6.34 per cent).
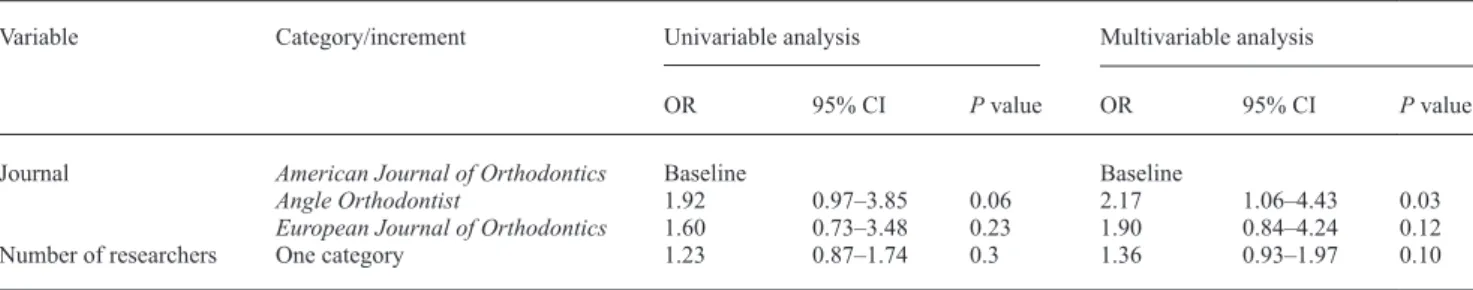
Table 4 depicts the results of the univariable and multivariable model produced after backward elimination, which includes as predictors only journal type and number of researchers. The odds of accounting for clustering and after adjusting for the number of researchers are 117 per cent higher for the AO compared to the AJODO [odds ratio
(OR) = 2.17, 95 per cent CI: 1.06–4.43, P = 0.03] and 90 per cent higher for the EJO versus AJODO (OR = 1.90, 95 per cent CI: 0.84–4.24, P = 0.12). The odds of accounting for clustering and after adjusting for the number of researchers are 15 per cent higher for the EJO compared to the AO (OR = 1.15, 95 per cent CI: 0.57, 2.33, P = 0.4).
Those results show some evidence that studies published in the AO and EJO journal compared to the AJODO are more likely to have accounted for clustering effects during the data analysis.
Discussion
Clustering effects are encountered in orthodontics and in dentistry usually when several site measurements or repeated measurements over time are collected during
Table 3 Displays frequencies and percentages of the statistical
methods used only for the 64 articles, of selected 250 articles, in which the authors accounted for clustering effects during the analysis. N (%) ANOVA 4 (6.34) Chi-square 0 (0.00) Correlation 0 (0.00) Linear regression 0 (0.00) Logistic regression 0 (0.00) Mixed models 54 (85.72) No statistics 0 (0.00) Survival 0 (0.00) t-test 5 (7.94) Total 63 (100.00)
Analysis of variance (ANOVA) category includes k-way ANOVA, multiple analysis of variance, and non-parametric ANOVA. Chi-square category includes chi-square, Fisher’s exact test, Homogeneity test, and McNemar’s test. Mixed models category includes mixed models and Friedman/repeated measures ANOVA. No statistics category includes descriptive statistics or nothing reported. Survival category includes Cox regression, Kaplan–Meir, and log-rank tests. t-test category includes independent and paired t-test, non-parametric equivalents (Mann–Whitney, Wilcoxon, and Signed rank tests).
Table 4 Univariable and multiple backward elimination stepwise logistic regression-derived odds ratios (ORs) and confidence intervals
(CIs) for articles accounting versus non-accounting for clustering effects (N = 250).
Variable Category/increment Univariable analysis Multivariable analysis
OR 95% CI P value OR 95% CI P value
Journal American Journal of Orthodontics Baseline Baseline
Angle Orthodontist 1.92 0.97–3.85 0.06 2.17 1.06–4.43 0.03
European Journal of Orthodontics 1.60 0.73–3.48 0.23 1.90 0.84–4.24 0.12
Number of researchers One category 1.23 0.87–1.74 0.3 1.36 0.93–1.97 0.10
NS, non-significant.
studies. When clustering effects are present, the required sample size compared to a design without clustering effects should be increased (Hayes and Bennett, 1999), and also, special statistical methods should be implemented that take in consideration the fact that the observations are not independent but rather correlated (Donner, 1982; Campbell and Grimshaw, 1998; Donner and Klar, 2000; Kerry and Bland, 1998; Hayes and Moulton, 2009). Discounting the fact that observations are correlated may result in low study power but also wrong inferences as statistically non-significant results may falsely turn non-significant (Altman and Bland, 1997; Campbell et al., 2004; Hayes and Moulton, 2009). This study searched the last 24 issues of the three major orthodontic journals with the objective to identify studies with clustering effects and aimed to assess whether the clustering effects were considered in the implemented statistical analyses. Furthermore, associations were explored between accounting for clustering effects and a number of variables as shown in Table 1.
The results of this study are discouraging as they have indicated that only 25 per cent of the studies with clustering effects have accounted for this during the statistical analysis. This is even more discouraging if we consider the fact that usually conclusions and result interpretation are based solely on significance testing and P values (Savitz, 1993;
Chia, 1997; Polychronopoulou et al., 2011). Despite the fact that P values indicate only the strength of the evidence against the null hypothesis, they are often confused with the size of the treatment effect. As P values depend on variance and sample size, a small P value does not necessarily indicate a strong effect and vice versa. Therefore, considering the fact that in 75 per cent of the studies with clustering effects, no accounting for clustering was undertaken, thus potentially leading to false-positive results, and in combination with the fact that conclusions are drawn usually on P values, the probability of reaching the wrong conclusions and misinterpreting the study results may be high.
In Tables 2 and 3, the types of statistical analyses used are displayed and it is reasonable to find a high frequency for
mixed models and repeated measures ANOVA as those methods are appropriate for analysing correlated data (Donner, 1982; Campbell and Grimshaw, 1998; Kerry and Bland, 1998; Donner and Klar 2000; Mollison et al., 2005;
Hayes and Moulton, 2009). The only other category included in Table 3 is the t-test category and this is also reasonable when what is termed ‘cluster level analysis’ has been conducted (Hayes and Moulton, 2009). During the latter approach, for example, in the bond failure case study presented in the introduction, all failures per participant are summed and divided by the number of teeth, thus yielding a single failure proportion/risk per patient. Therefore, a total of 25 proportions/risks will be calculated per treatment group and a t-test or the equivalent non-parametric test may be used in order to make inferences about potential differences in failures between the two adhesives (Hayes and Moulton, 2009).
Considering the information collected on the variables of interest and from the univariable analysis, a weak association was found for accounting for clustering and type of journal and no associations were found for continent of authorship, single/multicenter study, type of study and statistical significance of reported results (Tables 1). The multivariable model shows some evidence that studies published in the AO journal compared to the AJODO are more likely to have accounted for clustering effects during the data analysis (Table 4).
From the 250 included studies, 200 reported significant results and from which only 53 (26.50 per cent) accounted for clustering in the analysis. The logical question that may arise here, given the previous discussion, would be how many of the 147 remaining studies with significant findings which did not account for clustering might have had non-significant results if clustering had been considered? Additionally, as explained previously, how would the study conclusions and interpretation would have changed if the clustering effects were included in the statistical analyses and the resultant P values ended up being larger than 0.05? Discounting clustering effects may have important implications in inferences and study result interpretation in orthodontics.
It should be noted that a potential limitation of this study may be related to the fact that assessment of clustering effects was based purely on what has been reported in the included articles. However, lack of reporting does not automatically mean that provisions regarding clustering effects were not made during design and analysis. Future research may consider exactly how many of the clustered designs that did not consider data correlations and which had significant results would have had non-significant results had the clustering effects been accounted for in the statistical analysis. However, this is not always easy to
assess as this would require further data information not usually reported in the published articles.
Conclusions
1. Clustering effects may be encountered in orthodontic research.
2. In the study sample, only 25.20 per cent of the included studies with clustering effects used appropriate statis-tical analyses.
3. Not accounting for data clustering (data correlation) may lead to wrong inferences and interpretations. References
Altman D G, Bland J M 1997 Units of analysis. British Medical Journal 314: 1874
Campbell M K, Elbourne D R, Altman D G 2004 CONSORT statement: extension to cluster randomised trials. British Medical Journal 328: 702–708
Campbell M K, Grimshaw J M 1998 Cluster randomized trials: time for improvement. The importance of adopting a clustered design is still largely being ignored. British Medical Journal 317: 1171–1172 Chia K S 1997 “Significant-itis”—an obsession with the P-value.
Scandinavian Journal of Work, Environment and Health 23: 152–154 Donner A 1982 An empirical study of cluster randomization. International
Journal of Epidemiology 11: 283–286
Donner A, Klar N 2000 Design and analysis of cluster randomization trials in health research. Arnold, London
Eldridge S M, Ashby D, Kerry S 2006 Sample size for cluster randomized trials: effect of coefficient of variation of cluster size and analysis method. International Journal of Epidemiology 35: 1292–1300 Harrison R, Veronneau J, Leroux B 2010 Design and implementation of a
dental caries prevention trial in remote Canadian Aboriginal communities. Trials 13: 11–54
Hayes R J, Bennett S 1999 Simple sample size calculation for cluster-randomized trials. International Journal of Epidemiology 28: 319–326 Hayes R J, Moulton L H 2009 Cluster randomized trials. Interdisciplinary
statistic series. Chapman& Hall/CRC, Florida
Kerry S M, Bland J M 1998a Analysis of a trial randomized in clusters. British Medical Journal 316: 54
Kerry S M, Bland J M 1998b Sample size in cluster randomization. British Medical Journal 316: 549
Kerry S M, Bland J M 1998c The intracluster correlation coefficient in cluster randomization. British Medical Journal 316: 1455–1460 Kirkwood B R, Sterne J A C 2003 Essential medical statistics, 2nd edn.
Blackwell Publishing, Oxford
Lawrence H P et al. 2008 A 2-year community-randomized controlled trial of fluoride varnish to prevent early childhood caries in Aboriginal children. Community Dentistry and Oral Epidemiology 36: 503–516 Mollison J, Simpson J A, Campbell M K, Grimshaw J M 2005 Comparison
of analytical methods for cluster randomised trials: an example from a primary care setting. Journal of Epidemiology and Biostatistics 5: 339–348 Polychronopoulou A, Pandis N, Eliades T 2011 Appropriateness of
reporting statistical results in orthodontics: the dominance of p values over confidence intervals. European Journal of Orthodontics 33: 22–25 Savitz D 1993 Is statistical significance testing useful in interpreting data?