Low resolution NMR spectroscopy: a tool to
study protein denaturation
I. Application to diamagnetic whey proteins
BY PIERRE LAMBELET, RAFAEL BERROCAL AND FRANCINE DUCRET
Nestec Ltd, Nestle Research Centre, Vers-chez-les-Blanc, CH-1000 Lausanne 26, Switzerland
(Received 10 March 1988 and accepted 9 November 1988)
SUMMARY. A method using low resolution NMR spectroscopy is described for investigating whey protein thermal denaturation. The method is based on measuring at 20 °C changes in water proton transverse (T2) relaxation parameter following the
denaturing treatment. This parameter is shown to be sensitive to protein denaturation and not to other phenomena such as gelation. Examples are given for the qualitative study of protein thermal denaturation in whey protein concentrate, /Mactoglobulin, a-lactalbumin, bovine serum albumin and immunoglobulins aqueous solutions and for the quantitative determination of thermal denaturation in whey protein concentrate solutions.
The functional properties of a food material are essentially determined by its protein function. It is controlled by the molecular structure of the proteins (Zadow, 1986). Denaturation with complete unfolding is of interest for the food scientist as this may arise during thermal processing routinely used in the food industry.
Pulsed NMR spectroscopy has been applied to study the state of water in protein—water systems. In all homogeneous protein samples (Lambelet et al. 1988; Maquet et al. 1984; Oakes, 1976a, 6; Goldsmith & Toledo, 1985; Lelievre & Creamer, 1978; Rydzy & Skrzyriski, 1980, 1982; Blicharska & Rydzy, 1979; Mahdi, 1980; Pumpernik et al. 1975; Richardson et al. 1986) except myosin-containing samples (Nakano & Yasui, 1979; Yasui et al. 1979), the water proton transverse (T2) and
longitudinal (Tx) relaxations have been reported to be single exponential processes.
Such relaxations were interpreted in terms of a two-state model (Zimmerman & Brittin, 1957) with a rapid exchange between a small number of water molecules tightly bound to the protein and normal bulk water (Lambelet et al. 1988; Oakes, 1976a, 6; Richardson et al. 1986). On the other hand, the transverse (Lambelet et al. 1988; Oakes, 19766) or the longitudinal (Goldsmith & Toledo, 1985) relaxation time was shown to shorten during the heating of the sample. On this basis denaturation as well as gelation of protein solutions were studied by pulsed NMR spectroscopy using either the Tt or the T2 relaxation probe, although the T2 relaxation probe has
been shown to be a more sensitive probe for this purpose (Oakes, 19766).
Thermal denaturation of proteins has been studied by monitoring the transverse or the longitudinal relaxation time during heating (Goldsmith & Toledo, 1985; Rydzy & Skrzyriski, 1980; Blicharska & Rydzy, 1979; Pumpernik et al. 1975). However, relaxation times being temperature dependent, such a method has the
MATERIALS AND METHODS Materials
An industrial whey protein concentrate (WPCI) was prepared from sweet cheese whey (Jost et al. 1986). The spray-dried product has a protein content (Kjeldahl, N x 6-38) of 82-5% and a Ca content of 0-70%. An undenaturated whey protein concentrate (WPCL) was prepared in the laboratory by ultrafiltration of raw sweet cheese whey. The lyophilized product has a protein content (Kjeldahl, N x 6-38) of 87-4% and a Ca content of 0-29%. /?-Lactoglobulin (/Mg) was prepared from sweet whey using the spherosil procedure (Meiller & Mirabel, 1975). The product contained 82-8% protein (Kjeldahl, N x 638) and 0 2 9 % Ca. a-Lactalbumin (a-la) (L-6010, lot no. 52 F-80751) and bovine serum albumin (BSA) (A-0281, lot no. 126 F-9350) were obtained from Sigma Chemical Co. (St Louis, MO, USA). The protein concentration (gas chromatography, N x 6-38) was 93-3% (this product might contain traces of (NH4)2SO4) and 93-9% respectively, and the Ca content 350 and 195 ppm
respectively. The BSA was essentially free of fatty acid. The immunoglobulins (IgG) were prepared from defatted colostral milk by acid precipitation of the casein and salting out with (NH4)2SO4. After dialysis, the product was purified by ion exchange
chromatography (DEAE-cellulose). The lyophilized product has a protein content (gas chromatography, N x 6-38) of 84-9% and a Ca content of 51 ppm. 2-Mercaptoethanol (analytical grade) was purchased from E. Merck (D-6100
Darmstadt, FRG). Sample preparation
Whey protein aqueous solutions (sols) were obtained by mixing at room temperature the protein with distilled water to give defined concentrations of proteins between 4 and 20% (w/v). After adjusting the pH to 7-0 with 0-1 M NaOH the mixtures were degassed. To study the influence of pH on denaturation, additional sols were prepared by solubilizing 12% (w/v) /?-lg in distilled water and adjusting the pH to levels between 30 and 8-0. The sols were then introduced into NMR tubes and the tubes sealed.
Denaturation was achieved by heating the sample for 30 min at defined temperatures between 20 and 100 °C. Denaturation was investigated after each thermal treatment by measuring T2 water proton relaxation time in samples
thermostatted at 20 °C for 30 min. NMR measurements
NMR measurements were run on a Minispec PC20 (Bruker Physik AG, Karlsruhe, FRG) at a frequency of 20 MHz. The proton transverse magnetization decay curve was determined by sampling 169 echoes stemming from a Carr-Purcell-Meiboom-Gill pulse sequence. T2 relaxation times were calculated from the spin-echo decay curve
10 20 40 50 60 70 80 90 100 Heating temp., °C
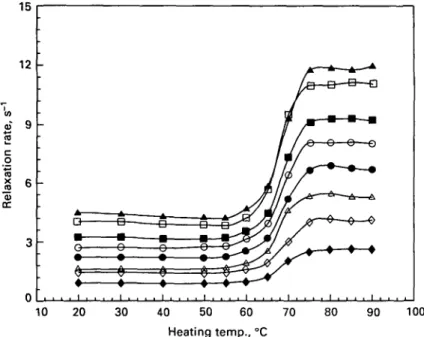
Fig. I. Water proton T2 relaxation rates in an industrial whey protein concentrate solution (pH 70)
heated at various temperatures for 30 min. Protein concentrations: • , 4-0%; O, 5-9%; A, 7-9%; # . 9-9%: O, 11-9%; • . 13-9%; D, 15-8%; A, 17-8%.
Determination of protein denaturation (Rowland, 1938)
Total N was determined according to the Association of Official Analytical Chemists' official method (AOAC, 1980). The non-protein nitrogen (NPN) was determined by measuring the N content (AOAC, 1980) in the filtrates after precipitation with 12% trichloroacetic acid. Whey protein nitrogen (WPN) was calculated by subtracting NPN from non-casein nitrogen measured in filtrates after precipitation of samples at pH 4-6 with acetate buffer. The percent denaturation was calculated by comparison of the WPN of heat-treated sample with WPN of raw sample:
WPN - WPN
% Denaturation = „ " heated-100 ft J- -»-l rr.«7
RESULTS
Water proton T2 relaxation in all whey protein samples investigated, e.g. in
untreated and heated samples, could be analysed in terms of a single exponential characterized by a relaxation time T2. The corresponding relaxation rates (1/T2)
showed dependence on the temperature of the thermal treatment applied to the sample. After complete thermal denaturation, the relaxation rates were not modified during a second heating of the sample in the same temperature range.
WPCI-based samples
For all concentrations of WPC1 between 4 and 18%, the curves relating the water proton transverse relaxation rates to the heating temperature of the sample were similar (Fig. 1): no change in relaxation rate was observed after heating up to 55 °C. However, a sharp increase proportional to protein concentration resulted from
o n rat e J2 6 0) cc 3 0 -/
1
_^-*—
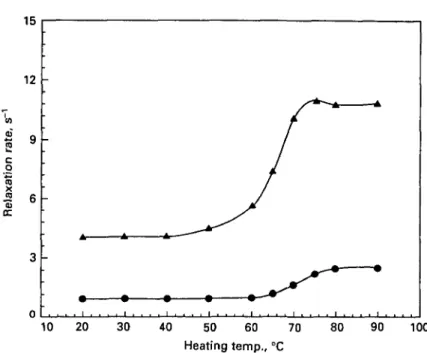
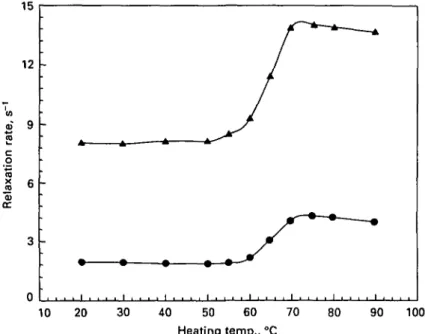
10 20 30 40 50 60 70 Heating temp., °C 80 90 100Fig. 2. Water proton T2 relaxation rates in /?-lactoglobulin solution (pH 70) heated at various
temperatures for 30 min. Protein concentrations: • , 4%; A, 18%.
10 20 30 50 60 70 80 90 100
Heating temp., °C
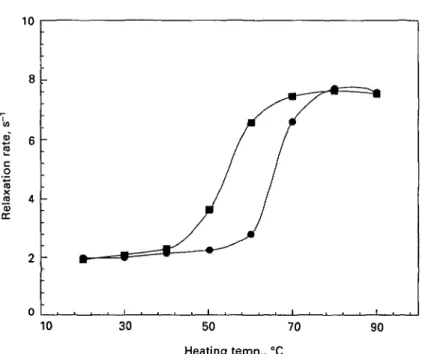
Fig. 3. Influence of pH on the water proton T2 relaxation rates in 12% /Mactoglobulin solutions
heated at various temperatures for 30 min. pH levels: A, 35; 0 , 60; • , 70; • . 80.
thermal treatment in the temperature range between 55 and 75 °C, and no further change was recorded following heating to 90 °C.
{5-Lg-based samples
For /?-lg samples with protein concentration between 4 and 18%, the functions linking the water proton T2 relaxation rates to heating temperatures were similar to
c o 3 -10 30 40 50 60 70 Heating temp., °C 80 90 100
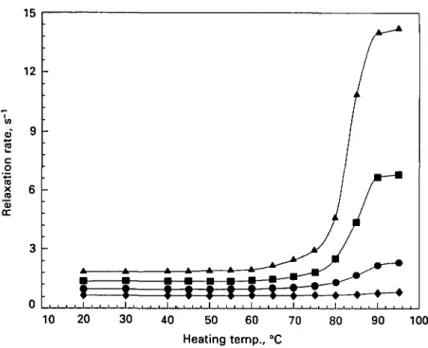
Fig. 4. Water proton T2 relaxation rates in a-lactalbumin solution (pH 70) heated at various
temperatures for 30 min. Protein concentrations: • , 4-4%; • , 8 7 % ; • . 1 3 1 % ; A , 19-9%.
below 40 °C did not influence T2 relaxation rates (Fig. 2). An increase in relaxation
rates, proportional to protein content, was observed following heating between 40 and 80 °C. The exact temperature range at which this increase occurred was slightly dependent on the protein content. Thus, it took place between 60 and 80 °C for the 4 % protein sample and between 40 and 75 °C for the 18% protein sample (Fig. 2). No modification of relaxation rates was observed during further heating up to 90 °C. The influence of pH on T2 relaxation rates measured in 12% /?-lg aqueous
solutions during thermal treatment is presented in Fig. 3. The main characteristics of the function linking relaxation rates to heating temperatures were not modified in the pH range 3-5 to 8-0. However, the temperature range where an increase in relaxation rates was observed was dependent on the pH of the solution. Dropping this pH from 8-0 to 3-5 resulted in an increase in this temperature range from 40-65 to 60-85 °C (Fig. 3).
a-La-based samples
The water proton T2 relaxation rates in 4 % a-la solutions did not change during
30 min heating up to 95 °C (Fig. 4). Significant increases in T2 proton relaxation rates
were however observed during heating between 80 and 90 °C for 8% protein and between about 70 and 90 °C for 13 and 20% protein samples. Heating above 90 °C did not further modify these relaxation rates (Fig. 4). For samples with protein concentration greater than 4 % , the increase in relaxation rates was proportional to the protein level in the sample.
BSA-based saviples
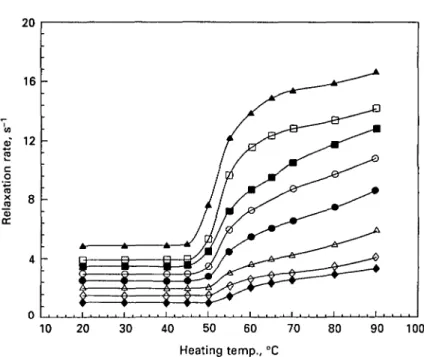
For protein concentrations between 4 and 17%, the T2 relaxation rates in BSA
solutions did not change on thermal treatment at temperatures between 20 and 45 °C (Fig. 5). Between 45 and 60 °C a sharp increase in relaxation rates, proportional to
<B 12 -J2 cc 4 -10 20 Heating temp., °C
Fig. 5. Water proton T2 relaxation rates in bovine serum albumin solution (pH 70) heated at various
temperatures for 30 min. Protein concentrations: • , 3 - 8 % ; 0 , 5 - 6 % ; A , 7-5%; # , 9 - 4 % ; O . 1 1 3 % : • , 13-2%; Q , 1 5 0 % ; A , 16-9%.
the protein content, was observed after 30 min heating. Successive treatment at temperatures between 60 and 90 °C further enhanced T2 proton relaxation rates, but
only slightly (Fig. 5).
IgG-based samples
The T2 water proton relaxation rates were measured in 6 and 18% IgG solutions
as a function of the heating temperature (Fig. 6). For both concentrations, the curves obtained were similar to those recorded with the VVPC samples: no change in relaxation parameters was observed following heating up to 60 °C, sharp increases proportional to the protein content were recorded between 60 and 75 °C, and no modification was observed after further heating to 90 °C.
DISCUSSION
T2 relaxation of the non-equilibrium water proton magnetization in whey protein
aqueous solution is purely exponential. This has been already reported for most of the protein-water systems studied (Lambelet et al. 1988; Maquet et al. 1984; Oakes, 1976a, b; Goldsmith & Toledo, 1985; Lelievre & Creamer, 1978; Rydzy & Skrzyriski, 1980, 1982; Blicharska & Rydzy, 1979; Mahdi, 1980; Pumpernik et al. 1975; Richardson et al. 1986) and has been interpreted (Oakes, 1976a, 6; Lelievre & Creamer, 1978; Mahdi, 1980; Richardson et al. 1986) in terms of a two-state model with rapid exchange occurring between bulk water molecules and those bound to proteins. According to this model, transverse relaxation rate, T2~\ is given by:
V 1 = h c / ( l - h c ) (T^ + T b r + T V1
where c is the protein concentration (g/g), h is the amount of water hydratcd by unit mass of protein, Tb is the life time of a water molecule in the bound phase and
12 9 -cc 6 3 -10 20 30 40 50 60 70 80 90 100 Heating temp., °C
Fig, 6. Water proton T2 relaxation rates in immunoglobulin G solution (pH 70) heated at various
temperatures for 30 min. Protein concentrations: # , 61 %; A> 18-5%.
o
000 002 0-04 0 0 6
hc/(1-hc)
Fig. 7. Water proton T2 relaxation rates in an industrial whey protein concentrate solution (pH 70)
in function of hc/(l-hc); see text. 0 , Untreated samples; • . samples heated at 90 °C for 30 min. subscripts b and f refer to the bound and free states respectively. Values of h have been measured in WPCI aqueous solutions by determining the amount of unfreezable water at —35 °C using NMR spectroscopy. Within the protein concentration range 4-15%, the amount of hydrated water equalled 28%. This h value is in good agreement with corresponding data measured in whey protein solutions (Kuntz & Kauzmann, 1974).
c o 4 2 -90 Heating temp., °C
Fig. 8. Influence of 2-mercaptoethanol on the water proton T2 relaxation rate in 10% /?-laetoglobulin
solution (pH 70) heated at various temperatures for 30 min. # , Without and • , with 0-3% (w/v) 2-mercaptoethanol.
The interpretation of NMR data in terms of the two-state model is confirmed by the linearity of the graph of water T2 relaxation rates observed in WPCI aqueous
solutions against hc(l —he) (Fig. 7, lower line). Intercept of this plot approximately equals value of T2~x for pure water. Assuming rb < < T2b (Oakes, 1976a), the value
of the relaxation time associated with bound water, T2b, can be calculated from the
slope of the graph reported in Fig. 7 (lower line). This value, 11 ms, is in good agreement with the reported value, 9-2 ms measured at 60 MHz (Oakes, 1976a). Thus, water relaxation rates observed in whey protein aqueous solutions can be understood in terms of a rapid exchange between most of the water molecules having a mobility equal to that of pure water and a small fraction of water molecules tightly bound to polar groups on the surface of the protein, water which has a mobility about 100-fold lower.
Similarly to what is recorded in untreated material, T2 water relaxation in heat
treated whey protein samples is a single experimental process, and the observed relaxation rates are linearly related to hc(l —he) (Fig. 7, upper curve). Although a contribution to the observed water proton relaxation rates in thermally treated whey protein solutions is coming from exchange between labile protein protons and water protons (Oakes, 19766; Lambelet et al. 1988), the relaxation time of bound water (T2b) can be calculated from the gradient of the graph reported in Fig. 7 (upper line).
Assuming Tb < < T2b (Oakes, 19766) T2b equals 4 ms, e.g. a lower value than that for
water bound to native whey protein (11 ms). The increase of T2 relaxation rate
during thermal treatment of whey protein aqueous solutions is therefore due to a decrease of mobility of the water fraction bound to the protein.
It is well documented that thermal treatment of whey proteins near 80 °C causes protein unfolding (Privalov & Khechinashvili, 1974; Riiegg et al. 19776). The unfolding step is usually followed by protein aggregation and eventually gelation. It is not possible to attribute definitively the increase in T2 relaxation during thermal
Klostermeyer, 1976), is not responsible for change in T2 relaxation rate. Indeed, as
shown in Fig. 8, changes in T2 relaxation rate during treatment of /Mg solution is also
observed (although at a lower temperature) when the solution contains an excess of 2-mercaptoethanol, a product which blocks the -SH groups of the protein. In the same way, no variation in T2 relaxation rate was observed during thermal treatment
up to 95 °C of a 10% (w/v) aqueous solution of sodium caseinate, which is known not to change its structure upon heating (data not shown). Variations in relaxation parameters are certainly not related to gelation since these changes are also observed when this phenomenon does not occur, e.g. in samples with low protein concentrations.
On the other hand, it is worthwhile comparing NMR data with data obtained by differential scanning calorimetry (DSC). Indeed, thermal phenomena which are encountered during heating protein solutions (Privalov, 1974; Privalov & Khe-chinashvili, 1974) are not due to physical aggregation processes (Donovan & Ross, 1973) but rather to conformational changes of the protein (Privalov & Khe-chinashvili, 1974; Riiegg et al. 1977a; Brandts, 1969). For example, heat transition around 70 °C evidenced by calorimetry during heating of aqueous solution of /Mg (Itoh et al. 1976; De Wit & Swinkels, 1980; De Wit & Klarenbeek, 1981; De Wit, 1981; De Wit et al. 1983) occurs in the same temperature range as do conformational changes of /Mg detected by either optical rotation measurements (Dupont, 1965) or fluorescence spectroscopy (Mills, 1976). Now, this heat effect is in accordance with the change in T2 proton relaxation rate observed in /Mg aqueous solution following
30 min heating at temperatures between 60 and 70 °C (Fig. 2). Moreover T2
relaxation rates in /Mg solutions depend on the pH of the sample over the range 3-5-8-0 (Fig. 3), as do DSC thermograms (Itoh et al. 1976; De Wit & Klarenbeek, 1981). In both experiments the lowest transition is observed for the sample at pH 8-0, the highest for the sample at pH 3-5, whilst the two observed in samples at pH 6-0 and pH 7-0 are close to each other. Similarly, T2 relaxation rate transitions in
WPCI and IgG solutions are close to those observed in /Mg samples (Figs 1, 2, 6) as are close transitions observed in DSC curves of these three proteins (De Wit, 1981; De Wit et al. 1983). In the same way the transitions in T2 relaxation rates observed
in defatted BSA solutions heated between 50 and 60 °C are well related to corresponding DSC curves, showing an endothermic phenomenon around 65 °C (itoh et al. 1976; Gumpen et al. 1979; De Wit et al. 1983). DSC curves of solutions of a-la show an endothermic phenomenon over the temperature range 50-70 °C (De Wit etal. 1983; Chaplin &Lyster, 1986;Pfeil, 1981; Riiegg etal. 1977a). This phenomenon has however been shown to be almost completely (around 90%) reversible on cooling (Dc Wit el al. 1983; Chaplin & Lyster, 1986; Riiegg et al. 19776). DSC experiments have shown on the other hand that heating the a-la solutions to a higher temperature (e.g. 95 °C) and keeping them at this temperature for a short period of time (e.g. 30 min) lead to irreversible transformation of the protein (Chaplin & Lyster, 1986). Present results (Fig. 3) relating a variation in proton T2 relaxation rates in
a-la solutions heated over the temperature range 75-95 °C are therefore in fair agreement with DSC results. Obviously, the NMR method as described in the present study, e.g. with recording relaxation parameters at 20 °C, is sensitive only to irreversible transformation.
00 65 70 80 90 11-3 5 5 5 95-3 100-8 1000 * Rowland (1938) 110 452 80-0 80-0 831
protein solutions are therefore associated with protein unfolding denaturation and can be used as a probe for qualitatively investigating this transformation. The question now arises as to whether the proton relaxation parameters can be used for quantitative determination of protein denaturation or, more precisely, if the amplitude of the deviation of relaxation rate observed is somehow related to the extent of protein denaturation. In the NMR experiment, the relative amount of thermally denatured protein following heating at temperature T can, a priori, be expressed using the formula:
% Denaturation = RT ~ ^ " " " . 100
where Rr = Relaxation rate in sample heated at temperature T
Rmln = Relaxation rate in untreated sample
Rmax = Relaxation rate in completely denatured sample.
The validity of the NMR method for determining protein denaturation quantitatively has been tested with the laboratory prepared native whey protein concentrate sample, WPCL. For this purpose 10% WPCL solutions (pH 7-0) have been heated at various temperatures between 60 and 90 °C, held 30 min at these temperatures and then rapidly cooled to 0 °C. The degree of protein denaturation resulting from each thermal treatment was conjointly determined using the relaxation parameters and the standard Rowland method (Rowland, 1938). The two sets of data are compared in Table 1. For all heating temperatures the Rowland values are lower than the NMR values. The difference between a pair of values is in fact proportional to the extent of denaturation. The arbitrary 100 % value attributed by the NMR method to the whey heated at 90 °C is supported by the fact that no further increase in T2 relaxation rate was observed during heating to 110 °C.
Moreover the percent of denaturation measured by the standard method in a WPC sample heated at 110 °C for 30 min was still below 85%. Such a difference between Rowland and NMR data might come from the Rowland method measuring precipitation resulting from unfolding and aggregation, whilst the NMR method is principally sensible to unfolding and not to aggregation.
Present results clearly show that whey protein irreversible thermal denaturation can be investigated using low resolution NMR spectroscopy by measuring at 20 °C T2 water proton relaxation rate following thermal treatment. Indeed, changes in
T2 relaxation rates observed in samples with protein concentration greater than 3 %
studying the denaturation of proteins capable of complexing paramagnetic ions, following thermal processing up to 160 °C (De Wit & Klarenbeek, 1981) or following treatment with chemical agents.
The authors thank J. Vuichoud for performing calcium analysis and J. J. Pahud for supplying the igG sample.
REFERENCES
AOAC 1980 Official methods of analysis of the Association of Official Analytical Chemists, 13th edn, Methods
10.047, 16.048 and 47.021 (Ed. W. Horwitz) Washington, DC: AOAC
BLICHARSKA, B. & RYDZY, M. 1979 Investigation of protein denaturation by nuclear magnetic relaxation method. Ada Physica Polonica A56 439-443
BRANDTS, J . F. 1969 Conformational transitions of proteins in water and in aqueous mixtures. In Structure and
Stability of Biological Macromolecules pp. 213-290 (Eds S. N. Timasheff and G. D. Fasman) New York:
Marcel Dekker
CHAPLIN, L. C. & LYSTER, R. L. J . 1986 Irreversible heat denaturation of bovine a-lactalbumin. Journal of
Dairy Research 53, 249-258
DE WIT, J . N. 1981 Structure and functional behaviour of whey proteins. Netherlands Milk and Dairy Journal 35 47-64
DE W I T , J . N. & KLARENBEEK, G. 1981 A differential scanning calorimetric study of the thermal behaviour of bovine /Mactoglobulin at temperatures up to 160 °C. Journal of Dairy Research 48, 293-302
DE W I T , J . N., KLARBNUEEK, G. & HONTELEZ-BACKX, E. 1983 Evaluation of functional properties of whey protein concentrates and whey protein isolates. I. Isolation and characterization. Netherlands Milk and Dairy
Journal 37 37-49
DE W I T , J . N. & SWINKELS, 0 . A. M. 1980 A differential scanning calorimetric study of the thermal denaturation of bovine /?-laetoglobulin. Thermal behaviour at temperatures up to 100 °C. Biochimica el
Biophysica Ada 624 40-50
DONOVAN, J . W. & Ross, K. D. 1973 Increase in the stability of avidin produced by binding of biotin. A differential scanning calorimetric study of denaturation by heat. Biochemistry 12 512-517
DUPONT, M. 1965 [Comparison of the thermal denaturation of /?-lactoglobulins A and B at pH 6-85.]
Biochimica et Biophysica Ada 94 573-575
GOLDSMITH, S. M. & TOLEDO, R. T. 1985 Studies on egg albumen gelation using nuclear magnetic resonance.
Journal of Food Science 50, 59-62
Gi'MPEN, S., HEC.O, P. O. & MARTENS, H. 1979 Thermal stability of fatty acid-serum albumin complexes studied by differential scanning calorimetry. Biochimica et Biophysica Ada 574 189-196
ITOH, T., WADA, Y. & NAKANISHI, T. 1976 Differential thermal analysis of milk proteins. Agricultural and
Biological Chemistry 40 1083-1086
JOST, R., BAECIILER, R. & MASSON, G. 1986 Heat gelation of oil-in-water emulsions stabilized by whey protein.
Journal of Food Science 51 440-444, 449
KUNTZ, I. D. & KAUZMANN, W. 1974 Hydration of proteins and polypeptides. Advances in Protein Chemistry 28, 239-345
LAMBELET, P., BERROCAL, R., DESARZENS, C. FROEHLICIIER, I. & DUCRET, F. 1988 Pulsed low-resolution
NMR investigations of protein sols and gels. Journal of Food Science 53 943-946, 964
LELIEVRB, J . & CREAMER, L. K. 1978 An NMR study of the formation and syneresis of renneted milk gels.
Milchwissenschaft 33 73-76
MAHDI, A. I. 1980 Nuclear magnetic resonance in soya bean protein isolates, sols and gels. Ph.D Thesis. University of Nottingham
MAQUET, J., THEVENEAU, H., DJABOUROV, M. & PAPON, P. 1984 'H-NMR study of gelatin gels. International
Journal of Biological Macromolecules 6 162-163
MEILLER, F. & MIRABEL, B. 1975 [Process for the separation of proteins by ion exchange.] French Patent
Application 2,321,932
MILLS, 0 . E. 1976 Effect of temperature on tryptophan fluorescence of /?-lactoglobulin B. Biochimica et
Biophysica Ada 434 324-332
NAKANO, H. & YASUI, T. 1979 Pulsed nuclear magnetic resonance studies of water in myosin suspension during dehydration. Agricultural and Biological Chemistry 43 89-94
OAKES, J . 1976a Protein hydration. Nuclear magnetic resonance relaxation studies of the state of water in native bovine serum albumin solutions. Journal of the Chemical Society, Faraday Transactions I 72 216-227
PuiHPERNiK, D., FAJT, B., LAPANJE, S. & AZMAN, A. 1975 NMR relaxation study of the thermal denaturation of lysozyme. Zeilschrift fur Naturforschung 30C 294-295
RICHARDSON, S. J., BAIANTJ, I. C. & STEINBERG, M. P. 1986 Mobility of water in wheat flour suspensions as studied by proton and oxygen-17 nuclear magnetic resonance. Journal of Agricultural and Fowl Chemistry 34
17-23
ROWLAND, S. J. 1938 The determination of the nitrogen distribution in milk. Journal of Dairy Research 9 42-46
RiiEOO, M., MOOR, U. & BLANC, B. 1977a A calorimetric study of the thermal denaturation of whey proteins in simulated milk ultrafiltrate. Journal of Dairy Research 44 509-520
RUEOO, M., MOOR, U., LUKESCH, A. & BLANC, B. 19776 In Application of Calorimetry in Life Sciences pp. 59-73 (Eds I. Lamprecht and B. Schaarschmidt) Berlin: Walter de Gruyter.
RVDZY, M. & SKRZYNSKI, W. 1080 Investigation of/S-galactosidase thermal denaturation by nuclear magnetic relaxation method. Studia Biophysica 78 119-126
RYDZY, M. & SKRZYNSKI, YV. 1982 'H-NMR relaxation studies of native and thermally denaturated lysozyme solutions. An isotope dilution experiment. Biochimica et Biophysica Ada 70S 33-37
SAWYER, YV. H. 1968 Heat denaturation of bovine /Mactoglobulins and relevance of disulfide aggregation.
Journal of Dairy Science 51 323-329
WATANABE, K. & KLOSTERMEYER, H. 1976 Heat-induced changes in sulphydryl and disulphide levels of //-lactoglobulin A and the formation of polymers. Journal of Dairy Research 43 411-418
YASUI, T., ISHIOROSHI, M., NAKANO, H. & SAMEJIMA, K. 1979 Changes in shear modulus, ultrastructure and
spin-spin relaxation times of water associated with heat-induced gelation of myosin. Journal of Food Science
44 1201-1204, 1211
ZADOW, J. G. 1986 Functionality of dairy products. Australian Journal of Dairy Technology 41 90-99 ZIMMERMAN, J. R. & BRITTIN, YV. E. 1957 Nuclear magnetic resonance studies in multiple-phase systems:
lifetime of a water molecule in an adsorbing phase on silica gel. Journal of Physical Chemistry 61 1328-1333