The Functional Neuroanatomy of Target Detection: An fMRI Study of Visual and Auditory Oddball Tasks
9
0
0
Texte intégral
(2) counting and button-press responses in order to obtain effects that are invariant for stimulation and response modality and can thus be regarded as functional imaging equivalents of the P300 component.. Materials and Methods Subjects and Task Five neurologically and mentally healthy male subjects (age range 25–37, mean 29) were recruited from an academic environment. All subjects gave informed consent to participation in the study. The four experimental conditions were defined by the mode of stimulus delivery (visual or auditory) and of the subjects’ response (mental counting of targets or differential button press). All four conditions were tested in separate EEG and fMRI sessions. Stimuli were generated on a personal computer using the STIM® software package (Neuroscan, Inc., Hernon, USA). In the EEG setting, stimuli were presented using the STIM hardware for visual and auditory stimulation. In the fMRI setting, visual stimuli were delivered to a high luminance LCD projector (EIKI LC-6000), and auditory stimuli to a custom-made sound transmission device that accurately preserves tone frequencies. The visual oddball paradigm consisted of sequences of angles that were presented for 800 ms every 8 s. Subjects had to detect small angles (15°) in trains of large angles (60°). The auditory oddball paradigm consisted of sine tones of 1000 and 2000 Hz at a sound pressure level of 90 dB that were presented for 200 ms (including 10 ms rise-time and 10 ms fall-time) every 8 s. The 2000 Hz tone was defined as target. In both paradigms, targets appeared in pseudo-random order with a probability of 15% and were separated from the next target by at least 32 s to allow for a return of the BOLD signal to baseline levels. In the button-press conditions, subjects had to press a button with the right index finger upon each stimulus presentation. One button was defined as target and another as non-target button. Responses were recorded using the STIM hardware (during EEG) and a custom-made fibreoptic answer-box (during fMRI). In the counting condition subjects silently counted the targets and reported the result after the session. ERP Recording and Analysis The event-related electric potentials were recorded using NeuroScan equipment with Synamps amplifiers (Neuroscan, Inc.). Twenty electrodes were placed according to the 10–20 System (Fp1, Fp2, F7, F3, Fz, F4, F8, T3, C3, C4, T4, T5, P3, Pz, P4, T6, O1, O2, A1, A2) and recorded against the electrode Cz as reference. Two additional bipolar pairs of electrodes were placed to record horizontal and vertical EOG, and one bipolar pair to record ECG. The ERPs were recorded as ongoing EEG and digitized with a rate of 512 Hz. Prior to digitizing the EEG was bandpass filtered at 0.1–30 Hz. The analysed time epoch at each stimulation was 1024 ms (200 ms pre- and 824 ms post-stimulus). For each epoch a baseline correction for the data 200 ms prior to the stimulus was performed. To avoid artefacts all epochs containing data exceeding ±50 µV in any channel (except for ECG channels) were excluded from further analysis. For each condition, ∼20 target sweeps were obtained free of artefacts. The average for each subject for each stimulus and response condition was calculated separately for target and non-target stimuli (4 × 2 conditions). The data were recalculated using linked mastoids as reference [(A1 + A2)/2]. To obtain topographical unbiased amplitude values, we computed the global field power (GFP) (Lehmann and Skrandies, 1971; Rodin 1991; Pritchard et al, 1996; Fylan et al, 1997). The maximal GFP amplitude was measured for the target stimuli in a time window of 300–400 ms for auditory and 400–600 ms for visual paradigms and compared to the GFP amplitude for non-target stimuli at the same time point (paired Student’s t-test). fMRI Measurements and Analysis The MR scanner used for imaging was a 1.5 T whole-body superconducting system (M AGNETOM Vision, Siemens Medical Systems, Erlangen, Germany) equipped with a standard head coil, an active shielded gradient coil (25 mT/m) and echo planar sequences for ultra-fast MR imaging. For functional imaging, we used a BOLD sensitive single-shot echo planar (EPI) sequence (TE = 26 ms; TR = 2000 ms; f lip angle = 90°; matrix. 816 Functional Neuroanatomy of Target Detection • Linden et al.. size = 64 × 64) and an event-related design with a time resolution of 2 s. Each functional volume consisted of 12 slices, with a thickness of 6 mm and a pixel size of 3.125 × 3.125 mm (field of view: 200 × 200 mm), located along oblique planes parallel to the plane crossing the anterior and posterior commissure. Each functional time-series consisted of 128 volumes and lasted for 256 s. During this time 32 stimuli were presented at 8 s intervals. For each of the four conditions (visual oddball–counting; visual oddball–button press; auditory oddball–counting; auditory oddball–button press) four functional time series were acquired. Every subject thus underwent 16 scans of 128 volumes each. For the three-dimensional reconstruction of functional data, highresolution three-dimensional data sets [T1 weighted FLASH (fast low-angle shot) with 180 partitions; isotropic voxel size 1 mm3] were acquired for each subject. Data analysis, registration and visualization were performed with the fMRI software package BrainVoyager 3.0 (Goebel et al., 1998a,b, Dierks et al. 1999). Prior to statistical analysis, the time series of functional images was aligned for each slice in order to minimize the signal changes related to small motions of the subject during the acquisition. The realigned time series were spatially filtered by convolving each EPI image with a bidimensional Gaussian smoothing kernel with full width at half maximum (FWHM) = 2 pixels. No temporal smoothing was performed in order to maintain the single trial temporal resolution. Furthermore, the linear drifts of the signal with respect to time were removed from each pixel’s time-course. The two-dimensional slice time-courses were then converted into three-dimensional volume time-courses by co-registration with the three-dimensional anatomical data sets that were acquired in the same scanning sessions. Co-registration was based on the Siemens slice position parameters of the T2*-weighted measurement (number of slices, slice thickness, distance factor, Tra–Cor angle, FOV, shift mean, off-centre read, off-centre phase, in-plane resolution) and of the T1-weighted FLASH measurement (number of sagittal partitions, shift mean, off-centre read, off-centre phase, resolution) with respect to the initial over view measurement (scout). For each subject the structural and functional three-dimensional data sets were transformed into Talairach space. Talairach transformation was performed in two steps. The first step consisted in rotating the threedimensional data set of each subject to be aligned with the stereotaxic axes. For this step the location of the anterior commissure (AC) and the posterior commissure (PC) and two rotation parameters for midsagittal alignment had to be specified manually in the three-dimensional FLASH data set. In the second step the extreme points of the cerebrum were specified. These points together with the AC and PC coordinates were then used to scale the three-dimensional data sets into the dimensions of the standard brain of the Talairach and Tournoux atlas (Talairach and Tournoux, 1988) using a piecewise affine and continuous transformation for each of the 12 defined subvolumes. The statistical analysis of the variations of the BOLD signal was based on the application of the general linear model to time series of task-related functional activation (Holmes et al. 1997). General linear models were computed for each of the four conditions from 20 volume time-courses (five subjects, four repetitions) with 128 time points each. The design matrix contained the 20 idealized response functions (assuming the value 1 for the four time points following the presentation of the target and the value 0 for the remaining time points) that corresponded to these signal time-courses. For statistical analysis, any combination of predictors can be used. It is thus possible to compute both single subject and group effects and to test for inter- and intraindividual stability. In the present study, the identification of task-related spatial activation patterns and comparison between the four task conditions was based on group correlation maps (five subjects, four repetitions of 128 time points each per condition) thresholded at r > 0.4 (P < 10–4, uncorrected). In order to exclude a confounding effect of sample size differences we performed a second analysis of the volume time-courses, in which the specified predictor for the target epochs was compared to a baseline condition of equal length (the baseline predictor included the four time points prior to each target). Effects were only accepted as significant when they were specific for the target versus baseline epochs at P < 10–4.
(3) Figure 1. Average (n = 5) ERP wave forms at scalp electrodes Fz, Cz, Pz, O1 and O2 and for horizontal (EOG-H) and vertical (EOG-V) electrodes for targets (solid line) versus non-targets (dotted line) in all stimulation and response modalities (a, visual; b, auditory stimulation). The button-press reaction times were greater for targets than for non-targets (auditory target 706 ms, SD 158 ms; auditory non-target 530 ms, SD 131 ms; visual target 611 ms, SD 118 ms; visual non-target 525 ms, SD 116 ms). The error rates were 1.8% for visual button press and 1.1% for auditory button press. and the baseline predictor did not show any significant departure from the overall average of the time-course. The T1-weighted FLASH three-dimensional recording of one subject was used for a surface reconstruction of both hemispheres. The white/grey matter border was segmented with a region-growing method. The discrimination between white and grey matter was improved by several manual interactions (e.g. labelling subcortical structures as ‘white matter’). The white/grey matter border was finally tesselated in a single step using two triangles for each side of a voxel located at the margin of white matter. The tesselation of a single hemisphere typically consists of roughly 240 000 triangles. The reconstructed surface is subjected to iterative corrective smoothing (100–200 iterations). An interactive morphing algorithm (Goebel et al., 1998a) was used to let the surface grow smoothly into the grey matter. Through visual inspection, this process was halted when the surface reached the middle of grey matter (approximately layer 4 of the cortex). The resulting surface was used as the reference mesh for the visualization of functional data. The iterative morphing algorithm was further used to inf late each hemisphere. An inf lated hemisphere possesses a link to the folded reference mesh so that functional data may be shown at the correct position of the inf lated. Table 1 Mean and standard deviation (SD) for P300 GFP amplitudes for targets and non-targets in all stimulation and response modalities Visual. Auditory. Button press Target. Counting. Button press. Counting. Non-target Target Non-target Target Non-target Target Non-target. Mean (µV) 7.37 3.55 SD 2.38 1.68 P <0.001. 4.92 2.27 0.69 0.97 0.036. 5.15 2.16 0.013. 2.27 0.99. 3.70 1.02 0.004. 1.76 0.59. representation. This link was also used to keep geometric distortions during inf lation to a minimum with a morphing force that keeps the area of each triangle of the inf lated hemisphere as close as possible to the value of the folded reference mesh. This display of functional maps on an inf lated hemisphere allows the topographic representation of the. Cerebral Cortex Dec 1999, V 9 N 8 817.
(4) Table 2 Anatomical areas (for abbreviations see Talairach and Tournoux, 1988) and Brodmann areas (BA) of activated clusters in the four experimental conditions and Talairach coordinates (Talairach and Tournoux, 1988) of centres of mass of group and (in brackets) single subject clusters Experiment. Anatomical area. BA. x. y. z. n. Visual stimulus, button press. right Gsm left Gsm right sylvian left sylvian SMA/ant. GC right VC. 40 40 45/insula 45/insula 32 17/18. 52 (48 ± 4.6) –49 (–52 ± 1.8) 48 (47 ± 3.6) –45 (–40 ± 4.8) –1 (1 ± 6.3) 14 (13 ± 2.6). –31 (–34 ± 6.2) –24 (–29 ± 4.1) 4 (6.4 ± 5.6) –2 (1 ± 6.0) –1 (2 ± 4.6) –96 (–93 ± 1.7). 41 (41 ± 5.9) 46 (42 ± 5.8) 11 (9 ± 4.4) 10 (9 ± 4.3) 46 (46 ± 1.3) 5 (5 ± 6.2). 5 4 5 5 4 5. Visual stimulus, silent counting. right Gsm left Gsm right Sylvian left sylvian SMA/ant. GC right VC right Lpi left Lpi. 40 40 45/insula 45/insula 32 17/18 40 40. 55 (56 ± 2.2) –55 (–53 ± 5.5) 44 (47 ± 4.4) –42 (–41 ± 6.1) 0 (3 ± 2.7) 15 (11 ± 5.5) 41 (46 ± 4.5) –46 (50 ± 3). –36 (–31( 4.7) –37 (–34 ± 7.5) 9 (6.2 ± 5.0) 2 (0 ± 10.0) 5 (6 ± 4.9) –96 (–90 ± 5.8) –29 (–32 ± 3.5) –39 (–30 ± 3.4). 35 (31 ± 2.9) 33 (35 ± 2) 9 (8.6 ± 4.9) 8 (8.2 ± 5.2) 46 (41 ± 3.6) 7 (8 ± 4.6) 48 (46 ± 1.2) 46 (48 ± 1.7). 4 3 5 5 5 5 3 4. Auditory stimulus, button press. right Gsm left Gsm right sylvian left sylvian bilateral Pcu left GPoC. 40 40 45/insula 45/insula 7 1/2/3. 55 (55 ± 4.0) –55 (–57 ± 3.7) 42 (45 ± 4.6) –40 (–39 ± 1.4) –2 (–5 ± 5.5) –50 (–45 ± 4.9). –33 (–31 ± 7.0) 34 (–36 ± 6.4) 2 (2.6 ± 4.7) 0 (1 ± 4.6) –71 (–69 ± 2.3) –28 (–23 ± 4.2). 31 (32 ± 7.2) 33 (36 ± 6.1) –3 (5.2 ± 6.8) 0 (2 ± 4.4) 45 (42 ± 3.1) 44 (45 ± 3.9). 5 5 5 4 3 4. Auditory stimulus, silent counting. right Gsm left Gsm right Sylvian left Sylvian SMA/ant. GC post. GC right Gfm right Gtm. 40 40 45/insula 45/insula 32 23 6 21. 55 (54 ± 5.8) –58 (–54 ± 3.7) 43 (47 ± 4.7) –39 (–42 ± 8.8) 0 (0 ± 2.4) 0 (3 ± 3.4) 45 (45 ± 2.4) 58 (51 ± 7.1). –29 (–29 ± 2.8) –40 (–36 ± 6.7) 11 (11 ± 6.5) 11 (11 ± 10.2) 7 (6 ± 7.3) –28 (–31 ± 4.1) 1 (1.4 ± 3.1) –39 (–42 ± 4.0). 26 (28 ± 2.6) 27 (26 ± 6.6) –4 (0 ± 6.2) –4 (0 ± 5.4) 44 (43 ± 3.7) 27 (33 ± 8.8) 44 (44 ± 1.9) 8 (9 ± 3.2). 4 5 5 5 4 5 5 3. For details of cluster selection, see Materials and Methods. The last column indicates for how many of the five subjects the activation reached significance at the P < 10–4 (uncorrected) level. Only significant activations were used to compute SDs of single subject data. Note that in at least two directions of the Talairach coordinate system, activated clusters in BA40 and BA45/insula did not differ by more than 1 SD between experimental conditions (the largest variability being apparent along the z-axis).. three-dimensional pattern of cortical activation without loss of the lobular structure of the telencephalon.. auditory targets. The relative BOLD signal change for targets compared to a non-target baseline, averaged over all five subjects, peaked at ∼0.4% (Fig. 4).. Results The evoked electric responses to the visual and auditory stimuli for the different response modalities, shown in Figure 1, reveal that the stimuli, which were identical for the EEG and fMRI measurements, had the properties of classical oddball paradigms. They elicited a marked parietocentral positivity at latencies of 400–550 ms (visual) and 300–400 ms (auditory) with significant GFP amplitude differences for targets versus non-targets (Table 1). The corresponding increases of the BOLD signal, measured with fMRI, for response to targets versus response to non-targets that were significant at the P = 10–4 level (uncorrected) are summarized in Table 2 and presented as functional group data on inf lated individual hemispheres in Figures 2 and 3. For all stimulation and response conditions, activation was consistently observed in bilateral perisylvian areas, including the supramarginal gyrus (BA 40), the frontal operculum (BA 45), and the insula. In all conditions except the auditory button-press, prominent activation was also observed in the frontal midline areas supplementary motor area (SMA) and anterior cingulate gyrus (BA 32). Additional clusters of activation appeared in primary and secondary visual cortex (BA 17/ 18) during the visual target presentation, in left Rolandic cortex (BA 1/2/3), the precuneus (BA 7) and the right middle temporal gyrus (BA 21) during the button press response to auditory targets, and in the posterior cingulate gyrus (BA 23) and the right middle frontal gyrus (BA 6) during the mental counting of. 818 Functional Neuroanatomy of Target Detection • Linden et al.. Discussion The detection of rare target stimuli in a train of standard stimuli was associated with a prominent activation of bilateral perisylvian areas in the inferior parietal and frontal lobes and insular cortex. This activation was consistent over stimulation and response conditions and cannot be explained by specific effects of mental counting or motor response preparation, or the processing of visual or auditory stimuli, respectively. It was elicited by stimuli whose physical difference from the non-target stimuli was marginal, and which were characterized by their task-relevance and their frequency in the stimulus train. The activation of these perisylvian areas during the target epochs of different oddball tasks therefore suggests an involvement of these areas in the higher-order multimodal processing of sensory information that is modulated by the requirements of a cognitive task. According to this interpretation, the supramarginal gyrus, frontal operculum and insula would form a network for saliency detection in different sensory modalities. The frontal midline areas SM A and anterior cingulate have been shown to be involved in a wide variety of cognitive tasks and associated with effort and task difficulty (Dehaene et al., 1998a; Paus et al., 1998). Their activation during target detection in oddball paradigms might therefore ref lect their general role in response.
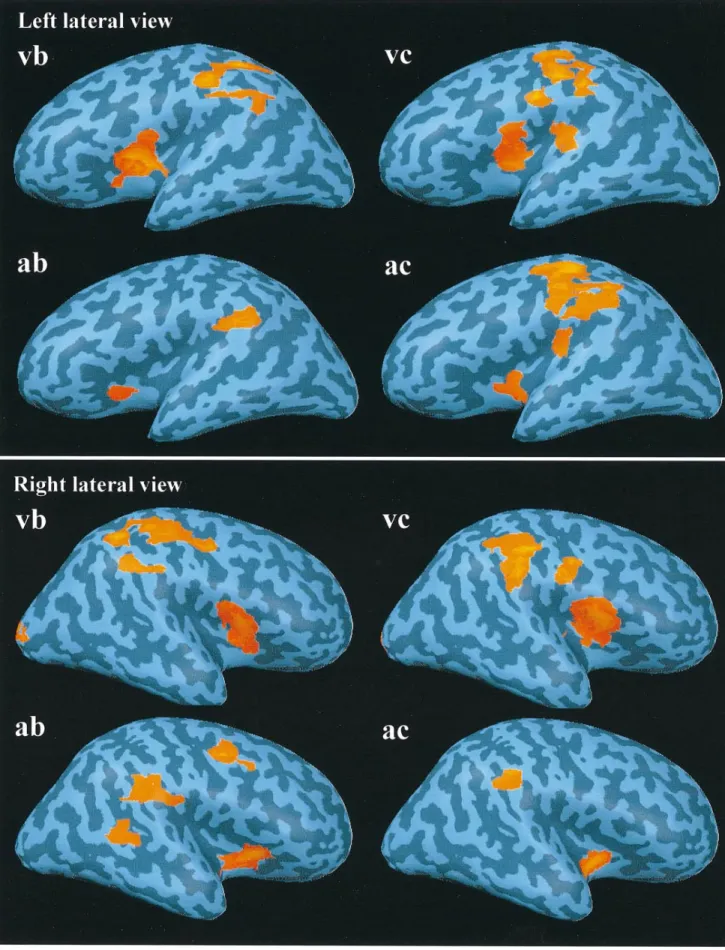
(5) Figure 2. Average (n = 5) three-dimensional maps of BOLD signal increase for targets versus non-targets in all stimulation and response modalities superimposed on the inflated hemispheres of a single subject (see Materials and Methods). Lateral views. vb, visual stimulation–button press; vc, visual stimulation–counting; ab, auditory stimulation–button press; ac, auditory stimulation–counting.. Cerebral Cortex Dec 1999, V 9 N 8 819.
(6) Figure 3. Average (n = 5) three-dimensional maps of BOLD signal increase for targets versus non-targets in all stimulation and response modalities superimposed on the inflated hemispheres of a single subject (see Materials and Methods). Medial views. The four conditions are coded as in Figure 2.. 820 Functional Neuroanatomy of Target Detection • Linden et al..
(7) Figure 4. Average (n = 5; 512 time points each) time-courses of the BOLD response during target epochs (T) and the preceding and following non-target (N) epochs. The examples are drawn from the SMA (a) and the frontal operculum (b).. preparation in cognitive tasks and the monitoring of task-relevant information (Carter et al., 1998). Target detection did not elicit a very strong differential response in unimodal sensory cortex. Some activation was obser ved in primary and secondary visual areas during the detection of visual targets. This activation might ref lect the attentive or pre-attentive modulation of early sensory processing, which has been suggested to occur already at the level of the striate cortex (Roelfsema et al., 1998; Tootell et al., 1998; Watanabe et al., 1998; Yen and Finkel, 1998; Gandhi et al., 1999). On the other hand, the activity of the the middle temporal gyrus, an area that has been implicated in the memory formation for auditory stimuli (Elger et al., 1997), that was observed in the counting condition of the auditory oddball paradigm might be related to the process of updating the auditory input sequence. It also seems that there was little activity that can be explained by specific effects of the response conditions. With regard to the button-press response, we modified the commonly used task requirements in order to make the paradigm suitable for fMRI. Subjects had to press a button whenever a stimulus appeared. One button coded for non-targets and another for targets. We still found a marked P300 effect for the rare targets, while avoiding the confound of finger movement-related activity that might be tolerable in scalp P300 applications, but had obscured the results of a number of earlier fMRI and source localization studies. The. activity of the postcentral gyrus in the button-press condition of the auditory oddball paradigm might ref lect the somatosensory component of the motor response, but no significant differential activation was observed in the motor cortex proper. An area extending from the angular gyrus to the intraparietal region, which might be involved in mental arithmetic [reviewed by Dehaene et al. (Dehaene et al., 1998b)], was activated bilaterally during the counting condition of the visual, but not of the auditory oddball paradigm. The localization of the components of the network for target detection in oddball tasks that is demonstrated by the present study matches lesion data (Knight et al., 1989) and some of the sites suggested by intracranial recordings as generators of the P3. Halgren et al. elicited triphasic peaks with a prominent P3 equivalent in the supramarginal gyrus of pre-surgical epilepsy patients using visual and auditory oddball paradigms (Halgren et al., 1995a). A similar effect could be obtained in the posterior cingulate gyrus with an auditory oddball task. In our experiment, activation was observed in the supramarginal gyrus bilaterally and consistently over all stimulus and response conditions (Table 2). The posterior cingulate, on the other hand, was significantly activated only during the silent counting of auditory oddballs (Table 2). In all of our conditions, except the button press to auditory rare targets, the anterior cingulate cortex (BA 32) was significantly activated (Table 2). This area was also found to be a generator of P3 waves in an intracranial evoked potential study that employed only an auditory oddball task (Baudena et al., 1995). However, the activity of other areas that have been identified as generators of the intracranial P3 to rare auditory and visual stimuli, most notably the hippocampal complex (Halgren et al., 1995b), did not reach significance in the group analysis of our fMRI data. This lack of hippocampal activation might ref lect differences in the sensitivity of the two methods. As suggested by McCarthy et al., possible differences between the fMRI activation pattern and that of the intracranial electric recording might be explained by differences in the underlying patterns of neuronal activity (McCarthy et al., 1997). While the P300 component of ERPs ref lects a transient synchronized synaptic activity that occurs only for a brief period (from 300 to 500 ms post-stimulus, depending on stimulus modality), the changes in the BOLD response might be brought about by a prolonged sustained activity of the target detection network that is not revealed in the evoked electric or magnetic field because it is not time-locked or because the fields generated in the neurons are not similarly oriented. fMRI at high temporal resolution (Menon and Kim, 1999), preferably in conjunction with EEG/MEG recordings and a combination of both modalities for source analysis (Scherg et al., 1999), is required in order to test this hypothesis. Our study confirms the finding of previous fMRI studies that target detection in oddball tasks is related to BOLD signal increases in the supramarginal gyrus (Dierks et al., 1997; McCarthy et al., 1997; Menon et al., 1997) and other inferior parietal areas (McCarthy et al., 1997) and in frontal midline areas (Dierks et al., 1997; Menon et al., 1997). However, none of the previous studies reported activity in the frontal operculum and the insula. This might be explained by the limitation of image acquisition to selected brain areas in these studies. The present study shows that whole-brain event-related fMRI can make an important contribution to the identification of the target detection network in the brain of healthy subjects. While the clarification of the nature of the correspondence between the BOLD signal increase in oddball conditions and the intra-. Cerebral Cortex Dec 1999, V 9 N 8 821.
(8) cranial and scalp P300 is the most immediate issue, one should also consider the use of event-related fMRI to supplement the numerous studies on the subcomponents of the P300 wave and their functional significance in the normal and pathological brain.. Notes This study was supported by the Alzheimer Research Centre, Frankfurt am Main, Germany and Alzheimer Forschungs-Initiative e.V. Address correspondence to Dr David E.J. Linden, Department of Psychiatry I, Division of Clinical Neurophysiology, Heinrich-HoffmannStraße 10, DE-60528 Frankfurt am Main, Germany. Email: linden@ mpih-frankfurt.mpg.de.. References Arthur DL, Starr A (1994) Task-relevant late positive component of the auditor y event-related potential in monkeys resembles P300 in humans. Science 223:186–188. Basile LFH, Rogers RL, Simos PG, Papanicolaou AC (1997) Magnetoencephalographic evidence for common sources of long latency fields to rare target and rare novel visual stimuli. Int J Psychophysiol 25:123–137. Baudena P, Halgren E, Clarke JM, Heit G, (1995) Intracerebral potentials to rare target and distractor auditory and visual stimuli: 3. Frontal cortex. Electroenceph Clin Neurophysiol 94:251–264. Carter CS, Braver TS, Barch DM, Botvinick MM, Noll D, Cohen JD (1998) Anterior cingulate cortex, error detection, and the online monitoring of performance. Science 280:747–749. Davies MG, Rowan MJ, MacMathuna P, Keeling PW, Weir DG, Feely J (1990) The auditor y P300 event-related potential: an objective marker of the encephalopathy of chronic liver disease. Hepatology 12:688–694. Dehaene S, Kerszberg M, Changeux JP (1998a) A neuronal model of a global workspace in effortful cognitive tasks. Proc Natl Acad Sci USA 95:14529–14534. Dehaene S, Dehaene-Lambertz G, Cohen L (1998b) Abstract representations of numbers in the animal and human brain. Trends Neurosci 21:355–361. Dierks T, Maurer K (1990) Reference-free evaluation of auditory evoked potentials – P300 in aging and dementia. In: Early markers in Parkinson’s and Alzheimer’s disease (Dostert P, Riederer P, Strolin Benedetti M, Roncucci R, eds), pp. 197–208. Vienna: Springer-Verlag. Dierks T, Khorram-Sefat D, Horn H, Syed N, Hacker H, Maurer K (1997) Functional magnetic resonance imaging (fMRI) of the auditory cortex during acoustical stimulation: a comparison to electrophysiological localization of late AEP. Electroenceph Clin Neurophysiol 103:42P. Dierks T, Linden DEJ, Jandl M, Formisano E, Goebel R, Lanfermann H, Singer W (1999) Activation of Heschl’s gyrus during auditor y hallucinations. Neuron 22:615–621. Elger CE, Grunwald T, Lehnertz K, Kutas M, Helmstaedter C, Brockhaus A, Van Roost D, Heinze HJ (1997) Human temporal lobe potentials in verbal learning and memory processes. Neuropsychologia 35:657–67. Fylan F, Holliday IE, Singh KD, Anderson SJ, Harding GF (1997) Magnetoencephalographic investigation of human cortical area V1 using color stimuli. NeuroImage 6:47–57. Gandhi SP, Heeger DJ, Boynton GM (1999) Spatial attention affects brain activity in human primar y visual cortex. Proc Natl Acad Sci USA 96:3314–3319. Goebel R, Khorram-Sefat D, Muckli L, Hacker H, Singer W (1998a) The constructive nature of vision: direct evidence from functional magnetic resonance imaging studies of apparent motion and motion imagery. Eur J Neurosci 10:1563–1573. Goebel R, Linden DEJ, Lanfermann H, Zanella FE, Singer W (1998b) Functional imaging of mirror and inverse reading reveals separate coactivated networks for oculomotion and spatial transformations. NeuroReport 9:713–719. Goodin DS, Squires KC, Starr A (1978) Long latency event-related components of the auditor y evoked potential in dementia. Brain 101:635–648. Halgren E, Baudena P, Clarke JM, Heit G, Liegeois C, Chauvel P, Musolino A (1995a) Intracerebral potentials to rare target and distractor auditory and visual stimuli: 1. Superior temporal plane and parietal lobe. Electroenceph Clin Neurophysiol 94:191–220.. 822 Functional Neuroanatomy of Target Detection • Linden et al.. Halgren E, Baudena P, Clarke JM, Heit G, Marinkovic K, Devaux B, Vignal J, Birabin A (1995b) Intracerebral potentials to rare target and distractor stimuli: 2. Medial, lateral and posterior temporal lobe. Electroenceph Clin Neurophysiol 94:229–250. Halgren E, Marinkovic K, Chauvel P (1998) Generators of the late cognitive potentials in auditor y and visual oddball tasks. Electroenceph Clin Neurophysiol 106:156–164. Holmes A, Poline JB, Friston K (1997) Characterising brain images with the general linear model. In: Human brain function (Frackowiak RSJ, Friston K, Frith CD, Dolan RJ, Mazziotta JC, eds), pp. 59–84. San Diego: Academic Press. Knight RT (1990) Neural mechanisms of event-related potentials: evidence from human lesion studies. In: Event-related brain potentials: basic issues and applications (Rohrbaugh JW, Parasuraman R, Johnson R Jr, eds), pp. 3–18. New York: Oxford University Press. Knight RT, Nakada T (1998) Cortico-limbic circuits and novelty: a review of EEG and blood f low data. Rev Neurosci 9:57–70. Knight RT, Scabini D, Woods DL, Clayworth CC (1989) Contributions of temporo-parietal junction to the human auditory P3. Brain Res 502:109–116. Lehmann D, Skrandies W (1980) Reference-free identification of components of checkerboard-evoked multichannel potential fields. Electroenceph Clin Neurophysiol 48:609–621. McCarthy G, Luby M, Gore J, Goldman-Rakic P (1997) Infrequent events transiently activate human prefrontal and parietal cortex as measured by functional MRI. J Neurophysiol 77:1630–1634. Mecklinger A, Maess B, Opitz B, Pfeifer E, Cheyne D, Weinberg H (1998) A MEG analysis of the P300 in visual discrimination tasks. Electroenceph Clin Neurophysiol 108:45–56. Menon RS, Kim S-G (1999) Spatial and temporal limits in cognitive neuroimaging with fMRI. Trends Cogn Sci 3:207–216. Menon V, Ford JM, Lim KO, Glover GH, Pfefferbaum A (1997) Combined event-related fMRI and EEG evidence for temporal-parietal cortex activation during target detection. NeuroReport 8:3029–3037. Oades RD, Walker MK, Geffen LB, Stern LM (1988) Event-related potentials in autistic and healthy children on an auditor y choice reaction time task. Int J Psychophysiol 6:25–37. O’Connor T, Starr A (1985) Intracranial potentials correlated with an event-related potential, P300, in the cat. Brain Res 339:27–38. Paller K A, Zola-Morgan S, Squire L, Hillyard SA (1988) P3-like wave in normal monkeys and in monkeys with medial temporal lobe lesions. Behav Neurosci 102:714–725. Paller K A, McCarthy G, Roessler E, Allison T, Wood CC (1992) Potentials evoked in human and monkey medial temporal lobe during auditory and visual oddball paradigms. Electroenceph Clin Neurophysiol 84:269–279. Paus T, Koski L, Caramanos Z, Westbury C (1998) Regional differences in the effects of task difficulty and motor output on blood f low response in the human anterior cingulate cortex: a review of 107 PET activation studies. NeuroReport 9:R37–47. Pfefferbaum A, Horvath TB, Roth WT, Kopell BS (1979) Event-related potential changes in chronic alcoholics. Electroenceph Clin Neurophysiol 47:637–647. Picton T (1992) The P300 wave of the human event-related potential. J Clin Neurophysiol 9:456–479. Polich J (1990) P300, probability, and interstimulus interval. Psychophysiology 27:396–403. Polich J, Brock T, Geisler MW (1991) P300 from auditor y and somatosensory stimuli: probability and inter-stimulus interval. Int J Psychophysiol 11:219–223. Pritchard W (1986) Cognitive event-related potential correlates of schizophrenia. Psychol Bull 100:43–66. Pritchard WS, Krieble KK, Duke DW (1996) Application of dimension estimation and surrogate data to the time evolution of EEG topographic variables. Int J Psychophysiol 24:189–195. Puce A, Kalnins RM, Berkovic SF, Donnan GA, Bladin PF (1989) Limbic P3 potentials, localization and surgical pathology in temporal lobe epilepsy. Ann Neurol 26:377–385. Ritter W, Vaughan Jr HG, Costa LD (1968) Orienting and habituation to auditor y stimuli: a study of short-term changes in average evoked responses. Electroenceph Clin Neurophysiol 25:550–556. Ritter W, Vaughan HG (1969) Average evoked responses in vigilance and discrimination: a reassessment. Science 164:326–328. Rodin E (1991) P3 latency determination by global field power in normal subjects. J Clin Neurophysiol 8:88–94..
(9) Roelfsema PR, Lamme VA, Spekreijse H (1998) Object-based attention in the primar y visual cortex of the macaque monkey. Nature 395:376–381. Scherg M, Linden DEJ, Muckli L, Roth R, Drüen K, Ille N, Zanella FE, Singer W, Goebel R (1999) Combining MEG with fMRI in studies of the human visual system. Adv Biomagnet (in press). Smith DBD, Donchin E, Cohen L, Starr A (1970) Auditor y averaged evoked potentials in man during seletive binaural listerning. Electroenceph Clin Neurophysiol 28:146–152. Smith ME, Halgren E, Sokolik M, Baudena P, Musolino A, Liegeois-Chauvel C, Chauvel P (1990) The intracranial topography of the P3 eventrelated potential elicited during auditory oddball. Electroenceph Clin Neurophysiol 76:235–248. Squires KC, Wickens C, Squires NK, Donchin E (1976) The effect of stimulus sequence on the waveform of the cortical event-related potential. Science 139:1142–1146. Strik WK, Dierks T, Franzek E, Stober G, Maurer K (1994) P300 in schizophrenia: interactions between amplitudes and topography. Biol Psychiat 35:850–856.. Sutton S, Braren M, Zubin J, John ER (1965) Evoked potential correlates of stimulus uncertainty. Science 150:1187–1188. Talairach J, Tournoux P (1988) Co-planar stereotaxic atlas of the human brain. New York: Thieme. Tootell RB, Hadjikhani N, Hall EK, Marrett S, Vanduffel W, Vaughan JT, Dale AM (1998) The retinotopy of visual spatial attention. Neuron 21:1409–1422. Vaughan HG, Ritter W (1970) The sources of auditory responses recorded from the human scalp. Electroenceph Clin Neurophysiol 28:360–367. Watanabe T, Sasaki Y, Miyauchi S, Pütz B, Fujimaki N, Nielsen M, Takino R, Miyakawa S (1998) Attention-regulated activity in human primary visual cortex. J Neurophysiol 79:2218–2221. Yamaguchi S, Knight RT (1991) Anterior and posterior association cortex contributions to the somatosensory P300. J Neurosci 11:2039–2054. Yamaguchi S, Knight RT (1992) Effects of temporal-parietal lesions on the somatosensor y P3 to lower limb stimulation. Electroenceph Clin Neurophysiol 84:139–148. Yen SC, Finkel LH (1998) Extraction of perceptually salient contours by striate cortical networks. Vis Res 38:719–741.. Cerebral Cortex Dec 1999, V 9 N 8 823.
(10)
Figure

Documents relatifs
