doi:10.1017/S1751731108003212
Variability of selected trace elements of different meat cuts
determined by ICP-MS and DRC-ICPMS
N. Gerber
1-, R. Brogioli
2, B. Hattendorf
2, M. R. L. Scheeder
3, C. Wenk
1and D. Gu¨nther
21Institute of Animal Science, Nutrition Biology, ETH Zurich, 8092 Zurich, Switzerland;2Laboratory for Inorganic Chemistry, ETH Zurich, 8093 Zurich, Switzerland; 3Swiss College of Agriculture, 3052 Zollikofen, Switzerland
(Received 28 January 2008; Accepted 7 July 2008; First published online 23 September 2008)
The aim of this study was to determine the levels of cadmium, lead, iron, zinc, selenium, manganese, copper and molybdenum in different cuts of beef, pork, lamb, chicken and foal collected from supermarkets and butcheries in Switzerland. The
concentrations of manganese, copper, molybdenum, zinc, iron, selenium, cadmium and lead were determined by inductively coupled plasma mass spectrometry (ICP-MS) after microwave digestion. Mean values and their respective coefficients of variation were calculated from the measured concentrations. The concentrations found for cadmium and lead ranged from 0.6 to 3.9 mg/100 g and 1.0 to 2.1 mg/100 g, respectively. Concentrations ranged between 0.5 and 3.3 mg/100 g for iron, 0.7 and 5.1 mg/100 g for zinc, 9 and 44 mg/100 g for selenium, 3.1 and 16.7 mg/100 g for manganese, 0.3 and 132 mg/100 g for copper and 0.9 and 3.2 mg/100 g for molybdenum. Differences found for the concentrations in meat from different species as well as between the individual meat cuts were notable for iron, zinc, selenium and copper. Manganese concentrations were found to vary unsystematically within muscles and species. Molybdenum concentrations were higher in chicken meat in comparison with the mammalian meats. The highest coefficients of variation were found for manganese (13% to 142%) and copper (13% to 224%), while the lowest was found for zinc (4% to 45%). In conclusion, in order to provide an accurate overview and to be able to calculate reliable dietary intakes, it is important to include the variability in food composition data.
Keywords: meat, trace elements, variability, microwave digestion, ICP-MS
Introduction
Meat is known as an excellent source of essential trace ele-ments such as iron (Fe), zinc (Zn) and selenium (Se) (Briggs and Schweigert, 1990). The accurate determination of these elements is therefore important in nutrition studies, particularly because meat, as a biological material, exhibits natural var-iations in the amounts of nutrients contained (Greenfield and Southgate, 2003). This variability can be increased due to the different animal husbandry and feeding systems applied. Therefore, it is essential that nutrient data, including trace element contents, are regularly updated to reflect the current data situation and to monitor possible changes. Furthermore, there is little data available concerning the variability of nutrients, including trace elements in meat, since in most food composition tables only mean values are declared (Pennington et al., 1995). Also, only limited information exists on nutrients in lean meat, which may vary to a greater extent than the
nutrient composition of other food items. These data could be helpful in judging the value of nutrient composition data as a base for dietary recommendations (Leonhardt and Wenk, 1997).
Of comparable interest in the field of nutritional tox-icology is the determination of certain elements like cad-mium (Cd) and lead (Pb) (Bouet al., 2004). In recent years, much attention has been focused on the concentration of heavy metals in meat, meat products and other food in order to check for the effects of those hazardous on human health (Abou-Arab, 2001; Moeller et al., 2003; Celik and Oehlenschla¨ger, 2004). After extensive studies on food additives and their toxicity, the World Health Organization (WHO) has concluded that even low levels of certain metals, such as lead and cadmium, can cause disease in humans (WHO, 2000 and 2001). This is due to the capacity of these metals to accumulate in living organisms. Lead, for example, bio-accumulates in the food chain from plants to animals, but its concentration in food also generally increased during the last few decades (Halliwellet al., 2000). Cadmium has a long residence time in human tissues (10 to 40 years),
-Present address: Institute of Animal Science, ETH Zurich, Universita¨tstr. 2, 8092 Zurich, Switzerland. E-mail: [email protected]
especially in the kidneys (Rubioet al., 2006); thus, it is of the outmost importance to monitor lead and cadmium content in the diet.
The aim of the present study, therefore, was to examine the concentration of essential elements like manganese (Mn), copper (Cu), molybdenum (Mo), Zn, Fe and Se, as well as the potentially hazardous elements Cd and Pb in different com-mercially available meat cuts with a particular focus on the variability of these trace elements.
Material and methods Samples
Meat cuts were purchased from local supermarkets and butcheries in order to consider different origins in terms of production system (meat labels) and anatomical location: beef (sirloin, rib-eye and braising steak), pork (neck steak, chop and loin), lamb (chop and loin), chicken (breast with and without skin and leg with skin) and foal (sirloin and filet). Beef, pork and lamb samples were purchased in two series, from June to August 2004 and from October to December 2004. Foal and chicken samples were purchased from January to March 2005. All samples were cut out of the center of the pieces of fresh meat with a ceramic knife to avoid contamination with trace metals. Samples were vacuum packaged, frozen at 2188C and stored until ana-lysis. Two standard reference materials (SRM 1546 Meat Homogenate and SRM 1577b Bovine Liver) from the National Institute of Standards and Technology (NIST) were prepared to test the accuracy of methods.
Sample digestion procedure
In order to determine the mentioned trace elements, a closed quartz vessels and microwave oven (MLS Ethos, MLS-GmbH, Leutkirch, Germany) digestion procedure was applied. One gram of meat sample, and 500 or 250 mg of the certified reference materials SRM 1546 or SRM 1577b, respectively, were accurately weighed into quartz digestion vessels. Two milliliters of hydrogen peroxide (H2O230% pro analysi, Merck, Darmstadt, Germany) and 8 ml nitric acid 65% (HNO3 suprapur, Merck, Darmstadt, Germany) were added to each tube, which was then closed. For the spiking test, an appropriate amount of all measured elements (Mn, Cu, Mo, Cd, Pb, Fe and Se) was also added. Digestion was conducted by applying a four-step program as follows: 250 W for 4 min, then 3 min at 350 W followed by 450 W for 3 min and finally 3 min at 500 W. After the vessels had cooled down, the digests were transferred into 20 ml volumetric flasks and filled to the mark using purity water (obtained from a Q water purification system, Milli-pore, France). Prior to analysis, an aliquot of these samples was spiked with the internal standard solutions and diluted further by a factor of two. Within each digestion run, two samples were randomly chosen for quality control mea-surements. One sample was digested in duplicate to check for reproducibility of the digestion and analysis, while the other sample was spiked with known concentrations of the
elements measured before digestion to monitor potential analyte losses during digestion and further sample pre-paration. Furthermore, one digestion blank was prepared by the same procedure, which contained only the chemicals used for digestion without a sample. The reference mate-rials NIST SRM 1577d (bovine liver, certified values for Mn, Fe, Cu, Zn, Se, Mo, Cd and Pb) and 1546 (meat homo-genate, certified values for Mn, Cu and Zn) were used to verify the accuracy of the digestion and calibration protocol. Determination of manganese, copper, molybdenum, cadmium and lead concentration by inductively coupled plasma mass spectrometry (ICPMS)
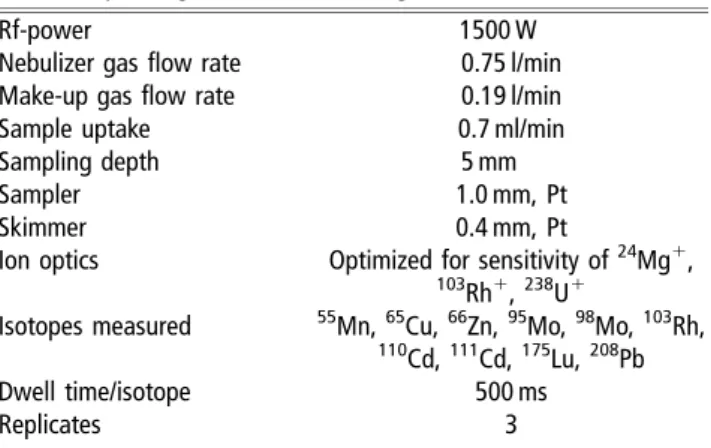
This suite of elements was analyzed in an early session using an Agilent 7500cs ICPMS (Agilent Technologies, Waldbronn, Germany) in normal operation mode. For sample introduction, the instrument was equipped with a quartz concentric nebu-lizer and spray chamber. The solutions were introduced to the nebulizer by a peristaltic pump at a flow rate of 0.7 ml/min. The operating parameters of the instrument were adjusted daily for optimum sensitivity, while keeping the formation of refractory oxides formed within the ICP to a minimum (that is CeO1/Ce1,0.5%) to avoid excessive spectral interferences. Typical operating conditions are listed in Table 1. All element concentrations were determined against external calibration using synthetic acidic multielement calibration standards. The accuracy of the calibration was assessed by analyzing the certified reference materials NIST SRM 1577 and 1546. In all cases, the measured concentrations in the reference materials were within 10% of the certified values. Repeatability of the duplicate samples was between 2% for concentrations higher than three times the limit of quantification (concentration equivalent to 10 times the standard deviation of the blank measurements) and 50% for samples that were close to the limit of detection. Spike recoveries typically varied between 88% and 100%. The limits of quantification were as follows: Mn 0.05 mg/kg, Cu 0.1 mg/kg, Zn 0.5 mg/kg, Mo 0.005 mg/kg, Cd 0.001 mg/kg and Pb 0.001 mg/kg (note that instrumental limits of detection were at least an order of magnitude lower). To compensate for nonspectral matrix effects, two internal standards were employed. Rh was used for Mn, Cu, Zn, Mo and Cd and Lu for Pb.
Table 1Operating condition for the Agilent 7500 cs ICPMS
Rf-power 1500 W
Nebulizer gas flow rate 0.75 l/min Make-up gas flow rate 0.19 l/min
Sample uptake 0.7 ml/min
Sampling depth 5 mm
Sampler 1.0 mm, Pt
Skimmer 0.4 mm, Pt
Ion optics Optimized for sensitivity of24Mg1,
103Rh1,238U1
Isotopes measured 55Mn,65Cu,66Zn,95Mo,98Mo,103Rh, 110Cd,111Cd,175Lu,208Pb
Dwell time/isotope 500 ms
Determination of selenium and iron by dynamic reaction cell inductively coupled plasma mass spectrometry (ICP-DRC-MS)
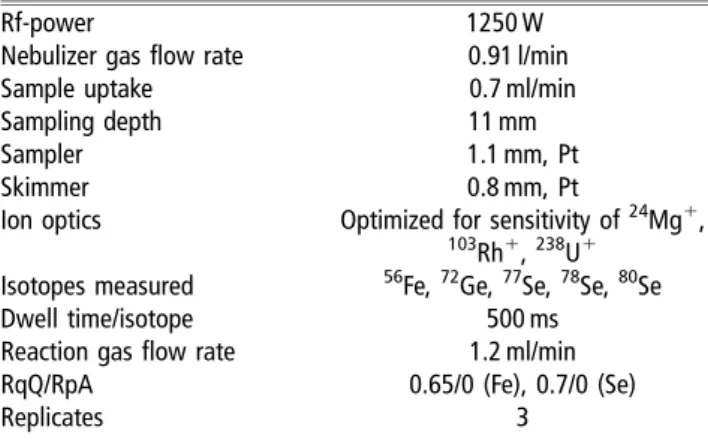
Owing to a high abundance of background ions from the ICP on the major isotopes of Se and Fe (Ar21 and ArO1, respectively), these elements cannot be determined inter-ference free by standard ICPMS. Thus, the trace and ultratrace determinations require suppression of these interferences. Dynamic reaction cell ICPMS allows the attenuation or even removal of these types of spectral interferences by selective ion molecule reactions before the ion population generated in the ICP is mass analyzed. In this study, an Elan 6100 DRCplus (PE/Sciex, Concord, Ontario) was used for the determination of Se and Fe. The instrument utilizes a quadrupole ion guide in a reaction chamber, where interferences and analytes may undergo reactive collisions with a gas. The quadrupole ion guide may furthermore be adjusted to reject ions from a specificm/zrange in order to avoid the formation of reaction products that may interfere with the analyte of choice. Methane, as the reaction gas, allows the suppression of the
dominating Ar21 and ArO1 interferences by six orders of magnitude through a charge exchange reaction, which does not occur for Se and Fe at a similar rate (Tanneret al., 2002; Hattendorf and Gu¨nther, 2003). The occurrence of poten-tially formed new polyatomic ions inside the dynamic reaction cell was tested and the formation of the adduct ion 64Zn(CH
4)1 was found to occur. This new interference on the isotope80Se, however, could be eliminated by adjusting the transmission properties of the dynamic reaction cell (i.e. the parameter RpQ). All other operating conditions were optimized to yield the highest signal/background ratio, especially for 80Se1, while minimizing the instrumental background. The same suite of samples as in the first sequence was analyzed using an identical quality control scheme, except for not analyzing NIST SRM 1546 that is not certified for Fe and Se. Repeatability for the duplicate samples was better than 8% in all cases. The limits of quantification were as follows: Fe 5 0.1 mg/kg and Se 5
40 mg/kg. The operating conditions are listed in Table 2. Results and discussion
The number of samples, mean values and coefficient of variation (CV) for all meat cuts analyzed for each animal species are shown in Tables 3–6. The results of this study represent average values of commercially available meat cuts in Switzerland.
Cadmium and lead
The results show a high variability (CV 5 58% to 127%) in cadmium concentrations for foal sirloin and filet as well as for lamb chop, which also has the highest cadmium value (Table 3). The remaining meat cuts had a mean cadmium concentration between 0.5 and 0.7 mg/100 g and lower CVs (2% to 34%). In comparison, the analyzed lead concentrations
Table 2Operating condition for the Elan 6100DRCplusICP-DRC-MS
Rf-power 1250 W
Nebulizer gas flow rate 0.91 l/min
Sample uptake 0.7 ml/min
Sampling depth 11 mm
Sampler 1.1 mm, Pt
Skimmer 0.8 mm, Pt
Ion optics Optimized for sensitivity of24Mg1, 103Rh1,238U1
Isotopes measured 56Fe,72Ge,77Se,78Se,80Se
Dwell time/isotope 500 ms
Reaction gas flow rate 1.2 ml/min
RqQ/RpA 0.65/0 (Fe), 0.7/0 (Se)
Replicates 3
Table 3Cadmium and lead levels in different meat cuts
Cd Pb Mean s.d. CV Mean s.d. CV Species Cut n (mg/100 g) (%) (mg/100 g) (%) Foal Sirloin 3 3.9 2.7 69 1.8 0.1 3 Filet 3 3.2 2.1 65 2.1 0.5 25 Lamb Chop 5 1.2 1.6 127 1.9 0.5 25 Loin 10 0.7 0.4 58 1.9 0.1 6
Chicken Breast with skin 3 0.5 0.01 2 1.8 0.1 3
Breast without skin 5 0.5 0.03 6 2.0 0.4 18
Leg with skin 5 0.6 0.2 35 1.8 0.1 5
Beef Sirloin CH 10 0.5 0.2 34 2.0 0.7 35
Sirloin US 3 0.6 0.003 0 1.9 0.1 6
Rib-eye CH 9 0.6 0.1 10 1.8 0.1 3
Rib-eye US 3 0.6 0.04 6 1.9 0.1 6
Braising steak 10 0.5 0.1 15 1.8 0.1 4
Pork Neck steak 9 0.6 0.1 8 1.8 0.1 3
Chop 11 0.6 0.1 15 1.8 0.1 5
Loin 11 0.6 0.1 13 1.8 0.1 4
were more consistent and varied between 1.8 and 2.0 mg/ 100 g with CVs ranging from 3% to 35%. Gonza´lez-Weller et al. (2006) found a much larger variability for cadmium and lead. They suggested that the variability in their sam-ples is considered normal since possible sources of this metal are numerous. However, they also indicated that lead and cadmium concentrations depend on environmental conditions and food production methods. Compared with the results of Gonza´lez-Weller et al. (2006), the mean concentrations for cadmium and lead in this study are higher, except for cadmium concentration in pork where the results are similar. Compared with other studies, the ana-lyzed lead concentrations are comparable to those mea-sured in Finland and Slovenia (Niemiet al., 1991; Doganoc, 1996), but were higher then those reported by Tahvonen and Kumpulainen (1994) and Hecht and Kumpulainen (1995) for beef and pork. Lead concentrations in horse meat were found to be lower by a factor of 0.5 compared with those determined by Hecht and Kumpulainen (1995). Cad-mium concentrations are higher compared with the last mentioned study but again with the exception of horse meat, which is found to be much lower in our study. The maximum lead and cadmium levels allowable in meat from different species are 100 and 50 mg/kg (EU Directive 466/ 2001). The analyzed concentrations of these metals in this work are all below these limits.
Iron and zinc
The iron concentration varied greatly among the species in this study (Table 4). Among the red meat, foal meat was characterized by the highest iron content. Lamb and beef showed a similar range of iron concentrations, from 1.6 mg/ 100 g determined in beef (sirloin US) to 2.6 mg/100 g deter-mined in lamb (loin). Markedly lower iron concentrations
were determined in pork and chicken meats. The iron con-centrations are in agreement with Hecht and Kumpulainen (1995), Chan et al. (1995) and Leonhardt and Wenk (1997). The last reference reported lower CVs (10% to 35%) com-pared with CVs for iron concentration in this study (15% to 93%). The main reason for the variability in the examined trace element content and its CVs might be that different breeds and feeding system arose in Switzerland in the last few years to comply with the provisions of a variety of meat labels that were established. Similar to our results, Schricker et al. (1982a) and Carpenter and Clark (1995) found that the iron concentrations varied between different cuts from the same species.
Therefore, it is important to draw interspecies compar-isons with the same cuts or muscles.
The zinc values showed that concentrations of this element vary even more than those of iron between the different muscles. Comparable findings are reported by several studies (Schricker et al., 1982b; Marchello et al., 1985; Hecht and Kumpulainen, 1995; Leonhardt and Wenk, 1997). Cassenset al. (1963) reported that the zinc content in various porcine muscles varied with color and myoglobin concentrations and that dark muscles had greater con-centrations of zinc than light ones; they also found increased concentrations of zinc in more active muscles. The measured values for zinc are similar to values reported by Leonhardt and Wenk (1997) and Hecht and Kumpulainen (1995) except for chicken breast, which was found to be lower than the results reported by the Hecht and Kumpu-lainen study, but in agreement with the results of Chan et al. (1995). The calculated CVs (4% to 45%) for zinc were the lowest in this study but higher compared with the value (7% to 18%) found by Leonhardt and Wenk (1997). Penningtonet al. (1995) reported CVs in the range of 10%
Table 4Iron and zinc levels in different meat cuts
Fe Zn Mean s.d. CV Mean s.d. CV Species Cut (mg/100 g) (%) (mg/100 g) (%) Foal Sirloin 3.2 1.3 40 2.7 1.1 39 Filet 3.3 0.8 24 2.0 0.4 20 Lamb Chop 2.0 0.7 36 2.3 0.4 15 Loin 2.6 1.1 40 2.4 0.4 15
Chicken Breast with skin 0.6 0.5 86 0.7 0.03 4
Breast without skin 0.5 0.2 49 0.7 0.03 5
Leg with skin 1.2 0.7 54 1.4 0.6 45
Beef Sirloin CH 2.0 0.6 29 3.7 0.7 18
Sirloin US 1.6 0.2 15 3.8 0.5 14
Rib-eye CH 1.8 0.8 44 5.1 1.4 27
Rib-eye US 2.5 0.8 32 4.2 0.6 15
Braising steak 1.7 0.7 39 3.2 0.8 26
Pork Neck steak 1.3 0.6 46 3.3 0.3 10
Chop 0.7 0.7 93 1.5 0.2 11
Loin 0.7 0.6 75 1.5 0.2 14
to 24% for zinc in different cooked meat cuts. Only two CVs for zinc in this study were above this value, foal sirloin (39%) and chicken leg with skin (45%). A possible expla-nation for the mainly low CVs of zinc could be that the tissue concentration of this element is primarily genetically determined and is only slightly influenced by feed compo-sition (Flachowsky and Jahreis, 1995).
Selenium
Se is not considered essential for plant growth, and plants do not control Se uptake (Ellis and Salt, 2003). Conse-quently, Se concentrations in plants generally reflect the concentration and availability of Se in soils (Combs, 2000; Hintzeet al., 2001), which vary greatly depending on the presence of underlying Se-containing geologic formations (Kabata-Pendias, 1998). Therefore, animals raised using low-Se feedstuffs deposit relatively low concentrations of this element in their tissues, while animals raised on a diet high in Se yield food products with a higher Se con-centration. Due to the needs of livestock for Se to prevent debilitating deficiency syndromes, Se (still usually in the form of sodium selenite) is commonly used as a feed sup-plement in commercial animal agriculture in many parts of the world (Combs, 2001). This practice became widespread in Switzerland within the last 25 years and thereby meat has become a constant and an important Se source. The mean Se concentration, reported in Table 5, was higher than reported by Haldimann et al. (1999). This indicates that Se as a feed supplement is used more extensively than 6 years before. When comparing the Se concentrations with data of established food composition tables, similar results are reported by Chan et al. (1995) for beef, pork and chicken. Souci et al. (2000) recorded lower Se concentra-tions for beef, foal and lamb but comparable concentraconcentra-tions for chicken. US Beef had the highest selenium concentration (30 and 44 mg/100 g), around three to four times higher than Swiss beef. The main reason is the higher Se con-centration in soil combined with the practice of transferring beef cattle to feedlots before slaughter, and while there, feeding them a defined diet supplemented with Se (Keck and Finley, 2006). The CV for this element recorded in this study ranged from 13% to 82% within species and cut due to the influence of feedstuff and supplements. For beef, the CVs for Se concentration vary between 65% and 82% in the Swiss cuts compared with the US beef with CVs of 20%. In the last few years, organically raised beef increased in popularity in Switzerland. As these animals do not get any mineral supplements, the Se concentration will depend on the natural supply and therefore on the availability according to the geographic origin.
Manganese, copper and molybdenum
The measured manganese concentrations are lower than the values reported by Souciet al. (2000) but also show, as well, a high unsystematic variation between animal species and different cuts (Table 6). On the contrary, Chan et al. (1995) reported mean values for Mn, which have a similar
order of magnitude but show a lower variation. However, there are also studies that show similar Mn concentrations and variations (Hecht and Kumpulainen, 1995). The high variability (13% to 142%) for this element indicates that Mn is affected, for example, by different feeding systems. On the other hand, homeostatic mechanisms maintain most tissue manganese concentration within certain limits (National Research Council, 2000).
The copper concentrations of chicken meat differed markedly from the other meat cuts analyzed, in which much higher concentrations are found. The concentrations in meat cuts from lamb, beef and pork are in good agreement with the values reported by Hecht and Kumpulainen (1995) and Lombardi-Boccia et al. (2005). However, concentra-tions in horse meat reported by Hecht and Kumpulainen (1995) are twice as high compared with the study of Lombardi-Boccia et al. (2005) and with ours. In the food composition table of Souciet al. (2000), Cu concentrations are six to ten times higher and differ between muscles to a greater extent than in the present study. The within-CV of the various cuts, which is not provided by the food composition tables cited, differed greatly (13% to 224%), with the highest variability for the chicken meat. As with zinc and iron, copper concentrations in meat can vary in the different types of muscle. In cattle, it has been demon-strated that copper concentrations in muscle are inversely related to muscle lipid concentrations (Langlands et al., 1987).
Molybdenum concentrations in meat are very interesting since these results show that chicken meat (2.4 to 3.2 mg/ 100 g) contains around twice as much as mammalian meat. This is similar to the study of Hecht and Kumpulainen (1995) who found even greater differences due to lower Mo concentrations in beef and pork meat and higher values for
Table 5Selenium levels in different meat cuts
Se Mean s.d. CV Species Cut n (mg/100 g) (%) Foal Sirloin 3 35 16 47 Filet 3 28 9 30 Lamb Chop 5 11 4 40 Loin 10 11 8 76
Chicken Breast with skin 3 12 2 13
breast without Skin 5 19 6 32
Leg with skin 5 28 5 19
Beef Sirloin CH 10 9 8 82
Sirloin US 3 30 6 20
Rib-eye CH 9 11 7 65
Rib-eye US 3 44 9 21
Braising steak 10 10 7 67
Pork Neck steak 9 16 5 30
Chop 11 17 11 66
Loin 11 16 5 30
chicken meat, compared with this study. Only a few figures for Mo concentrations can be found in the food composition table of Souciet al. (2000) for meat and they are up to ten times higher than reported by Hecht and Kumpulainen (1995) and found in the present study. In other food com-position tables, Mo is not listed. The CV of molybdenum ranged from 2% to 63% and was therefore the third lowest of all trace elements analyzed in this study.
Essentiality v.toxicity
Essential trace elements are those compounds that need to be present in the human diet to maintain normal physio-logical functions. Risk assessment of trace elements has examined two ends of the toxicity-deficiency spectrum: that associated with intakes that are too high and results in toxicity and that associated with intakes that are too low and results in nutritional deficiency problems (Goldhaber, 2003). Meat is known to be a source of trace elements but has, as well, been discussed in terms of accumulating heavy metals such as cadmium and lead. Several studies have been carried out with respect to the contribution of meat consumption towards fulfilling the requirements for several essential trace elements (Leonhardtet al., 1997; Haldimann et al., 1999; Chanson et al., 2003; Lombardi-Bocciaet al., 2005). While toxic concentrations of essential elements in muscle are generally rare, offal, such as liver and kidney, often accumulate higher metal concentrations. The US Food and Drug Administration (FDA) has defined a tolerable upper intake level (UL) for the essential trace elements. The UL is the maximum level of total chronic daily intake of a nutrient (from all sources) judged to be unlikely to pose a risk of adverse health effects to humans (Scientific Com-mittee on Food, 2006). Concentrations in the meat cuts analyzed in this study are far below the ULs for all trace
elements. The results suggest that, at present, there is no need to recommend restrictions for the human consumption of meat marketed in Switzerland.
Conclusion
Taken together, the present results indicate that cadmium and lead concentrations in meat are very low and are unlikely to contribute significantly to the daily intake of these toxic elements.
The average concentrations of essential trace elements in the examined meat are generally comparable to those reported by other studies. The content in individual samples, however, may appreciably deviate from the mean values due to effects associated with animal feeding practices and concentrations in the feed. The impact of the different elements’ variability depends on their distribution in food. Nutrient variability is of more practical significance when it occurs in foods that are relied upon as sources of specific nutrients. If nutrient values are not reliable, because of high variation, dietary intakes calculated from mean values may be unreliable. Therefore, it is important to provide the possible variation to better estimate the uncertainty of dietary intakes, which should better be reported as a range than as a single value. Furthermore, trace element data in food composition tables were found to be sometimes incomplete especially for Se and Mo. Therefore, it is important to update and emphasize food composition tables with actual data.
Acknowledgment
This study was supported by the Proviande, the Hermann Herzer Foundation, Switzerland.
Table 6Manganese, copper and molybdenum levels in different meat cuts
Mn Cu Mo
Mean s.d. CV Mean s.d. CV Mean s.d. CV
Species Cut (mg/100 g) (%) (mg/100 g) (%) (mg/100 g) (%)
Foal Sirloin 5.7 4.0 71 90.0 17.3 19 1.1 0.5 42
Filet 10.6 5.7 54 114 15 13 1.4 0.7 54
Lamb Chop 16.7 15.1 90 110 34 31 1.1 0.3 27
Loin 16.0 13.0 81 132 28 22 1.1 0.5 48
Chicken Breast with skin 4.3 0.6 13 4.8 4.3 89 2.4 0.1 2
Breast without skin 7.9 2.3 30 0.3 0.7 224 3.2 1.2 38
Leg with skin 16.6 13.4 81 17.6 16.4 93 2.8 0.3 11
Beef Sirloin CH 5.6 4.2 75 49.8 27.9 56 0.9 0.5 63
Sirloin US 10.8 2.0 19 77.5 10.0 13 1.4 0.01 2
Rib-eye CH 6.9 6.1 89 56.4 38.8 69 1.5 0.6 45
Rib-eye US 9.8 1.6 16 76.5 11.2 15 1.4 0.1 7
Braising steak 3.1 4.4 142 37.5 30.7 82 1.1 0.7 67
Pork Neck steak 12.8 6.4 50 92.0 36.0 39 2.0 0.8 40
Chop 6.2 4.7 76 35.9 23.8 66 1.3 0.6 50
Loin 6.3 4.0 63 40.5 23.0 57 1.1 0.5 44
References
Abou-Arab AAK 2001. Heavy metal content in Egyptian meat and the role of detergent washing on their levels. Food and Chemical Toxicology 39, 593–599.
Bou R, Guardiola F, Padro´ A, Pelfort E and Codony R 2004. Validation of mineralisation procedures for the determination of selenium, zinc, iron and copper in chicken meat and feed samples by ICP-AES and ICP-MS. Journal of Analytical Atomic Spectrometry 19, 1361–1369.
Briggs GM and Schweigert BS 1990. An overview of meat in the diet. Advances in meat research 6, 1–18. Elsevier Applied Science, New York, USA. Carpenter CE and Clark E 1995. Evaluation of methods used in meat iron analysis and iron content of raw and cooked meats. Journal of Agricultural and Food Chemistry 43, 1824–1827.
Cassens RG, Briskey EJ and Hoekstra WG 1963. Variation in zinc content and other properties of various porcine muscles. Journal of the Science of Food and Agriculture 14, 427–432.
Chan W, Brown J, Lee SM and Buss DH 1995. Meat, poultry and game. McCane and Widdowson’s The Composition of Foods, 5th edition. The Royal Society of Chemistry, Cambridge, UK.
Chanson A, Brachet P, Grolier P and Rock E 2003. Micronutrient intakes from meat. Sciences des Aliment 23, 47–55.
Celik U and Oehlenschla¨ger J 2004. Determination of zinc and copper in fish samples collected from Northeast Atlantic by DPSAV. Food Chemistry 87, 343–347.
Combs GF Jr 2000. Food system-based approaches to improving micronutrient nutrition: the case for selenium. Biofactors 12, 39–43.
Combs GF Jr 2001. Selenium in global food systems. British Journal of Nutrition 85, 517–547.
Doganoc DZ 1996. Lead and cadmium concentrations in meat, liver and kidney of Slovenian cattle and pigs from 1989 to 1993. Food Additives and Contaminants 13, 237–241.
Ellis DR and Salt DE 2003. Plants, selenium and human health. Current Opinion in Plant Biology 6, 273–279.
Flachowsky G and Jahreis G 1995. Einflussmo¨glichkeiten der Tiererna¨hrung auf Inhaltsstoffe in Lebensmittel tierischer Herkunft. Lohmann Info January to April, 19–28.
Goldhaber SB 2003. Trace element risk assessment: essentiality vs. toxicity. Regulatory Toxicology Pharmacology 38, 232–242.
Gonza´lez-Weller D, Karlsson L, Caballero A, Herna´ndez F, Gutie´rrez A, Gonza´lez-Iglesias T, Marino M and Hardisson A 2006. Lead and cadmium in meat and meat products consumed by the population in Tenerife Island, Spain. Food Additives and Contaminants 23, 757–763.
Greenfield H and Southgate ADT 2003. Food composition data, 2nd edition. Food and Agriculture Organization of the United Nation, Rome.
Haldimann M, Dufosse K, Mompart A and Zimmerli B 1999. Vorkommen von Selen in Lebensmitteln tierischer Herkunft des Schweizer Marktes (Occurrence of selenium in food of animal origin on the Swiss market). Mitteilungen aus Lebensmitteluntersuchung und Hygiene 90, 241–281.
Halliwell D, Turoczy N and Stagnitti F 2000. Lead concentrations in Eucalyptus sp.in a small coastal town. Bulletin of Environmental Contamination and Toxicology 65, 583–590.
Hattendorf B and Gu¨nther D 2003. Strategies for method development for an inductively coupled plasma mass spectrometer with bandpass reaction cell. Approaches with different reaction gases for the determination of selenium. Spectrochimica Acta Part B – Atomic Spectroscopy 58, 1–13.
Hecht H and Kumpulainen J 1995. Essential and toxical elements in meat and eggs. Mitteilungsblatt der Bundesanstalt fuer Fleischforschung Kulmbach 34, 46–52.
Hintze KJ, Lardy GP, Marchello MJ and Finley JW 2001. Areas with high concentrations of selenium in the soil and forage produce beef with enhanced concentrations of selenium. Journal of Agricultural and Food Chemistry 49, 1062–1067.
Kabata-Pendias A 1998. Geochemistry of selenium. Journal of Environmental Pathology, Toxicology and Oncology 17, 173–177.
Keck AS and Finley JW 2006. Database values do not reflect selenium contents of grain, cereals, and other foods grown or purchased in the upper Midwest of the United States. Nutrition Research 26, 17–22.
Langlands JP, Donald GE and Smith AJ 1987. Analysis of data collected in a residue survey: copper and zinc concentrations in liver, kidney and muscle in Australian sheep and cattle. Australian Journal of Experimental Agriculture 27, 485–491.
Leonhardt M and Wenk C 1997. Variability of selected vitamins and trace elements of different meat cuts. Journal of Food Composition and Analysis 10, 218–224.
Leonhardt M, Kreuzer M and Wenk C 1997. Available iron and zinc in major lean meat cuts and their contribution to the recommended trace element supply in Switzerland. Nahrung 41, 289–292.
Lombardi-Boccia G, Lanzi S and Aguzzi A 2005. Aspects of meat quality: trace elements and B vitamins in raw and cooked meats. Journal of Food Composition and Analysis 18, 39–46.
Marchello MJ, Slanger WD and Milne DB 1985. Macro and micro minerals from selected muscles of pork. Journal of Food Science 50, 1375–1378. Moeller A, MacNeil SD, Ambrose RF and Que Hee SS 2003. Elements in fish of Malibu Creek and Malibu Lagoon neat Los Angeles, California. Marine Pollution Bulletin 46, 424–429.
National Research Council 2000. Mineral tolerance of domestic animals. National Academic of Science, Washington, DC.
Niemi A, Venalainen ER, Hirvi T, Hirn J and Karppanen E 1991. The lead, cadmium and mercury concentration in muscle, liver and kidney from Finnish pigs and cattle during 1987–1988. Zeitschrift fu¨r Lebensmittel-Untersuchung und -Forschung 192, 427–429.
Pennington JAT, Schoen SA, Salmon GD, Young B, Johnson RD and Marts RW 1995. Composition of core foods of the US Food Supply, 1982–1991. I. Sodium, phosphorus, and potassium. Journal of Food Composition and Analysis 8, 91–128.
Rubio C, Hardisson A, Reguera JI, Revert C, Lafuente MA and Gonza´lez-Iglesias T 2006. Cadmium dietary intake in the Canary, Islands, Spain. Environmental Research 100, 123–129.
Schricker BR, Miller DD and Stouffer JR 1982a. Measurement and content of nonheme and total iron in muscle. Journal of Food Science 47, 740–743.
Schricker BR, Miller DD and Stouffer JR 1982b. Content of zinc in selected muscles from beef, pork, and lamb. Journal of Food Science 47, 1020–1020.
Scientific Committee on Food 2006. Guidelines of the scientific committee on food for the development of tolerable upper intake levels for vitamins and minerals. Brussel, Belgium. European Commission, Health & Consumer Protection. Retrieved December 2004, from http://europa.eu.int/comm/food/ fs/sc/scf/out80a_en.pdf
Souci SW, Fachmann W and Kraut H 2000. Food composition and nutrition tables, 6th edition. Medpharm, Stuttgart.
Tahvonen R and Kumpulainen J 1994. Lead and cadmium contents in pork, beef and chicken, and in pig and cow liver in Finland during 1991. Food Additives and Contaminants 11, 415–426.
Tanner SD, Baranov VI and Bandura DR 2002. Reaction cells and collision cells for ICP-MS: a tutorial review. Spectrochimica Acta Part B – Atomic Spectroscopy 57, 1361–1452.
World Health Organisation (WHO) 2000. Lead. In Safety evaluation of certain food additives and contaminants. Fifty-third meeting of the Joint FAO/WHO Expert Committee on Food Additives (JECFA). Food Additives Series 44. WHO, Geneva, pp. 273–312.
World Health Organisation (WHO) 2001. Cadmium. In Safety evaluation of certain food additives and contaminants. Fifty-third meeting of the Joint FAO/ WHO Expert Committee on Food Additives (JECFA). Food Additives Series 46. WHO, Geneva, pp. 247–305.