Estimating phosphate removal in haemodialysis: an additional tool to quantify dialysis dose
8
0
0
Texte intégral
(2) 1038. difficult to achieve dietary phosphate restriction in patients with appropriate protein intake. In addition, phosphate-binding agents are not taken regularly. The problem to control phosphate absorption in a clinical setting is given in the following example: phosphate intake with liberal western diet is approximately 25–40 mmoluday (800–1200 mguday), with 60–86% absorption in the intestine [7]. Therefore, 15–35 mmol phosphate must be eliminated per day, equivalent to 35–82 mmol per thrice weekly HD. A 4-h high-flux HD removes approximately 30 mmol of phosphate per treatment [8]. Each mmol of phosphate in excess of that value requires four capsules (400 mg) of Ca2q-acetate [9], which may require an average of 48 capsules per day. This may lead to serious Ca2q overload. Surprisingly, control and quantification of phosphate removal by HD is underestimated [10]. However, enhanced phosphate removal by HD must not be dismissed and quantification of phosphate removed by dialysis is mandatory to analyse phosphate balance. Current approaches are cumbersome and the mechanistic structure of phosphate kinetic models is in debate. Dialysis efficiency is widely assessed by urea kinetic modelling, however, the increase in dialysis efficiency pushed forward by urea kinetics was made without considering possible limitations of other solute transport characteristics within the body. It is likely that an increase in efficiency accompanied by a reduction of treatment time will lead to pitfalls regarding other substances such as phosphate. Therefore, the aim of this study was to derive a simple statistical model predicting phosphate removal based on a minimum of concentration measurements. The model should be valid for a variety of treatment modalities and a standard dialysis population.. Subjects and methods This was a prospective, randomized study. It was divided in three parts: A, B, and C. Part A was designed to generate a phosphate model based upon data obtained in high-flux HD using three capillary dialysers with similar surfaces and standard treatment modes. The model was developed using stepwise multiple linear regression analysis considering phosphate removal as dependent variable and markers of potential clinical importance, such as plasma phosphate, effluent dialysate spot phosphate concentrations, KtuVurea and dialysis time, as predictor variables. Phosphate mass removal (MPO4) was assessed by partial dialysate collection. Parallel determinations of urea kinetics and urea removal were performed for comparisons. Seventy-seven per cent of the data were used for the model generation. The remaining 23% were used to test the precision of the model. In part B, the model generated in part A was further validated in a new data-set obtained in the same population using the same treatment mode except for a high-flux dialyser with a larger surface area. In part C, the model was tested in diabetic patients from another dialysis unit to rule out a centre effect, using the usual dialysate of this centre, a capillary high-flux dialyser with smaller surface area, and different blood flows.. J.-P. Gutzwiller et al.. Patients Patients enrolled in the first two study parts were selected from the HD unit of Aarau. This unit, with 12 000 dialyses a year, is one of the largest in Switzerland and covers about 7% of the Swiss population. Patients enrolled for study part C were selected from the HD unit in Liestal, covering another 5% of the Swiss population. All studied patients were at least one year on HD, stable, and well nourished. Absence of access recirculation was confirmed by monthly screening. Residual renal function was assumed as negligible. Patients gave written informed consent to participate in this study, which was in accordance with the Helsinki Declaration of 1975, as revised in 1983.. Study design Part A. Eighteen patients were selected to obtain the data set for developing the phosphate model. Haemodialysis was performed thrice weekly following the standard procedures at the first dialysis unit with an effective blood flow rate corrected for pre-pump blood pressure of 300 mlumin and a dialysate flow of approximately 500 mlumin using two H4008 (Fresenius Medical Care (FMC), Bad Homburg, Germany) dialysis machines. Ultra-pure bicarbonate buffered dialysate with Naq 140.0, HCO3 40.0, Mg2q 0.5 and Ca2q 1.5 mmolul was obtained by on-line filtration of mixed dialysate (Diasafe, FMC). Potassium concentration in the dialysate was between 1.0 and 2.0 mmolul according to plasma potassium concentrations. Dialysate did not contain glucose. Ultrafiltration rates and treatment times were prescribed according to clinical need (4 –5 h). Dialyser reuse was not practised. Data were obtained from a randomized, crossover design using three different high-flux dialysers with similar characteristics. Dialyser I: polyarylethersulfone 2.01 m2 (Arylane H9, Cobe, Hospal, Meyzieu, France); II: polyethylene 2.00 m2 (AM-FP-1000, Asahi Medical Co. Chyoda-ku, Tokyo, Japan); III: polysulfone 1.80 m2 surface area (HF 80, Fresenius AG, Bad Homburg, Germany). Phosphate and urea kinetic analyses were performed during the mid-week treatment (i.e. on a Wednesday or Thursday). Phosphate and urea removal were measured by partial dialysate and ultrafiltrate collection as described previously [11–15]. The collection system was calibrated before each study. The mean ratio ( fsVduVc) of total dialysate volume (Vd) to collected volume (Vc) was 24.9"0.02 (mean"SEM). The total amount of phosphate (MPO4) and urea (Mu) removed was determined by the sum of the solutes in dialysate and ultrafiltrate collected during the first, second, and subsequent treatment hours. In addition, a dialysate spot sample (cds, dialyser outlet) was taken 15, 60, 120, 180, and 240 min into the treatment and at the end of HD. Blood samples were drawn direct from the AV-fistula at the beginning and at the end of HD and from the arterial line in hourly intervals for the measurement of blood urea as well as plasma phosphate. Blood sampling at the end of HD was performed 5 min after the completion of treatment following the recommendations of the NKF-DOQI Clinical Practice Guidelines for Haemodialysis adequacy [16]. Part B. In this part, the 18 patients were treated and evaluated with the same schedule as in part A, except for a polysulfone dialyser with 2.4 m2 surface area, Dialyser IV (HdF 100S, Fresenius AG, Bad Homburg, Germany)..
(3) Phosphate removal in haemodialysis. Part C. Nine non-obese and stable diabetic patients gave written informed consent to be treated with the same schedule as in part A, except for a dialyser with 1.3 m2 surface area (Dialyser V, F60, Fresenius AG, Bad Homburg, Germany), a dialysate bath with 5.5 mmolul glucose and 38 mmolul bicarbonate. They were randomly treated in a crossover design with blood flow rates of 200, 250, and 300 mlumin.. Biochemistry Plasma was separated by centrifuge within 1 h after collection, phosphate was analysed in plasma and dialysate using an autoanalyser (Dimension RXL, Dade-Behring, Marburg, Germany) according to a modification of Fiske of the classic phosphomolybdate method after precipitation with lithium dodecylphosphate. Urea was measured in heparin-plasma and dialysate according to the ureaseglutamate dehydrogenase technique on the Dimension RLX. Coefficients of variation were less than 2.5%.. Calculations Total dialysate plus ultrafiltrate volume (Vd, in l) was calculated from the volume (Vc) obtained from partial dialysate collections and from the calibration factor ( f ) determined at the beginning of each study. Ultrafiltrate volume was calculated from patient’s weight reductions during dialysis; mass of urea and phosphate removed (Mu, MPO4) was calculated from the mean solute concentration in the collected dialysate and from Vd. Single pool KtuVurea was calculated using the secondgeneration formula of Daugirdas [17]. Data collected in this way were used for developing an equation by statistical modelling. Since phosphate mass removal was estimated at 2, 3, and 4 h, each 4-h treatment gave three data sets. Dialysis sessions lasting 5 h gave an additional data set.. Model Stepwise multiple linear regression was performed using independent treatment variables such as plasma and effluent dialysate phosphate concentrations to predict the amount of phosphate removed. The r2 was aimed to be about 0.9 in order to guarantee individual prediction.. 1039. Results Eighteen subjects of the population on HD of Aarau (74 patients) participated in study part A and were treated with dialysers I, II, and III, yielding 54 treatments. One treatment was excluded because the vascular access clotted, therefore, 53 treatments were available for the final analysis. In part B, the 18 treatments were evaluated. Nine patients were studied in part C, each with the same filter V at three different blood flows, yielding 27 treatments. One patient missed one study because of acute pancreatitis, three measurements were discontinued because of technical problems and an error in the dialysate bath composition, leaving 23 treatments for final analysis.. Part A—model generation Physical and treatment characteristics of the study group were representative of the remaining dialysis population (Table 1). There was no difference between groups except for a lower frequency for diabetes (28.5% vs 46.6%) and a lower pre-dialysis phosphate concentration (1.44 vs 1.68 mmolul, P-0.01) in the study group. Treatment characteristics as well as urea (Mu) and phosphate mass removal (MPO4) for dialysers I, II, and III were not different (Table 2, Figures 1 and 2). During HD, both urea and phosphate decreased in blooduplasma and in the collected dialysate, however, with different time courses. While urea concentration and urea removal kept decreasing with time by an exponential relationship (Figure 1), phosphate concentration rapidly dropped during the first two hours of treatment, but remained stable thereafter (Figure 2). Dialytic phosphate removal was highest during the first hour, then it slowed, remaining constant during the last 2–3 h. Hourly urea mass removal continuously decreased from 33"4% during the first hour to 12"2% during the last treatment hour (Figure 1). Fractional mass removal of phosphate was 26"6% during the first hour and decreased to a constant level. Table 1. Characteristics of the study population and the remaining HD population (mean"SD). (Centre A). Statistics Data are presented as mean"SD in tables and mean"SEM in figures, respectively. A probability (P) less than 0.05 was considered as significant. Comparison of treatment efficiency in three treatments using different dialysers (I, II, and III) was done by ANOVA for repeated measurements. Binary variables between groups (gender, diabetes) were compared by x2-test. Comparison of predicted to measured phosphate removal was performed according to the method described by Bland and Altman [18]. Analysis was done using Stata v. 6.0 software (Stata Corporation, College Station, Texas, USA).. Female (%) Diabetics (%) Age (years) Pre-dialysis weight (kg) Ultrafiltration (l) Haemoglobin (gul) Pre-dialysis Kq (mmolul) Pre-dialysis PO34 (mmolul) Albumin (gul) KtuVurea (Daugirdas). Study population (ns18). Remaining population (ns56). P. 50 22 61.9"13.5 73.7"16.3 2.0"0.8 120.5"8.1 4.7"0.4 1.44"0.31 36.2"3.2 1.65"0.24. 55 47 66.0"13.6 70.0"16.9 2.2"0.7 116.3"10.8 4.8"0.4 1.68"0.35 36.6"3.4 1.66"0.35. 0.69 0.07 0.27 0.42 0.36 0.14 0.21 0.01 0.65 0.93.
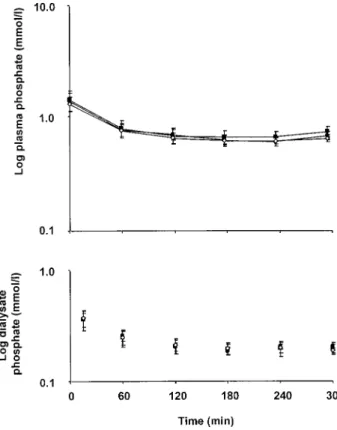
(4) 1040. J.-P. Gutzwiller et al.. Table 2. Treatment characteristics of patients dialysed with filter I, II, and III. (Centre A) Filter I (ns17). Filter II (ns18). Filter III (ns18). Pre-dialysis 72.9"3.9 73.8"4.0 73.0"3.8 weight (kg) Dialysate flow 519.0"7.4 514.9"3.7 511.0"4.7 (Qd) (mlumin) Ultrafiltrate 1.9"0.2 2.1"0.2 2.0"0.2 volume (l) Initial blood urea 18.2"1.3 18.4"1.6 17.3"1.1 (mmolul) Initial plasma 1.38"0.12 1.46"0.13 1.25"0.08 phosphate (mmolul) Phosphate 169.2"6.6 155.0"4.5 167.9"4.2 clearance (mlumin). P. 0.27 0.42 0.52 0.42 0.17 0.10. Fig. 2. Plasma and dialysate phosphate concentrations in study part A for 5 h dialysis treatments (6 subjects, 18 HDs, 3 treatments). Dialyser I is represented by filled circles, dialyser II by white squares, and dialyser III filled squares.. Fig. 1. Blood and dialysate urea concentrations in study part A for 5 h dialysis treatments (6 subjects, 18 HDs, 3 treatments, error bars indicate standard error). The dotted line represents the exponential prediction model based on urea measurements. Dialyser I is represented by filled circles, dialyser II by white squares, and dialyser III by filled squares.. of 18"2, 17"2, and 19"4% during the third, fourth, and fifth hour, respectively, maintaining constant blood concentrations (Figure 2). Phosphate elimination improved from 29.8"0.4 to 36.4"0.5 mmol (P-0.0001) by increasing dialysis time from 4 to 5 h. Phosphate removal improved with increasing KtuVurea, but the relationship was unsatisfactory. Fig. 3. Relationship between dose of delivered dialysis (KtuVurea) and total mass of phosphate removed per dialysis (MPO4udialysis) (study part A and B, 18 subjects, 71 treatments, 237 measurements). MPO4udialysiss12.52 3 KtuVureaq7.39, r2s0.28, P-0.0001. The 95% confidence area is defined by the solid lines.. (r2s0.28, P-0.0001) (Figure 3). Treatment characteristics for dialysers I, II, or III were not different (Table 2). Model generation. After stepwise regression, the best model to describe the removal of phosphate as a.
(5) Phosphate removal in haemodialysis. 1041. Table 3. Regression parameters of the model obtained from 77% of 53 dialysis treatments. (ns137) Source. SS. df. MS. Model Residual. 9007.19 796.91. 3 133. 9804.10. 136. F (3, 133) P)F 0.92 RMSE. 501.08 0.00. Total. 3002.39 5.99 r2 72.09. MPO4. Coefficients. SEM. t. P. 95% CI. Time cds60 cb60 Intercept. 0.106 50.26 11.00 17.02. 0.004 5.03 1.51 1.09. 29.531 9.992 7.281 15.599. -0.0001 -0.0001 -0.0001 -0.0001. 2.45. 0.099–0.113 40.31–60.21 8.01–13.99 19.18 to 14.86. SS, sum of squares; df, degrees of freedom; MS, mean square; F, F-test; RMSE, root mean square error; SEM, standard error of the mean; P, probability; CI, confidence interval.. function of treatment variables was found to be: MPO4 s0:1t 17q50cds60 q11cb60. (1). where MPO4 is the predicted amount of phosphate removed per dialysis given in mmoludialysis, time is given in min, cds60 and cb60 are phosphate concentrations in effluent dialysate and plasma measured 60 min into dialysis in mmolul, respectively. The result of the regression leading to equation (1) is summarized in Table 3. Equation (1) was obtained in approximately 77% (137 out of 177 data sets) of the data sets and was used to predict the phosphate removal in the remaining 23% (40 out of 177 data sets). The predicted values using equation (1) compared to the values measured in the 23% of the data gave a Pearson correlation coefficient of 0.97. Bland–Altman analysis showed an underestimation of 2 mmoludialysis, which was independent of the amount of phosphate removed (data not shown). The slope of the linear regression was close to unity (MPO4preds0.92 3 MPO4measq0.01, r2s0.94). Part B To validate equation (1) developed in the first part of the study, 18 treatments were repeated using dialyser IV. Comparison of predicted to the measured phosphate mass removal yielded a Pearson correlation coefficient of 0.97. The slope of the linear regression (MPO4preds0.91 3 MPO4measq0.83, r2s0.93) was close to unity. Bland–Altman analysis revealed a small albeit systematic underestimation of one mmoludialysis, which was independent of the amount of phosphate removed (Figure 4). Part C Equation (1) was further evaluated in high-flux HD with variable blood flows in diabetic patients. Plasma phosphate was higher in this group (Table 4). Comparison of the predicted to the measured phosphate mass removal yielded a Person correlation. Fig. 4. Bland–Altman plot of phosphate removal measured by dialysate collection and phosphate removal estimated by equation (1). Two standard deviations and the mean differences are indicated by the upperuunder and middle lines, respectively (study part B, 18 patients, 18 treatments, 60 measurements). Table 4. Patient and treatment characteristics of study part C (9 subjects, 23 treatments, mean"SD). (Centre B) Female (%) Diabetics (%) Age (years) Pre-dialysis weight (kg) Ultrafiltration volume (l) Haematocrit (%) Pre-dialysis PO34 (mmolul) Albumin (gul) KtuVurea (Daugirdas). 33.3 100 67.6"9.1 73.8"6.1 1.26"0.69 34.8"4.0 1.61"0.31 37.4"3.9 1.31"0.17. coefficient of 0.94. The slope of the linear regression (MPO4preds0.94 3 MPO4measq2.55, r2s0.88) was close to unity. Bland–Altman analysis revealed a small albeit systematic overestimation of 1 mmoludialysis, which was independent of the amount of phosphate removed. Finally, a correlation of all 104 HD performed for all data sets showed an excellent correlation of 0.92 (Figure 5)..
(6) 1042. Fig. 5. Relationship between estimated and measured phosphate removal per dialysis in all patients and different dialysers studied (105 HD of 31 studied patients).. Discussion The purpose of this study was to present a simple formula to predict phosphate mass removal during high-flux HD as an additional and supplementary tool for individual dialysis prescription. The formula is based on treatment time and phosphate concentrations in plasma and effluent dialysate taken at 60 min of the HD session. The equation was developed from 77% of data collected in 53 standard dialysis treatments and successfully tested in the remaining 23%. Further, the precision of this formula was demonstrated using a more efficient dialyser. In spite of this change, the formula was capable to accurately predict phosphate removal. The systematic underestimation of 1 mmol phosphateudialysis can be assumed as clinically irrelevant, especially because more phosphate is actually removed by this bias. The last part of the study demonstrates that the formula can be applied to diabetics with higher phosphate concentrations, treated with dialysate containing glucose with a smaller high-flux filter and increasing blood flows. Currently, most dialysis teams prescribe and measure dose of dialysis by urea kinetic modelling using KtuVurea. A minimum dose of 1.2 KtuVurea units is considered adequate by current standards using a single pool, variable-volume formula [19]. For a given patient volume (V), this target value can be obtained by different means, either by increasing clearance (K) or by increasing time (t). The focus of reaching a target KtuVurea of 1.2 units has been on maximizing urea clearance with the side effect of decreasing treatment duration. It is instructive to compare the dose of dialysis measured as KtuVurea in individual treatments with the amount of phosphate removed (Figure 3). This comparison is not intended to compare the underlying mechanisms of urea and phosphate removal, which differ in many aspects. At this point it is meant to compare two measures of dose. Intuitively, one would expect an increased removal of phosphate as KtuVurea increases. Indeed, there is a relationship between these two variables, but the correlation is poor. Only 28% of the variation in phosphate removal was explained. J.-P. Gutzwiller et al.. by KtuVurea. If a target KtuVurea of 1.2 is accepted as a standard, the 95% confidence interval for phosphate removal may cover a range from 15.7 to 29.1 mmoludialysis. Whereas the same KtuVurea may be obtained with increasing blood flows and decreasing treatment times, a decrease in treatment time will substantially reduce overall phosphate removal. Like other studies [20,21], our data offered evidence of completely different urea and phosphate kinetic profiles. Contrary to urea elimination, phosphate removal is highest in the first one to two hours and then reaches a constant level during the last two to three hours, for a four and five hour HD treatment, respectively. Even though the major fraction of phosphate is removed during the first hour of dialysis, the constant elimination during later stages of the treatment is undervalued. Almost 19% of phosphate is removed during the last hour of a five hour dialysis session compared to only 10% of total urea mass removal. The continuous decrease of urea elimination with time (Figure 1) is often used to dismiss an ineffective extension of dialysis duration. This argumentation cannot be applied to phosphate elimination (Figure 2). Phosphate removal data indicate that long dialysis sessions significantly contribute to enhanced phosphate elimination (36.4"0.5 mmolu5 h vs 29.8"0.4 mmolu4 h, P-0.0001). The importance of the factor time is documented by time as a linear variable in equation (1). This phenomenon can be explained by the fact that phosphate is mainly distributed in the intracellular space with a slow intra- to extracellular solute transfer rate. Increasing the time of the dialysis session is the best way to raise overall phosphate removal. The clinical importance of treatment time is documented in two recent studies where normal phosphate concentrations could be achieved without phosphate binders using nightly long-term HD [22,23]. High plasma phosphate concentration is a predictor of poor survival on dialysis and in this context, it is believed that hyperphosphataemia is a marker for under-dialysis [24]. Conventional dialysis utilizing high-flux dialysers removes close to 30 mmol phosphate during a 4 h treatment [25]. In order to reduce hyperphosphataemia, with the knowledge that patients’ compliance to reduced phosphate diet prescriptions and phosphate binders intake is unsatisfactory, as outlined in the introduction, enhanced removal is required by HD. The current formula offers a practical approach to estimate the dialysis time to obtain a target phosphate removal: ts10 3 (MPO4. 50cds60. 11cb60 q17). (2). Instead of employing cumbersome dialysate collection, the total amount of phosphate removed can be estimated from two samples and treatment time. Most importantly, samples are taken early in dialysis, soon enough to predict removal as a function of treatment time and to allow for the adjustment of dialysis prescription. The inclusion of phosphate concentration.
(7) Phosphate removal in haemodialysis. in plasma and dialysate measured at the same time is an indirect measure of dialyser clearance. The plasma value at 60 min (cb60) is a good measure of apparent mean phosphate concentration during the entire treatment, as calculated from the area under the curve and treatment time (AUCut). The slope of the linear regression between cb60 and AUCut was close to unity (cb60s1.17 3 AUCut 0.12) (data not shown). A further advantage of this approach is given by the relative independence of dialyser clearance from the specifications given by the manufacturer. As such, the clearance determined by the 60-min concentrations reflects an effective value. This is also evident from results obtained in part B of the study, where a dialyser with increased phosphate clearance was used and precise estimates of phosphate elimination were obtained using equation (1). Intradialytic sampling is not common, but it eliminates the problems associated with post-dialysis rebound. Proper post-dialytic sampling is of special importance when dialysis is quantified by urea kinetic analysis [26]. Recently, two studies demonstrated that hyperphosphataemia is a strong predictor of mortality, independently of KtuVurea [22,23]. KtuVurea represents a fractional clearance and a dose normalized to initial conditions. It can be used to measure and to prescribe the dose of dialysis. A comparable concept is not available for phosphate kinetics since the exact amount of phosphate to be removed during dialysis is not known from a simple concentration measurement. This question remains to be studied in future. However, the first step into this direction is based on a manageable quantification of phosphate removal. To our knowledge this is the first approach to quantify dialysis dose using phosphate kinetics with a simple bedside formula. The formula developed in this paper explains 88–94% of the variation in phosphate removal in a representative dialysis population treated with high-flux dialysers, dialysate flow of 500 mlumin, and blood flow of 200, 250, and 300 mlumin and is valid for initial plasma phosphate levels between 0.56 –2.31 mmolul. In contrast, the predictive value of KtuVurea on phosphate removal was poor. Target values for phosphate removal remain to be identified in future prospective trials. In conclusion, we call for an individual control and quantification of phosphate removal in dialysis treatment. Acknowledgements. We wish to thank all the staff of the dialysis units in Aarau and Liestal for their expert technical assistance. We also want to express our special thanks to Karen Noerby and the team of the Central Laboratory, Kantonsspital Aarau. Finally, we are in debt to Professor Werner Zimmerli for useful comments on the manuscript. Part of this study was supported by the Fond fu¨r Wissenschaft und Forschung, Kantonsspital Aarau, Switzerland.. References 1. United States Renal Data System. USRDS 1998 Annual Data Report. US Department of Health and Human Services. The. 1043. 2.. 3. 4. 5.. 6. 7. 8. 9. 10. 11. 12. 13.. 14.. 15.. 16. 17. 18. 19. 20.. 21. 22. 23.. National Institutes of Health, National Institute of Diabetes and Digestive and Kidney Diseases, Bethesda, MD, August 1998 Block GA, Hulbert-Shearon TE, Levin NW, Port FK. Association of serum phosphorus and calcium 3 phosphate product with mortality risk in chronic haemodialysis patients: a national study. Am J Kidney Dis 1998; 31: 607–617 Leggat JE Jr, Orzol SM, Hulbert-Shearon TE et al. Noncompliance in haemodialysis: predictors and survival analysis. Am J Kidney Dis 1998; 32: 139–145 Goodman WG, Goldin J, Kuizon BD et al. Coronary-artery calcification in young adults with end-stage renal disease who are undergoing dialysis. N Engl J Med 2000; 342: 1478–1483 Marchais SJ, Metivier F, Guerin AP, London GM. Association of hyperphosphataemia with haemodynamic disturbances in end-stage renal disease. Nephrol Dial Transplant 1999; 14: 2178–2183 Amann K, Gross ML, London GM, Ritz E. Hyperphosphataemia—a silent killer of patients with renal failure? Nephrol Dial Transplant 1999; 14: 2085–2087 Ramirez JA, Emmett M, White MG et al. The absorption of dietary phosphorus and calcium in hemodialysis patients. Kidney Int 1986; 30: 753–759 Zehnder C, Gutzwiller JP, Renggli K. Hemodiafiltration—a new treatment option for hyperphosphataemia in haemodialysis patients. Clin Nephrol 1999; 52: 152–159 Mai ML, Emmett M, Scheikh MS, Santa Ana CA, Schiller L, Fordtran JS. Calcium acetate, an effective phosphorus binder in patients with renal failure. Kidney Int 1989; 36: 690–695 Malluche HH, Monier-Faugere MC. Understanding and managing hyperphosphataemia in patients with chronic renal disease. Clin Nephrol 1999; 52: 267–277 Fellay G, Gabriel JP. Un diviseur de flux qui permet, en cours d’he´modialyse, le receuil continu d’un e´chantillon repre´sentativ du dialysat. Ne´phrologie 1994; 15: 33–35 Zehnder C, Blumberg A. Influence of dialyser clearance measurement accuracy on haemodialysis prescription based on KtuV. Nephrol Dial Transplant 1994; 9: 753–757 Charytan C, Gupta B, Meindel N, Spinowitz B. Fractional direct dialysis quantification: a new approach for prescription and monitoring hemodialysis therapy. Kidney Int 1996; 50: 1845–1849 Blumberg A, Roser HW, Zehnder C, Muller-Brand J. Plasma potassium in patients with terminal renal failure during and after haemodialysis: relationship with dialytic potassium removal and total body potassium. Nephrol Dial Transplant 1997; 12: 1629–1634 Zehnder C, Gutzwiller JP, Huber A, Schindler C, Schneditz D. Low-potassium and glucose-free dialysis maintains urea but enhances potassium removal. Nephrol Dial Transplant 2001; 16: 78–84 NKF DOQI Clinical Practice Guidelines. Blood urea nitrogen (BUN) sampling. Am J Kidney Dis 1997; 30 [Suppl 2]: 38–42 Daugirdas JT. Second generation logarithmic estimates of single pool variable volume KtuV: an analysis of error. J Am Soc Nephrol 1993; 4: 1205–1213 Bland MJ, Altman DG. Statistical methods for assessing agreement between two methods of clinical measurement. Lancet 1986; 1: 307–310 Clinical Practice Guidelines for Haemodialysis Dialysis Adequacy. DOQI Guidelines. Guideline 4: minimum delivered dose of haemodialysis. National Kidney Foundation, 1997 Man NK, Chauveau P, Kuno T, Poignet JL, Yanai M. Phosphate removal during hemodialysis, hemodiafiltration, and hemofiltration. A reappraisal. ASAIO Trans 2001; 37: M463–M465 DelSoi CA, Umans JG. Phosphate kinetics during high-flux hemodialysis. J Am Soc Nephrol 1993; 4: 1214–1218 Pierratos A, Ouwendyk M, Francoeur R et al. Nocturnal haemodialysis: three-year experience. J Am Soc Nephrol 1998; 9: 859–868 Mucsi I, Hercz G, Uldall R, Ouwendyk M, Francoeur R, Pierratos A. Control of serum phosphate without any phosphate binders in patients treated with nocturnal haemodialysis. Kidney Int 1998; 53: 1399–1404.
(8) 1044 24. Ritz E, Scho¨mig M, Bommer J. Osteodystrophy in the millennium. Kidney Int 1999; 56 [Suppl 73]: 94–98 25. Kerr PG, Lo A, Chin MM, Atkins RC. Dialyzer performance in the clinic: comparison of six low-flux membranes. Artif Organs 1999; 23: 817–821. J.-P. Gutzwiller et al. 26. Owen WF Jr, Meyer KB, Schmidt G, Alfred H. Methodological limitations of the ESRD Core Indications Project: an ESRD network’s experience with implementing an ESRD quality survey. Medical Review Board of the ESRD Network of New England. Am J Kidney Dis 1997; 30: 349–355 Received for publication: 4.9.01 Accepted in revised form: 22.1.02.
(9)
Figure


Documents relatifs