Changes in cocaine consumption are associated with
fluctuations in self-reported impulsivity and
gambling decision-making
L. M. Hulka1*†, M. Vonmoos1*†, K. H. Preller1, M. R. Baumgartner2, E. Seifritz3,4, A. Gamma5 and B. B. Quednow1,4
1Experimental and Clinical Pharmacopsychology, Department of Psychiatry, Psychotherapy, and Psychosomatics, Psychiatric Hospital, University of Zurich, Switzerland
2Center of Forensic Hairanalytics, Institute of Forensic Medicine, University of Zurich, Switzerland
3Director of the Department of Psychiatry, Psychotherapy, and Psychosomatics, Psychiatric Hospital, University of Zurich, Switzerland 4Neuroscience Center Zurich, University of Zurich, and Swiss Federal Institute of Technology Zurich, Switzerland
5Division of ADHD Research, Department of Psychiatry, Psychotherapy, and Psychosomatics, Psychiatric Hospital, University of Zurich, Switzerland
Background. In cross-sectional studies, cocaine users generally display elevated levels of self-reported and cognitive im-pulsivity. To what extent these impairments are stable v. variable markers of cocaine use disorder, and, thus, are pre-existing or drug-induced, has not yet been systematically investigated.
Method. We conducted a longitudinal study with cocaine users who changed or maintained their consumption inten-sity, measuring self-reported impulsivity with the Barratt Impulsiveness Scale (BIS-11), and cognitive impulsivity with the Rapid Visual Processing task (RVP), Iowa Gambling task (IGT), and Delay Discounting task (DD) at baseline and at 1-year follow-up. We assessed 48 psychostimulant-naive controls and 19 cocaine users with decreased, 19 users with increased, and 19 users with unchanged cocaine intake after 1 year as confirmed by hair analysis.
Results. Results of linear multilevel modelling showed significant group × time interactions for the BIS-11 total score and the IGT total card ratio. Increasers showed a trend for elevated scores, whereas decreasers exhibited reduced self-reported impulsivity scores within 1 year. Surprisingly, increasers’ IGT performance was improved after 1 year, whereas decreasers’ performance deteriorated. By contrast, neither RVP response bias B″ nor DD total score showed substantial group × time interactions. Importantly, BIS-11 and DD revealed strong test–retest reliabilities.
Conclusion. Self-reported impulsivity (BIS-11) and decision-making impulsivity (IGT) covary with changing cocaine use, whereas response bias and delay discounting remain largely unaffected. Thus, self-reported impulsivity and gam-bling decision-making were strongly state-dependent in a stimulant-using population and may be suitable to monitor treatment success, whereas delay of gratification was confirmed as a potential endophenotype of stimulant addiction. Received 9 November 2014; Revised 7 May 2015; Accepted 8 May 2015; First published online 17 June 2015
Key words: Addiction, drug dependence, impulse control, intertemporal choice, planning, stimulants, temporal discounting.
Introduction
Cocaine addiction is a debilitating chronically relapsing disorder that is characterized by persistent and compul-sive drug-seeking despite harmful consequences (APA, 1994). Cocaine is the most commonly used stimulant drug in Europe and the United States (EMCDDA, 2014; UNODC, 2014) and current lifetime prevalence
rates in the populations are estimated at 4.2% in Europe and 14.3% in the United States (EMCDDA, 2014; NSDUH,2014). Despite the high addiction liabil-ity of cocaine (Nutt et al.2007), only a relatively small fraction of users (5–6%) made the transition from con-trolled drug use to drug dependence within the first year of use, whereas 15–16% developed dependency in the long term (Wagner & Anthony,2002).
Converging evidence points to a complex interplay of inherited genetic predispositions and environmen-tal, social, and neurobiological factors contributing to the vulnerability to develop an addiction (Kreek et al. 2005; Kendler et al.2007). It has been postulated that chronic drug use is associated with neuroadaptations in fronto-limbic brain circuits mediating reward, * Address for correspondence: L. M. Hulka, PhD, Experimental and
Clinical Pharmacopsychology, Psychiatric Hospital of the University of Zurich, Lenggstrasse 31, CH-8032 Zurich, Switzerland.
(Email: [email protected]) [L.M.H.] (Email: [email protected]) [M.V.] † Served as joint first authors.
Psychological Medicine(2015), 45, 3097–3110. © Cambridge University Press 2015
doi:10.1017/S0033291715001063 ORIGINAL ARTICLE
https:/www.cambridge.org/core/terms. https://doi.org/10.1017/S0033291715001063
motivation, and memory processes, presumably result-ing in behavioural inflexibility such as disrupted self-control and compulsive drug use (Goldstein & Volkow, 2011). However, the emerging concept of addiction endophenotypes also highlights the role of pre-existing psychological, cognitive, and neurobio-logical factors that may render an individual more sus-ceptible to initiate drug use and develop an addiction (Ersche et al.2012,2013; Mahoney & Olmstead,2013). Important and somewhat conceptually overlapping key factors implicated in the initiation and mainten-ance of drug use are maladaptive decision-making, increased impulsivity propensities, and implicit cogni-tive processes such as attentional bias and implicit memory associations (Field et al. 2008; Lucantonio et al. 2012; Marhe et al. 2013; Stevens et al. 2014; Wiers & Stacy,2006). Overall, drug users attribute ex-cessive attention to drug-related stimuli, rate them more positively than non-users, and exhibit reduced inhibitory control and increased impulsivity, leading to harmful compulsive drug use despite the occurrence of negative consequences. To what extent impaired decision-making and increased impulsivity are drug-induced, pre-existing vulnerability factors, or a combination of both is, however, not entirely clear so far.
Decision-making refers to the ability to select an op-timal course of action from multiple options, requiring ongoing updating and integrating of the value of pre-sent and potential actions (Fellows,2004; Lucantonio et al. 2012). Prior studies have consistently shown that dependent cocaine users exhibit disadvantageous decision-making strategies in tasks such as the Iowa Gambling task (IGT) and preferences for smaller im-mediate over larger but delayed rewards as measured with the Delay Discounting task (DD; Bechara et al. 2002; Verdejo-Garcia et al. 2007; Hulka et al. 2014; Kjome et al.2010). Impulsivity, a multi-faceted concept, is generally defined as a predisposed tendency toward rapid and unplanned reaction patterns without much foresight regarding possible consequences (Moeller et al.2001a). Impulsive tendencies or trait impulsivity is generally assessed with self-report questionnaires, such as the Barratt Impulsiveness Scale (BIS-11), which presumably focus on stable personality charac-teristics (Patton et al. 1995; Stevens et al. 2014). Although self-report measures can provide valuable information, they can be limited if the subject lacks in-sight or answers in a socially desirable manner (Moeller et al.2001a). Therefore, using an experimental approach to complement self-report measures of im-pulsivity with behavioural performance measures is essential. Behavioural or neurocognitive impulsivity has been proposed to include the two main compo-nents of impulsive action representing motor impulsivity
and impulsive choice reflecting more cognitive parts of impulsivity (Winstanley et al.2010). Impulsive action is generally measured with tasks assessing the ability to inhibit motor responses [e.g. Stop-Signal, Stroop, Go/ No-go, and sustained attention tasks such as the Rapid Visual Processing (RVP)], while impulsive choice is either assessed with tasks quantifying the ability to tolerate delay of gratification such as the DD or with tasks measuring responses to reward and loss contin-gencies such as assessed in the IGT (Winstanley et al. 2010; Stevens et al.2014). It has been suggested that im-pulsive action might be more associated with the devel-opment of cocaine addiction, while impulsive choice may contribute specifically to relapse of cocaine use (Winstanley et al.2010). However, this hypothesis has been recently challenged as we did notfind elevated motor impulsivity in cocaine dependence (Vonmoos et al.2013b), while especially DD– a prototype of im-pulsive choice– has been proposed as a critical risk fac-tor for the development of drug addiction as well (MacKillop,2013).
Elevated trait impulsivity has consistently been reported for dependent and recreational stimulant users (Reske et al.2011; Vonmoos et al.2013b), whereas results on behavioural impulsivity are somewhat mixed: some studies found dependent (Perry & Carroll 2008; Verdejo-Garcia et al. 2008; Ersche et al. 2010) and recreational cocaine users (CU) (Colzato et al.2007) to be impaired in Stop-Signal or Go/No-go tasks, whereas we recently concluded from data of a large sample of relatively pure CU that neither de-pendent nor recreational cocaine use was associated with impairment in the Stop-Signal task (Vonmoos et al.2013b). However, the inconsistent results regard-ing performance in Stop-Signal tasks may be explained by different task designs and parameter calculation procedures as well as different exclusion criteria of polytoxic drug use and psychiatric comorbidities (Vonmoos et al.2013b).
Importantly, impaired decision-making and social cognition in CU have been associated with worse self-reported real-life functioning (Cunha et al.2011; Preller et al.2014) and more frequent drug relapse and treat-ment attrition (Bechara,2003; Aharonovich et al.2006; Verdejo-Garcia et al.2014). Moreover, elevated levels of impulsivity have been associated with an increased risk to initiate and continue drug use and a greater likelihood of relapse (for review see Stevens et al. 2014). Considering the impact of impaired decision-making and elevated impulsivity on real-life function-ing and treatment outcome, it is important to better understand if the different facets of impulsivity are stable antecedent vulnerability factors – predisposing individuals to develop and maintain cocaine addiction – or rather drug-induced consequences. Moreover, it 3098 L. M. Hulka et al.
https:/www.cambridge.org/core/terms. https://doi.org/10.1017/S0033291715001063
is not clear whether these behavioural deviances are re-versible when drug use is reduced or completely ceased. Recently, we reported that CU, who had sub-stantially increased cocaine use over the course of 1 year, exhibited worse cognitive performance compared to baseline, whereas those who decreased or ceased their cocaine use showed substantially improved cog-nitive performance, suggesting that cogcog-nitive impair-ment is partially cocaine-induced but also reversible (Vonmoos et al.2014).
The primary goal of the present investigation was, thus, to determine which specific decision-making and impulsivity components are stable (addiction endophenotypes) v. variable (drug-induced) markers of cocaine use disorder over the time-course of one year. For this purpose, we conducted a longitudinal study assessing trait impulsivity with the BIS-11, im-pulsive actionwith the RVP response bias B″, and impul-sive choicewith the main IGT and DD parameters, at baseline and after 1 year. CU of the Zurich Cocaine Cognition Study (ZuCo2St) were categorized as decrea-sers, increadecrea-sers, or equal users after the 1-year follow-up based on a toxicological quantification of cocaine levels in hair samples. With regard to the BIS-11 and DD, we expected that scores would remain stable over the two assessments because the BIS-11 is regarded as a trait measure and also discounting preferences appear to be relatively stable over time (for review see MacKillop,2013). For the RVP B″ we expected stable results as none of the few existing previous studies with CU displayed a substantial cocaine-associated ef-fect on this parameter (Ersche et al. 2011; Vonmoos et al.2013b). By contrast, we expected that the IGT per-formance would improve with decreased cocaine use and worsen with increased cocaine use as prior studies reported dose-dependent relationships between co-caine use and IGT performance (Verdejo-Garcia et al. 2007).
Materials and method Participants
The eligible baseline sample of the ZuCo2St comprised 234 participants [138 CU, 96 healthy psychostimulant-naive controls (HC)] (Vonmoos et al. 2013a; Hulka et al.2014; Preller et al.2014). One hundred and thirty-two subjects [79 CU (57.3% of baseline), 53 HC (55.2%)] participated in the 1-year-follow-up. Hereof, 57 CU and 48 matched HC could be included in the longitudinal analysis (for details see Supplementary Method S1).
At baseline, exclusion criteria for all participants were clinically significant somatic diseases, neurologic-al disorders, head injuries, family history of schizophre-nia, obsessive compulsive disorder, or bipolar disorder,
or any medication affecting the CNS. Further exclusion criteria for CU were opioid use, polytoxic drug use pat-terns, or DSM-IV Axis I psychiatric disorders (except for cocaine, nicotine, and alcohol abuse/dependence, former affective disorders, and attention deficit hyper-activity disorder). At baseline, all CU met the follow-ing inclusion criteria: cocaine as primary drug of choice, cocaine use >0.5 g/month, and abstinence dur-ation of <6 months. Exclusion criteria for HC were DSM-IV Axis I psychiatric disorders (excluding nico-tine dependence) and regular illegal drug use (>15 life-time occasions, except occasional cannabis use).
Participants were asked to abstain from illegal sub-stances for >72 h and from alcohol for >24 h. Compliance was controlled by urine screens (semi-quantitative enzyme multiplied immunoassay method) and 6-month hair toxicology (Vonmoos et al. 2013a). The study was approved by the Cantonal Ethics Committee of Zurich. All participants provided written informed-consent statements and were compensated for their participation.
Cocaine user groups
Cocaine user groups were determined based on a com-bination of absolute (±0.5 ng/mg cocaine) (Bush 2008; Cooper et al.2012) and relative (>10% increase/decrease in the robust hair toxicology parameter cocainetotal) (Hoelzle et al.2008) changes in cocaine concentration in the hair samples between baseline and follow-up. CU who met both criteria were categorized as increa-sers or decreaincrea-sers accordingly, whereas CU who met none or only one criterion were classified as equal users. Accordingly, CU were divided into three equally sized groups: Whereas 19 CU with increased cocaine use and 19 CU with decreased cocaine use met the according change criteria, a third group of 19 CU displayed equal cocaine use and met neither the cut-off-criteria for increased nor decreased cocaine use [increaser: mean ±S.D. + 30.4 ± 61.9 ng/mg (+297%), range +0.5 to +268.5 ng/mg (+20% to +5374%); decreaser: −10.6 ± 26.7 ng/ mg (−72%), −116.9 to −0.6 ng/mg (−100% to −12%); equal user:−0.1 ± 0.5 ng/mg (−2%), −1.9 to +0.5 ng/mg (−100% to +720%)]. Procedure
The test procedure was similar in both test sessions. The Structured Clinical Interview for DSM-IV Axis I disorders (SCID-I; APA, 1994) was conducted by trained psychologists. Drug use was assessed by means of a structured and standardized interview for psychotropic drug consumption (Quednow et al. 2004). For matching reasons, pre-morbid verbal intelli-gence was measured with a German version of a mul-tiple choice vocabulary intelligence test (MWT-B; Self-reported impulsivity covaries with changing cocaine use 3099
https:/www.cambridge.org/core/terms. https://doi.org/10.1017/S0033291715001063
Lehrl, 1999). Attention deficit hyperactivity disorder (ADHD) symptoms were assessed with the ADHD Self-Rating Scale (ADHD-SR; Roesler et al. 2004), and symptoms of depression with the Beck Depression Inventory (BDI; Beck et al. 1961). Smoking severity was assessed with the Fagerström Test of Nicotine Dependence (FTND; Heatherton et al.1991) and crav-ing for cocaine with the Brief Cocaine Cravcrav-ing Questionnaire (CCQ; Sussner et al.2006). Smoking in-tensity and cocaine craving were assessed to control for their potential acute effects on test performance (Franken, 2003). Trait impulsivity was assessed with the BIS-11 (Patton et al. 1995). The two components of cognitive impulsivity impulsive action and impulsive choice were measured by means of the response bias B’ (an analogue to the response bias beta from the signal detection theory; Green & Swets,1966) drawn from the sustained attention task RVP of the Cambridge Automated Neuropsychological Test Battery (CANTAB; Elliott et al.1996) as well as the dis-counting rate described by parameter k from the DD task (Kirby et al. 1999), and the IGT parameter total ratio (number of good cards – number of bad cards) (Bechara et al.2002), respectively. At follow-up, a par-allel test version was used for the IGT. Detailed task descriptions for the RVP, IGT, and DD can be found in Supplementary Method S2.
Statistical analysis
Statistical analyses regarding demographic data and drug use patterns (Table 1) as well as baseline test scores were performed with SPSS Statistics 19.0 (IBM, Switzerland). Frequency data were analysed by means of Pearson’s χ2
test and quantitative data by analyses of variance (ANOVA) or Student’s t tests. All other analyses derived from the xtmixed command in Stata 12.1 for Macintosh (StataCorp.2011). Regres-sion modelling involved a series of linear multilevel models (also known as linear mixed, random-effects, or random-coefficient models) (Tabachnik & Fidell, 2006; Gelman & Hill,2007; Locascio & Atri,2011).
All dependent variables were divided by their re-spective standard deviations to aid in model interpret-ation. Predictors evaluated were: group (increasers, decreasers, equal users, controls), time (dummy vari-able with levels baseline and follow-up), group × time interaction, female sex, age (in 10-year steps), level of education (years), age of onset of cocaine use (in 5-year steps), verbal IQ (in steps of 5), amount of Swiss francs available in the last 12 months (ordinal variable with levels 0–15000, 15000–30000, 30000– 60000, 60000–90000, 90000–120000, >120000), FTND score (divided by standard deviation), smoker (yes/ no), ADHD-SR score (divided by standard deviation),
adult ADHD (yes/no, DSM-IV criteria), BDI score (divided by standard deviation), BDI depression (yes/ no, cut-off≥18), CCQ score (divided by standard devi-ation), years of cocaine use, cumulative cocaine use in grams (transformed by natural logarithm because of violation of normality distribution), cocaine in hair samples (pg/mg), positive urine screen for cocaine (yes/no), and cocaine level in urine toxicology (ng/ml, log-transformed). Continuous predictors were centred on their grand means. In addition to some of the pre-dictors (see above), the dependent variable DD k total was log-transformed as well (further details of the statistical analysis are given in Supplementary Method S3).
Fig. 1 shows the effects of group and time for the four main dependent variables, even if the main effects and/or interactions of group and time were not statis-tically significant in the final models that are reported inTable 2. In such cases, these effects were added to the final model and the figures were derived from these extended models.
Results
Demographic and clinical characteristics and drug use
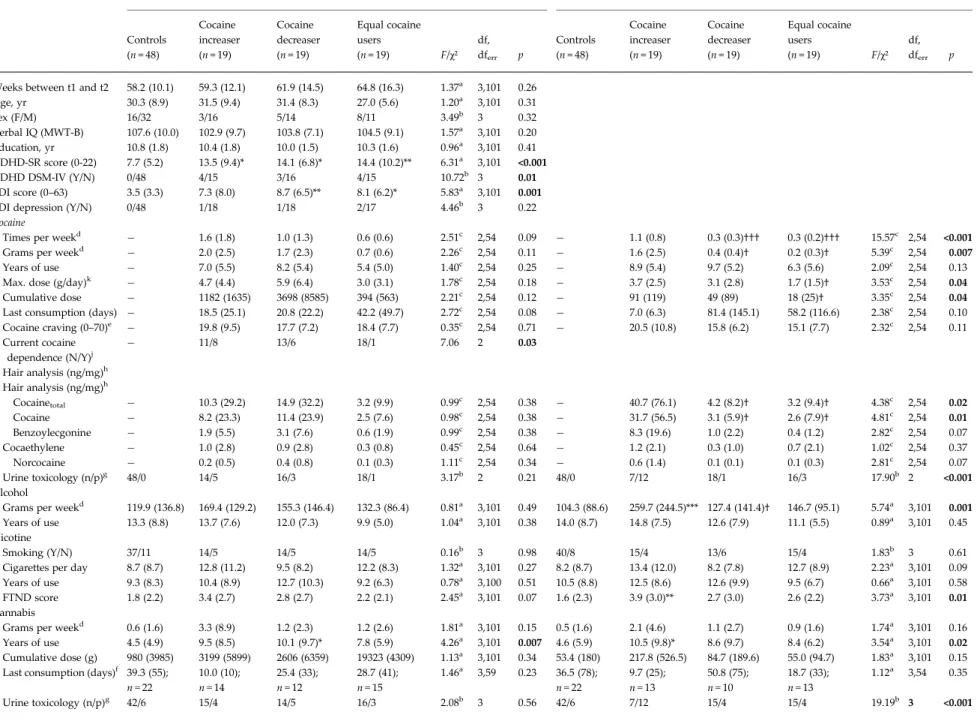
The four groups did not significantly differ regarding age, sex distribution, verbal IQ, years of education, smoking status, and length of interval between the two study assessments (Table 1). Moreover, all three CU groups showed similar BDI (pSidak post-hoc> 0.97) and ADHD-SR (pSidak post-hoc> 0.99) sum scores, but exhibited distinctively higher values than HC (pBDI = 0.08– 0.006, pADHD-SR= 0.03– 0.007).
At baseline, all three CU groups did not display significant differences in the self-reported cocaine use parameters and hair concentrations. However, the increaser and decreaser groups clearly featured a stron-ger current and cumulative cocaine use than the equal user group although the differences were not statistic-ally significant. Furthermore and in accordance with the inclusion criteria, the data showed a clear domin-ation of cocaine compared to other illegal drug use. At follow-up, increasers had a three- to four-fold higher cocaine concentration in the hair samples compared to the baseline value, whereas decreasers’ values dropped by about three quarters, while the equal users’ values remained relatively stable.
Impulsivity and decision-making scores BIS-11
At baseline, a combined CU group (including increa-sers, decreaincrea-sers, and equal users) differed significantly 3100 L. M. Hulka et al.
https:/www.cambridge.org/core/terms. https://doi.org/10.1017/S0033291715001063
Table 1. Demographic data and pattern of drug use
Baseline (t1) 1-year follow-up (t2)i
Controls Cocaine increaser Cocaine decreaser Equal cocaine users F/χ² df, dferr p Controls Cocaine increaser Cocaine decreaser Equal cocaine users F/χ² df, dferr p (n = 48) (n = 19) (n = 19) (n = 19) (n = 48) (n = 19) (n = 19) (n = 19)
Weeks between t1 and t2 58.2 (10.1) 59.3 (12.1) 61.9 (14.5) 64.8 (16.3) 1.37a 3,101 0.26
Age, yr 30.3 (8.9) 31.5 (9.4) 31.4 (8.3) 27.0 (5.6) 1.20a 3,101 0.31
Sex (F/M) 16/32 3/16 5/14 8/11 3.49b 3 0.32
Verbal IQ (MWT-B) 107.6 (10.0) 102.9 (9.7) 103.8 (7.1) 104.5 (9.1) 1.57a 3,101 0.20 Education, yr 10.8 (1.8) 10.4 (1.8) 10.0 (1.5) 10.3 (1.6) 0.96a 3,101 0.41 ADHD-SR score (0-22) 7.7 (5.2) 13.5 (9.4)* 14.1 (6.8)* 14.4 (10.2)** 6.31a 3,101 <0.001
ADHD DSM-IV (Y/N) 0/48 4/15 3/16 4/15 10.72b 3 0.01
BDI score (0–63) 3.5 (3.3) 7.3 (8.0) 8.7 (6.5)** 8.1 (6.2)* 5.83a 3,101 0.001
BDI depression (Y/N) 0/48 1/18 1/18 2/17 4.46b 3 0.22
Cocaine
Times per weekd − 1.6 (1.8) 1.0 (1.3) 0.6 (0.6) 2.51c 2,54 0.09 − 1.1 (0.8) 0.3 (0.3)††† 0.3 (0.2)††† 15.57c 2,54 <0.001
Grams per weekd − 2.0 (2.5) 1.7 (2.3) 0.7 (0.6) 2.26c 2,54 0.11 − 1.6 (2.5) 0.4 (0.4)† 0.2 (0.3)† 5.39c 2,54 0.007
Years of use − 7.0 (5.5) 8.2 (5.4) 5.4 (5.0) 1.40c 2,54 0.25 − 8.9 (5.4) 9.7 (5.2) 6.3 (5.6) 2.09c 2,54 0.13
Max. dose (g/day)k − 4.7 (4.4) 5.9 (6.4) 3.0 (3.1) 1.78c 2,54 0.18 − 3.7 (2.5) 3.1 (2.8) 1.7 (1.5)† 3.53c 2,54 0.04
Cumulative dose − 1182 (1635) 3698 (8585) 394 (563) 2.21c 2,54 0.12 − 91 (119) 49 (89) 18 (25)† 3.35c 2,54 0.04
Last consumption (days) − 18.5 (25.1) 20.8 (22.2) 42.2 (49.7) 2.72c 2,54 0.08 − 7.0 (6.3) 81.4 (145.1) 58.2 (116.6) 2.38c 2,54 0.10 Cocaine craving (0–70)e − 19.8 (9.5) 17.7 (7.2) 18.4 (7.7) 0.35c 2,54 0.71 − 20.5 (10.8) 15.8 (6.2) 15.1 (7.7) 2.32c 2,54 0.11 Current cocaine dependence (N/Y)j − 11/8 13/6 18/1 7.06 2 0.03 Hair analysis (ng/mg)h Hair analysis (ng/mg)h Cocainetotal − 10.3 (29.2) 14.9 (32.2) 3.2 (9.9) 0.99c 2,54 0.38 − 40.7 (76.1) 4.2 (8.2)† 3.2 (9.4)† 4.38c 2,54 0.02 Cocaine − 8.2 (23.3) 11.4 (23.9) 2.5 (7.6) 0.98c 2,54 0.38 − 31.7 (56.5) 3.1 (5.9)† 2.6 (7.9)† 4.81c 2,54 0.01 Benzoylecgonine − 1.9 (5.5) 3.1 (7.6) 0.6 (1.9) 0.99c 2,54 0.38 − 8.3 (19.6) 1.0 (2.2) 0.4 (1.2) 2.82c 2,54 0.07 Cocaethylene − 1.0 (2.8) 0.9 (2.8) 0.3 (0.8) 0.45c 2,54 0.64 − 1.2 (2.1) 0.3 (1.0) 0.7 (2.1) 1.02c 2,54 0.37 Norcocaine − 0.2 (0.5) 0.4 (0.8) 0.1 (0.3) 1.11c 2,54 0.34 − 0.6 (1.4) 0.1 (0.1) 0.1 (0.3) 2.81c 2,54 0.07 Urine toxicology (n/p)g 48/0 14/5 16/3 18/1 3.17b 2 0.21 48/0 7/12 18/1 16/3 17.90b 2 <0.001 Alcohol
Grams per weekd 119.9 (136.8) 169.4 (129.2) 155.3 (146.4) 132.3 (86.4) 0.81a 3,101 0.49 104.3 (88.6) 259.7 (244.5)*** 127.4 (141.4)† 146.7 (95.1) 5.74a 3,101 0.001 Years of use 13.3 (8.8) 13.7 (7.6) 12.0 (7.3) 9.9 (5.0) 1.04a 3,101 0.38 14.0 (8.7) 14.8 (7.5) 12.6 (7.9) 11.1 (5.5) 0.89a 3,101 0.45 Nicotine
Smoking (Y/N) 37/11 14/5 14/5 14/5 0.16b 3 0.98 40/8 15/4 13/6 15/4 1.83b 3 0.61
Cigarettes per day 8.7 (8.7) 12.8 (11.2) 9.5 (8.2) 12.2 (8.3) 1.32a 3,101 0.27 8.2 (8.7) 13.4 (12.0) 8.2 (7.8) 12.7 (8.9) 2.23a 3,101 0.09 Years of use 9.3 (8.3) 10.4 (8.9) 12.7 (10.3) 9.2 (6.3) 0.78a 3,100 0.51 10.5 (8.8) 12.5 (8.6) 12.6 (9.9) 9.5 (6.7) 0.66a 3,101 0.58 FTND score 1.8 (2.2) 3.4 (2.7) 2.8 (2.7) 2.2 (2.1) 2.45a 3,101 0.07 1.6 (2.3) 3.9 (3.0)** 2.7 (3.0) 2.6 (2.2) 3.73a 3,101 0.01 Cannabis
Grams per weekd 0.6 (1.6) 3.3 (8.9) 1.2 (2.3) 1.2 (2.6) 1.81a 3,101 0.15 0.5 (1.6) 2.1 (4.6) 1.1 (2.7) 0.9 (1.6) 1.74a 3,101 0.16 Years of use 4.5 (4.9) 9.5 (8.5) 10.1 (9.7)* 7.8 (5.9) 4.26a 3,101 0.007 4.6 (5.9) 10.5 (9.8)* 8.6 (9.7) 8.4 (6.2) 3.54a 3,101 0.02 Cumulative dose (g) 980 (3985) 3199 (5899) 2606 (6359) 19323 (4309) 1.13a 3,101 0.34 53.4 (180) 217.8 (526.5) 84.7 (189.6) 55.0 (94.7) 1.83a 3,101 0.15 Last consumption (days)f 39.3 (55);
n =22 10.0 (10); n =14 25.4 (33); n =12 28.7 (41); n =15 1.46a 3,59 0.23 36.5 (78); n =22 9.7 (25); n =13 50.8 (75); n =10 18.7 (33); n =13 1.12a 3,54 0.35 Urine toxicology (n/p)g 42/6 15/4 14/5 16/3 2.08b 3 0.56 42/6 7/12 15/4 15/4 19.19b 3 <0.001 Self-r eported impulsivity cov aries with changing cocaine use 3101 https:/www.cambridge.org/core/terms . https://doi.org/10.1017/S0033291715001063 Downloaded from https:/www.cambridge.org/core
. University of Basel Library
, on
30 May 2017 at 17:00:23
Table 1 (cont.)
Baseline (t1) 1-year follow-up (t2)i
Controls Cocaine increaser Cocaine decreaser Equal cocaine users F/χ² df, dferr p Controls Cocaine increaser Cocaine decreaser Equal cocaine users F/χ² df, dferr p (n = 48) (n = 19) (n = 19) (n = 19) (n = 48) (n = 19) (n = 19) (n = 19) Amphetamine
Grams per weekd 0.0 (0.1) 0.1 (0.1)* 0.0 (0.1) 0.0 (0.1) 3.17a 3,101 0.03 0.0 (0.0) 0.1 (0.2)** 0.0 (0.1) 0.0 (0.1) 3.94a 3,101 0.01 Years of use 0.0 (0.0) 3.3 (4.0)*** 1.3 (3.1) 1.4 (3.0) 8.45a 3,101 <0.001 0.1 (0.5) 3.2 (4.9)** 2.7 (5.5)* 1.9 (3.5) 5.07a 3,101 0.003 Cumulative dose (g) 0.0 (0.1) 56.0 (177.6)* 16.2 (35.9) 2.8 (5.8) 2.58a 3,101 0.06 0.0 (0.1) 4.4 (8.9)** 1.4 (3.5) 1.9 (6.0) 3.85a 3,101 0.01 Last consumption (days)f 121.6 (-); n = 1 73.6 (62); n = 10 90.9 (81); n = 3 61.8 (60); n = 7 0.34a 3,17 0.79 17.5 (-); n = 1 35.7 (32); n = 8 99.8 (108); n = 4 65.9 (23); n = 3 1.18a 3,12 0.36 Hair analysis (ng/mg)h 0.0 (0.0) 0.1 (0.2)* 0.0 (0.0) 0.0 (0.0) 3.43a 3,101 0.02 0.0 (0.0) 0.1 (0.2) 0.1 (0.2) 0.0 (0.0) 2.56a 3,101 0.06 MDMA
Tablets per weekd 0.0 (0.0) 0.0 (0.1)** 0.0 (0.0) 0.0 (0.0) 5.11a 3,101 0.002 0.0 (0.0) 0.4 (0.9)** 0.0 (0.0)† 0.1 (0.1) 4.49a 3,101 0.01 Years of use 0.3 (1.0) 3.5 (4.5)** 2.4 (4.6) 2.1 (3.8) 5.35a 3,101 0.002 0.2 (1.4) 3.8 (5.5)** 3.2 (5.6)* 2.6 (4.3) 5.26a 3,101 0.002 Cumulative dose
(tablets)
1.3 (4.0) 108.8 (249.7)** 18.7 (46.2) 14.6 (39.9) 4.61a 3,101 0.005 0.2 (0.8) 17.0 (49.3)* 2.8 (5.2) 4.3 (7.1) 2.91a 3,101 0.04 Last consumption (days)f 5.0 (-); n = 1 89.9 (65); n = 7 40.2 (34); n = 4 56.4 (43); n = 6 1.32a 3,14 0.31 91.2 (30); n = 3 41.6 (55); n = 6 47.8 (48); n = 5 69.7 (36.4); n = 8 1.10a 3,18 0.38 Hair analysis (ng/mg)h 0.0 (0.0) 0.3 (0.7) 0.4 (1.5) 0.2 (0.5) 1.69a 3,101 0.17 0.0 (0.0) 0.5 (0.8)*** 0.1 (0.3) 0.2 (0.4) 5.71a 3,101 <0.001 GHB Cumulative dose (pipettes) 0.0 (0.0) 0.5 (0.7) 0.5 (1.7) 4.5 (17.8) 1.71a 3,101 0.17 0.0 (0.0) 0.0 (0.0) 0.0 (0.0) 1.2 (5.2) 1.68a 3,101 0.18 Hallucinogens
Cumulative dose (times) 0.9 (2.2) 27.9 (72.8)* 9.9 (22.9) 6.3 (14.3) 3.10a 3,101 0.03 0.0 (0.0) 1.1 (1.6)*** 0.6 (1.5) 0.4 (0.8) 6.18a 3,101 <0.001 Methlyphenidate Cumulative dose (tablets) 0.0 (0.0) 20.2 (60.4) 0.5 (2.3) 41.3 (144.6) 2.05a 3,101 0.11 0.0 (0.1) 67.7 (239.5) 0.3 (0.6) 1.5 (4.6) 2.30a 3,101 0.08 Hair analysis (ng/mg)h 0.0 (0.0) 0.0 (0.1) 0.0 (0.0) 0.0 (0.0) 1.40a 3,101 0.25 0.0 (0.0) 0.1 (0.2)* 0.0 (0.0) 0.0 (0.0) 2.99a 3,101 0.03
Values given are means and standard deviations. Significant p values are shown in bold.
aANOVA (all groups, with significant Sidak post-hoc test v. control group: *p < 0.05; **p < 0.01; ***p < 0.001; v. cocaine increasers: †p < 0.05). bχ² test (all groups/cocaine users only) for frequency data.
cANOVA (cocaine users only, with significant Sidak post-hoc test v. cocaine increasers: †p < 0.05; †††p < 0.001). dAverage use during the last 6 months.
e
Craving for cocaine was assessed by the CCQ.
fLast consumption is averaged only for persons who used the drug in the last 6 months. g
Urine toxicology (neg/pos) is based on cut-off value for cocaine = 150 ng/ml and for tetrahydrocannabinol = 50 ng/ml (Substance Abuse and Mental Health Services Administration,
2008). Theχ² test for cocaine includes only cocaine users, the χ² test for cannabis includes all groups.
h
Hair samples were voluntary and data are missing for three controls.
iParameters at follow-up refer to the 1-year period between t1 and t2. j
SCID-I diagnosis according to DSM-IV criteria (APA, 1994).
kSelf-reported maximum dose of cocaine within 24 h (in grams).
3102 L. M. Hulka et al. https:/www.cambridge.org/core/terms . https://doi.org/10.1017/S0033291715001063 Downloaded from https:/www.cambridge.org/core
. University of Basel Library
, on
30 May 2017 at 17:00:23
from the HC group in the total score (T103 = 2.98, p < 0.01) and all three subscales FI–FII (T103= 2.32– 2.83, p= 0.02– 0.006) as previously shown in Vonmoos et al. (2013b). The most striking finding was the
significant group × time interaction (p < 0.01) in the BIS-11 total score with increasers showing a trend for elevated self-reported impulsivity over time (p = 0.12), whereas decreasers displayed significantly Fig. 1. Predicted values for baseline (t1) and follow-up (t2) are shown. (a) Development of Barratt Impulsiveness Scale (BIS-11) total scores within 1 year. Control group data in raw values (predicted data are not available because this group was dropped from the regression model due to collinearity). Group × time interaction (increaser × decreaser) p < 0.01. *p < 0.05 time effect for cocaine decreasers. (b) Development of the Rapid Visual Processing task (RVP) response bias B″ within 1 year. (c) Development of delay discounting (DD) parameter k within 1 year. Control group data in raw values (predicted data are not available because this group was dropped from the regression model due to collinearity). (d) Development of the Iowa Gambling task (IGT) total ratio within 1 year. Group × time interaction (increaser × decreaser) p < 0.05.
Self-reported impulsivity covaries with changing cocaine use 3103
https:/www.cambridge.org/core/terms. https://doi.org/10.1017/S0033291715001063
reduced self-reported impulsivity within 1 year (p < 0.05). Equal users’ (p = 0.86) and HCs’ total scores remained comparatively stable (Fig. 1a; a p value for HC is not available because this group was dropped from the regression model due to collinearity). Table 2shows that this pattern of significant group × time interactions (increaser v. decreaser) can also be seen in the BIS-11 primary subscales FI (attentional im-pulsiveness, p < 0.05) and FII (motor imim-pulsiveness, p < 0.01). Whereas none of the groups revealed signifi-cant time effects in attentional impulsiveness (pdec = 0.17, pinc= 0.08, pequal= 0.28, pHC = 0.48), decreasers showed a significant reduction in the self-reported motor impulsiveness (pdec< 0.01, pinc = 0.13, pequal = 0.92, pHC = 0.18). For the BIS-11 subscale FIII (non-planning impulsiveness) no significant group × time interaction (increaser v. decreaser) was found (p = 0.15).
Additionally, BIS-11 total, attentional, and motor im-pulsiveness scores correlated strongly with ADHD-SR sum scores (all p < 0.002). Furthermore, BIS-11 total, attentional, and non-planning scores were positively associated with BDI depression (all p < 0.05). BIS-11 total (p < 0.05) and non-planning scores (p < 0.001) positively covaried with craving scores, and a later age of cocaine onset was linked to reduced motor im-pulsiveness (p < 0.01). However, this latter effect was no longer significant when controls were excluded from the analysis.
RVP response bias B″
For B″, no baseline differences between CU and HC oc-curred (T103 =− 1.04, p = 0.30) (see also Vonmoos et al. 2013b) and in the longitudinal analysis there was no significant effect regarding group, time, or their
interaction. The only significant finding was a weak positive association with duration of cocaine use (p < 0.05), which was no longer significant when excluding the control group from the analysis (Table 2,Fig. 1b).
DD k total
At baseline, CU and HC strongly differed regarding k total (T103 =− 3.40, p < 0.001), as shown before (Hulka et al.2014). Longitudinally, k total showed no statistic-ally significant group and/or time effects. However, a 100% increase in the cumulative lifetime dose of co-caine was associated with roughly a 20% decline in scores of the ability to delay gratification – i.e. to forego immediate smaller in favour of delayed larger rewards. Moreover, a 100% raise in the FTND score was asso-ciated with a 30% decrease in scores for delayed gratifi-cation (Table 2,Fig. 1c).
IGT total ratio
Baseline scores of the IGT total ratio did not differ be-tween CU and HC (T102= 0.72, p = 0.47). In the longi-tudinal analysis, a significant group × time interaction was found for the IGT total ratio (p < 0.05, Table 2, Fig. 1d, for a detailed distribution of IGT scores for each group at t1 and t2 see Supplementary Fig. S1). Without any statistically significant main effect of group, decreasers’ scores fell during the 1-year-interval (p = 0.11), whereas those of the increasers improved (p = 0.09). Concretely, this means that decreasers chose significantly fewer favourable cards at follow-up. Equal users (p = 0.34) and HC (p = 0.54) total ratio scores remained fairly stable. Age (p < 0.01), an ADHD diagnosis (p < 0.10), and positive smoking sta-tus (p < 0.01) were related to decreases in IGT per-formance of roughly 1/3S.D.
Fig. 1 (cont.)
3104 L. M. Hulka et al.
https:/www.cambridge.org/core/terms. https://doi.org/10.1017/S0033291715001063
Table 2. Coefficients (standard errors) of final multilevel regression models with standardized dependent variables RVP response bias B″a BIS-11 total scorea BIS-11 FI attentional impulsivitya BIS-11 FII motor impulsivitya BIS-11 FIII
non-planning impulsivitya DD k total [log]a IGT total scorea
Time
t 0.234 (0.15) 0.303† (0.17) 0.273 (0.18) 0.403† (0.24) Group
Equal users (v. incb) 0.144 (0.28) 0.175 (0.22) 0.208 (0.29) −0.232 (0.31)
Decreasers (v. incb) 0.294 (0.28) 0.074 (0.22) 0.403 (0.29) −0.077 (0.31) Controls (v. incb) 0.198 (0.19) 0.135 (0.25) −0.174 (0.26)
Group × time
Equal users (v. incb) × t −0.206 (0.22) −0.489* (0.24) −0.292 (0.26) −0.173 (0.34)
Decreasers (v. incb) × t −0.568** (0.21) −0.532* (0.24) −0.836** (0.25) −0.786* (0.34)
Controls (v. incb) × t −0.229 (0.20) −0.423* (0.21) −0.313 (0.28)
Demographics
Age (per 10 years) −0.310** (0.09)
Clinical statusc
ADHD-SR score 0.385*** (0.10) 0.669*** (0.06) 0.260** (0.09)
ADHD DSM-IV (Y/N) −0.516† (0.27)
BDI score 0.130* (0.06) 0.149 (0.07) BDI depression (Y/N) 0.595* (0.26)
Smoking FTND score 0.310* (0.13) −0.215** (0.08)
Smoking (Y/N) 0.285+ (0.17) −0.282† (0.15) −0.348 (0.18) Cocaine use relatedc
Age of onset (per 5 year) −0.161† (0.09) −0.075† (0.04)d −0.147** (0.05)e −0.178† (0.10)
Craving score (perS.D.) 0.190* (0.07) 0.237*** (0.07) −0.275† (0.16)
Years of use (years) 0.035* (0.02)e
Cumulative dose (g; log) 0.177* (0.08)
RVP, Rapid Visual Processing task; BIS-11, Barratt Impulsiveness Scale; DD, delay discounting task; IGT, Iowa Gambling task; BDI, Beck Depression Inventory; FTND, Fagerström Test of Nicotine Dependence; ADHD, attention deficit hyperactivity disorder.
Significance levels: †p < 0.10; *p < 0.05; **p < 0 .01; ***p < 0 .001.
a
All dependent variables divided by standard deviation.
bIncreasers. c
Values at baseline (t1).
dNo longer significant when excluding controls. eOnly trend-level significant when excluding controls.
The table shows all coefficients that are relevant for the final models. Principally, final models included only predictors at p < 0.10. However, in case of any significant interaction effects (group × time), the table additionally displays the single terms (group, time).
Self-r eported impulsivity cov aries with changing cocaine use 3105 https:/www.cambridge.org/core/terms . https://doi.org/10.1017/S0033291715001063 Downloaded from https:/www.cambridge.org/core
. University of Basel Library
, on
30 May 2017 at 17:00:23
Test–retest reliability
In three of the four main variables, HC displayed slightly higher test–retest reliability scores than the combined CU group (Table 3) but the differences were not significant (z < 0.80, p > 0.20). Moreover, the BIS-11 total score showed a remarkably strong test-retest reliability, whereas the response bias B’ fea-tured the smallest but nonetheless significant test-retest reliability in HC and CU.
Discussion
The present longitudinal study investigated to what extent impaired decision-making and elevated impul-sivity levels in CU may represent stable and pre-existing addiction endophenotypes v. variable state markers depending on the quantity of cocaine used. The most strikingfinding was that self-reported levels of impulsivity strongly covaried with changing cocaine use patterns. Accordingly, CU who substantially decreased their cocaine intake within one year reported significantly lower levels of impulsive behaviour, whereas CU who increased their consumption reported by trend higher levels of subjectively per-ceived impulsivity. By contrast, cognitive impulsivity measures capturing impulsive action (response bias B’) and impulsive choice (delay discounting) did not signifi-cantly differ with increasing or decreasing cocaine use over the course of one year. Contrary to our expecta-tions, CU who decreased their cocaine intake during the 1-year interval chose fewer favourable cards in the IGT at the second study assessment, whereas CU who increased their consumption showed a slightly improved performance. Nonetheless, there seemed to be a linkage between worse decision-making at base-line and a subsequently increased cocaine use pattern suggesting that impaired decision-making might in-deed be a risk factor for increasing cocaine use.
The results of the present study are somewhat sur-prising and call some existing assumptions into ques-tion. The BIS has been regarded to reflect a relatively stable trait component of subjectively experienced im-pulsivity levels (Stevens et al. 2014). However, our results revealed that CU who increased their consump-tion over the time-course of 1 year perceived them-selves by trend as more impulsive, whereas CU who decreased their use rated themselves as less impulsive. Although the BIS reliably differentiated CU from HC, and, thus, might overall reflect a trait component, it is not as stable in drug using populations as previously assumed. Therefore, the BIS may be useful to assess how subjectively perceived levels of impulsiveness in CU covary with drug consumption. Moreover, Littlefield et al. (2009) have also provided evidence
that impulsivity measures assessed in questionnaires change over time. Previously, we have already shown that BIS ratings were elevated in dependent CU using substantially higher amounts of cocaine than in recreational CU with a much less pronounced cocaine use pattern (Vonmoos et al.2013b). It is note-worthy that differences (Δt2–t1) in self-reported impul-sivity between the two testing sessions did not significantly correlate with changes in cognitive impul-sivity tasks (CU: r < 0.30, p > 0.05; HC: r < −0.30, p > 0.05; total sample: r <−0.15, p > 0.25). This finding is in line with prior studies conducted in our laboratory where trait impulsivity was only weakly correlated with behavioural impulsivity task measures (Quednow et al. 2007; Vonmoos et al. 2013b; Hulka et al.2014) and, thus, underlines the multi-faceted con-cept of the impulsivity construct. The reasons why users, who changed their cocaine use pattern, per-ceived their impulsivity levels to be more or less pro-nounced, remains to be determined in further investigations. One could speculate though that the subjective recognition of changes in impulsivity is more sensitive than the behavioural measures or that specific facets of impulsivity were not covered by our behavioural tasks. Alternatively, CUs’ personal thoughts, attitudes, and intentions to change their co-caine use might have influenced subjectively reported impulsivity levels. Accordingly, increasers may be more concerned with their loss of control over drug in-take and/or may also experience more aversive conse-quences due to their increased cocaine use fostering worries. Decreasers on the other hand may have per-ceived themselves as less impulsive because they had a desire to reduce their cocaine use and made a conscious effort to control their impulsivity. Correspondingly, research on attentional bias modifi-cation and substance use has shown that individuals who express a desire to reduce their use respond Table 3. One-year test–retest reliability between baseline and 1-year follow-up in controls and cocaine users
Controls (n = 48)
Cocaine users (n = 57)
BIS total score 0.81*** 0.75***
RVP respone bias B″ 0.30* 0.35**
DD k total (log) 0.52*** 0.43***
IGT total score 0.45** 0.43**
BIS, Barratt Impulsiveness Scale; RVP, Rapid Visual Processing task; DD, delay discounting task; IGT, Iowa Gambling task.
Pearson’s product-moment correlation.
Significance levels: *p < 0.05, **p < 0.01, ***p < 0 .001. 3106 L. M. Hulka et al.
https:/www.cambridge.org/core/terms. https://doi.org/10.1017/S0033291715001063
much better to treatment and show less impulsivity (Wiers & Stacy, 2006). Moreover, it has been shown that increased impulsivity in the BIS is associated with more treatment dropouts and shorter treatment duration in CU (Moeller et al. 2001b; Patkar et al. 2004). Therefore, treatment approaches should foster awareness in CU that they often act impulsively and without foresight for negative consequences, but that these cognitive-behavioural tendencies can be reduced with mindfulness-based and other cognitive-behavioural relapse prevention strategies (Dakwar & Levin,2013).
It is also noteworthy that self-reported attentional and motor impulsivity were significantly associated with more pronounced ADHD symptoms. These results are in line withfindings from our cross-sectional study (Vonmoos et al. 2013b) as well as with previous studies postulating a substantial comorbidity of ADHD with substance use disorders (van Emmerik-van Oortmerssen et al. 2012). Unfortunately, we omitted to assess the ADHD-SR questionnaire at the follow-up test session and are therefore not able to directly ana-lyse the covariation of changes in ADHD symptoms with changes of impulsivity measures.
In the present study, temporal discounting prefer-ences as measured by DD did not vary with increased or decreased cocaine use, which is in line with previ-ous propositions that intertemporal discounting prefer-ences reflect a stable aspect of personality and can be considered as a trait marker (Odum2011a,b). A grow-ing body of evidence corroborates our finding by showing that individual discounting preferences in adolescents and adults are relatively stable over nu-merous time intervals ranging from 1 week to multiple years (for review see MacKillop, 2013). In addition, more pronounced delay discounting preferences have been suggested to be predictive of the initiation and es-calation of drug use (Ersche et al.2012,2013; Mahoney & Olmstead,2013) as well as poor treatment responses in human CU (Washio et al.2011). Furthermore, a pro-spective study yielded evidence that stronger tenden-cies to prefer immediate smaller over larger but later available amounts are associated with negative out-comes in thefinancial, academic, and health domains (Mischel et al.2011). Altogether, the results of the pre-sent study and priorfindings suggest that more pro-nounced delay discounting rates may be regarded as a relatively stable addiction endophenotype increasing the risk to initiate and maintain drug use (Odum 2011a,b; MacKillop,2013).
Impulsive action measured by the RVP response bias B″ was not significantly shifted in our CU and did not covary with changing drug use patterns. Thesefindings are consistent with the previously published results from the cross-sectional part of the ZuCo2St showing
that neither recreational nor dependent CU differed from controls regarding RVP B″ and Stop-Signal task performance (Vonmoos et al. 2013b). Accordingly, the ecological validity of the RVP response bias B’ regard-ing the measurement of addiction-related impulsive action might be questioned.
Thefinding that CU who decreased their consump-tion chose fewer favourable cards in the IGT at the se-cond assessment is somewhat puzzling. In the cross-sectional analysis published previously (Hulka et al.2014), we found that although dependent CU per-formed slightly worse than HC, the effect was not as pronounced as shown in previous studies (Bechara et al. 2002; Verdejo-Garcia et al. 2007; Kjome et al. 2010). We speculated that these differences might be explained by the fact that we paid our participants with real money according to their performance, which is in contrast to most prior studies reporting substantial differences between CU and HC. In line with our hypothesis are the results obtained in another study conducted by Vadhan et al. (2009) where CU were paid in real money and also did not perform sign-ificantly worse than HC in the IGT, suggesting that motivational factors may influence IGT performance in drug users. It is further noteworthy that while co-caine use patterns did not significantly differ between the user groups at baseline, decreasers had a higher cu-mulative cocaine usage than equal users and increasers. Therefore, we cannot fully rule out that decreasers were overall more impaired in their IGT performance due to their more pronounced cocaine use, which may not have been detected in the baseline assessment because of low statistical power.
There are some limitations inherent to this study: first, the sample sizes are relatively small for multi-level analyses. However, the data were also analysed with mixed design analyses of covariance yielding comparable results (not reported here). Second, in addition to the increased cocaine consumption, increa-sersalso drank more alcohol than decreasers and tested positive for recent cocaine use more frequently than decreasers. However, the rise in weekly alcohol use was based on an increased alcohol intake in only three of 19 cocaine increasers and excluding these sub-jects did not alter the main results. Third, although the group assignment of increasers, decreasers, and equal userswas based on objective hair toxicology cap-turing the past 6 months, for thefirst 6 months of the time interval we had to rely on self-reported drug measures. Fourth, although our sample consisted of CU with relatively little polytoxic drug use, it should be mentioned that at baseline, cocaine increasers used low but significantly higher amounts of MDMA (0.04 v. 0.01 tablet per week) and used amphetamine (3.3 v. 1.3 years) for a longer period than decreasers. Self-reported impulsivity covaries with changing cocaine use 3107
https:/www.cambridge.org/core/terms. https://doi.org/10.1017/S0033291715001063
Furthermore, at follow-up cocaine increasers revealed a slightly higher use of MDMA and methylphenidate compared to baseline and had an additional augmen-tation in weekly alcohol use. Whereas the change in MDMA use was less than half a tablet per week, the difference in methylphenidate consumption was explained by a single individual. However, exclusion of the single methylphenidate user did not change the main results in separate analyses. Thus, although changes in other drugs should be considered as a contributing factor to our results, it seems reasonable that compared to the strong increase in cocaine use, the effect of changed use of other drugs is likely rather small. Fifth, our CU groups differed from controls regarding ADHD and depressive symp-toms, which is in accordance with the current litera-ture (Swendsen & Merikangas, 2000; Wilson, 2007). However, we tried to overcome this constraint by introducing these variables in the multilevel regres-sion analyses.
These 1-year longitudinal data indicate for the first time that self-reported impulsivity and impulsive choice requiring the integration of risk, reward, and loss con-tingencies (as measured with the IGT) covary with changing cocaine use, while a response bias measure and delay discounting preferences remain largely un-affected. Accordingly, self-reported impulsivity and gambling decision-making measures are less suitable for predicting the risk to develop a cocaine use dis-order but might be used to monitor treatment success. By contrast, the preference for immediate smaller rewards over larger delayed rewards seems to be a stable trait marker for cocaine use and, thus, may re-present a suitable endophenotype for stimulant addiction.
Supplementary material
For supplementary material accompanying this paper visit http://dx.doi.org/10.1017/S0033291715001063
Acknowledgements
We are grateful to Daniela Jenni, Kathrin Küpeli, and Franziska Minder for excellent support of recruitment and assessment of the participants. The study was supported by grants from the Swiss National Science Foundation (SNSF; grant No. PP00P1-123516/1 and PP00P1-146326/1) and the Olga Mayenfisch Foundation. Declaration of Interest
None.
References
Aharonovich E, Hasin DS, Brooks AC, Liu X, Bisaga A, Nunes EV (2006). Cognitive deficits predict low treatment retention in cocaine dependent patients. Drug and Alcohol Dependence 81, 313–322.
APA (1994). American Psychological Association. Diagnostic and statistical manual of mental disorders: DSM-IV. American Psychiatric Association (APA): Washington, DC.
Bechara A (2003). Risky business: emotion, decision-making, and addiction. Journal of Gambling Studies 19, 23–51. Bechara A, Dolan S, Hindes A (2002). Decision-making and
addiction (part II): myopia for the future or hypersensitivity to reward? Neuropsychologia 40, 1690–1705.
Beck AT, Ward CH, Mendelson M, Mock J, Erbaugh J (1961). An inventory for measuring depression. Archives of General Psychiatry 4, 561–571.
Bush DM (2008). The U.S. mandatory guidelines for federal workplace drug testing programs: current status and future considerations. Forensic Science International 174, 111–119. Colzato LS, van den Wildenberg WP, Hommel B (2007).
Impaired inhibitory control in recreational cocaine users. PLoS ONE 2, e1143.
Cooper GA, Kronstrand R, Kintz P, Society of Hair T (2012). Society of hair testing guidelines for drug testing in hair. Forensic Science International 218, 20–24.
Cunha PJ, Bechara A, de Andrade AG, Nicastri S (2011). Decision-making deficits linked to real-life social dysfunction in crack cocaine-dependent individuals. American Journal on Addictions 20, 78–86.
Dakwar E, Levin FR (2013). Individual mindfulness-based psychotherapy for cannabis or cocaine dependence: a pilot feasibility trial. American Journal of Addiction 22, 521–526. Elliott R, Sahakian BJ, McKay AP, Herrod JJ, Robbins TW,
Paykel ES (1996). Neuropsychological impairments in unipolar depression: the influence of perceived failure on subsequent performance. Psychological Medicine 26, 975–989. EMCDDA (2014). European Monitoring Centre for Drugs and
Drug Addiction. European Drug Report 2014. Trends and Developments. p. 88. Publications Office of the European Union: Luxembourg.
Ersche KD, Barnes A, Jones PS, Morein-Zamir S, Robbins TW, Bullmore ET (2011). Abnormal structure of frontostriatal brain systems is associated with aspects of impulsivity and compulsivity in cocaine dependence. Brain 134, 2013–2024.
Ersche KD, Jones PS, Williams GB, Smith DG, Bullmore ET, Robbins TW (2013). Distinctive personality traits and neural correlates associated with stimulant drug use versus familial risk of stimulant dependence. Biological Psychiatry 74, 137–144.
Ersche KD, Turton AJ, Chamberlain SR, Muller U, Bullmore ET, Robbins TW (2012). Cognitive dysfunction and anxious-impulsive personality traits are
endophenotypes for drug dependence. American Journal of Psychiatry 169, 926–936.
Ersche KD, Turton AJ, Pradhan S, Bullmore ET, Robbins TW (2010). Drug addiction endophenotypes: impulsive versus sensation-seeking personality traits. Biological Psychiatry 68, 770–773.
3108 L. M. Hulka et al.
https:/www.cambridge.org/core/terms. https://doi.org/10.1017/S0033291715001063
Fellows LK (2004). The cognitive neuroscience of human decision making: a review and conceptual framework. Behavioral and Cognitive Neuroscience Reviews 3, 159–172. Field M, Schoenmakers T, Wiers RW (2008). Cognitive
processes in alcohol binges: a review and research agenda. Current Drug Abuse Reviews 1, 263–279.
Franken IH (2003). Drug craving and addiction: integrating psychological and neuropsychopharmacological
approaches. Progress in Neuro-Psychopharmacology and Biological Psychiatry 27, 563–579.
Gelman A, Hill J (2007). Data Analysis Using Regression and Multilevel/Hierarchical Models. Cambridge University Press: New York.
Goldstein RZ, Volkow ND (2011). Dysfunction of the prefrontal cortex in addiction: neuroimagingfindings and clinical implications. Nature Reviews Neuroscience 12, 652–669. Green DM, Swets JA (1966). Signal Detection Theory and
Psychophysics. Wiley: New York.
Heatherton TF, Kozlowski LT, Frecker RC, Fagerstrom KO (1991). the fagerstrom test for nicotine dependence: a revision of the fagerstrom tolerance questionnaire. British Journal of Addiction 86, 1119–1127.
Hoelzle C, Scheufler F, Uhl M, Sachs H, Thieme D (2008). Application of discriminant analysis to differentiate between incorporation of cocaine and its congeners into hair and contamination. Forensic Science International 176, 13–18.
Hulka LM, Eisenegger C, Preller KH, Vonmoos M, Jenni D, Bendrick K, Baumgartner MR, Seifritz E, Quednow BB (2014). Altered social and non-social decision-making in recreational and dependent cocaine users. Psychological Medicine 44, 1015–1028.
Kendler KS, Myers J, Prescott CA (2007). Specificity of genetic and environmental risk factors for symptoms of cannabis, cocaine, alcohol, caffeine, and nicotine dependence. Archives of General Psychiatry 64, 1313–1320. Kirby KN, Petry NM, Bickel WK (1999). Heroin addicts
have higher discount rates for delayed rewards than non-drug-using controls. Journal of Experimental Psychology. General 128, 78–87.
Kjome KL, Lane SD, Schmitz JM, Green C, Ma L, Prasla I, Swann AC, Moeller FG (2010). Relationship between impulsivity and decision making in cocaine dependence. Psychiatry Research 178, 299–304.
Kreek MJ, Nielsen DA, Butelman ER, LaForge KS (2005). Genetic influences on impulsivity, risk taking, stress responsivity and vulnerability to drug abuse and addiction. Nature Neuroscience 8, 1450–1457.
Lehrl S (1999). Mehrfachwahl-Wortschatz-Intelligenztest (MWT-B), 4th edn. Spitta: Balingen.
Littlefield AK, Sher KJ, Wood PK (2009). Is ‘maturing out’ of problematic alcohol involvement related to personality change? Journal of Abnormal Psychology 118, 360–374. Locascio JJ, Atri A (2011). An overview of longitudinal data
analysis methods for neurological research. Dementia and Geriatric Cognitive Disorders Extra 1, 330–357.
Lucantonio F, Stalnaker TA, Shaham Y, Niv Y, Schoenbaum G (2012). The impact of orbitofrontal dysfunction on cocaine addiction. Nature Neuroscience 15, 358–366.
MacKillop J (2013). Integrating behavioral economics and behavioral genetics: delayed reward discounting as an endophenotype for addictive disorders. Journal of the Experimental Analysis of Behavior 99, 14–31.
Mahoney MK, Olmstead MC (2013). Neurobiology of an endophenotype: modeling the progression of alcohol addiction in rodents. Current Opinion in Neurobiology 23, 607–614.
Marhe R, Waters AJ, van de Wetering BM, Franken IHA (2013). Implicit and explicit drug-related cognitions during detoxification treatment are associated with drug relapse: an ecological momentary assessment study. Journal of Consulting and Clinical Psychology 81, 1–12.
Mischel W, Ayduk O, Berman MG, Casey BJ, Gotlib IH, Jonides J, Kross E, Teslovich T, Wilson NL, Zayas V, Shoda Y (2011).‘Willpower’ over the life span: decomposing self-regulation. Social Cognitive and Affective Neuroscience 6, 252–256.
Moeller FG, Barratt ES, Dougherty DM, Schmitz JM, Swann AC (2001a). Psychiatric aspects of impulsivity. American Journal of Psychiatry 158, 1783–1793.
Moeller FG, Dougherty DM, Barratt ES, Schmitz JM, Swann AC, Grabowski J (2001b). The impact of impulsivity on cocaine use and retention in treatment. Journal of Substance Abuse and Treatment 21, 193–198.
NSDUH (2014). National survey of drug use and health. trends in prevalence of various drugs for ages 12 or older, ages 12 to 17, ages 18 to 25, and ages 26 or older. http:// www.drugabuse.gov/national-survey-drug-use-health. Accessed 13 October 2014.
Nutt D, King LA, Saulsbury W, Blakemore C (2007). Development of a rational scale to assess the harm of drugs of potential misuse. Lancet 369, 1047–1053.
Odum AL (2011a). Delay discounting: I’m a k, you’re a k. Journal of the Experimental Analysis of Behavior 96, 427–439. Odum AL (2011b). Delay discounting: trait variable?
Behavioural Processes 87, 1–9.
Patkar AA, Murray HW, Mannelli P, Gottheil E, Weinstein SP, Vergare MJ (2004). Pre-treatment measures of impulsivity, aggression and sensation seeking are associated with treatment outcome for African-American cocaine-dependent patients. Journal of Addictive Diseases 23, 109–122.
Patton JH, Stanford MS, Barratt ES (1995). Factor structure of the Barratt impulsiveness scale. Journal of Clinical Psychology 51, 768–774.
Perry JL, Carroll ME (2008). The role of impulsive behavior in drug abuse. Psychopharmacology 200, 1–26.
Preller KH, Hulka LM, Vonmoos M, Jenni D, Baumgartner MR, Seifritz E, Dziobek I, Quednow BB (2014). Impaired emotional empathy and related social network deficits in cocaine users. Addiction Biology 19, 452–466.
Quednow BB, Kuhn KU, Hoenig K, Maier W, Wagner M (2004). Prepulse inhibition and habituation of acoustic startle response in male MDMA (‘ecstasy’) users, cannabis users, and healthy controls. Neuropsychopharmacology 29, 982–990.
Quednow BB, Kuhn KU, Hoppe C, Westheide J, Maier W, Daum I, Wagner M (2007). Elevated impulsivity and Self-reported impulsivity covaries with changing cocaine use 3109
https:/www.cambridge.org/core/terms. https://doi.org/10.1017/S0033291715001063
impaired decision-making cognition in heavy users of MDMA (‘Ecstasy’). Psychopharmacology 189, 517–530. Reske M, Delis DC, Paulus MP (2011). Evidence for subtle
verbalfluency deficits in occasional stimulant users: quick to play loose with verbal rules. Journal of Psychiatric Research 45, 361–368.
Roesler M, Retz W, Retz-Junginger P, Thome J, Supprian T, Nissen T, Stieglitz R-D, Blocher D, Hengesch G, Trott GE (2004). Tools for the diagnosis of attention-deficit/ hyperactivity disorder in adults. Self-rating behaviour questionnaire and diagnostic checklist. Nervenarzt 75, 888–895.
StataCorp. (2011). Stata Statistical Software: Release 12. StataCorp LP: Texas.
Stevens L, Verdejo-Garcia A, Goudriann AE, Royers H, Dom G, Vanderplasschen W (2014). Impulsivity as a vulnerability factor for poor addiction treatment outcomes: a review of neurocognitivefindings among individuals with substance use disorders. Journal of Substance Abuse Treatment 47, 58–72.
Substance Abuse and Mental Health Services
Administration (2008). Mandatory guidelines for federal workplace drug testing programs. Federal Register 73, 71858–71907.
Sussner BD, Smelson DA, Rodrigues S, Kline A, Losonczy M, Ziedonis D (2006). The validity and reliability of a brief measure of cocaine craving. Drug and Alcohol Dependence 83, 233–237.
Swendsen JD, Merikangas KR (2000). The comorbidity of depression and substance use disorders. Clinical Psychology Review 20, 173–189.
Tabachnik B, Fidell L (2006). Using Multivariate Statistics. Pearson Education: Boston.
UNODC (2014). United Nations Office on Drugs and Crime. World Drug Report 2014. p. 128. United Nations Publication: Vienna. Vadhan NP, Hart CL, Haney M, van Gorp WG, Foltin RW
(2009). Decision-making in long-term cocaine users: Effects of a cash monetary contingency on Gambling task performance. Drug and Alcohol Dependence 102, 95–101. van Emmerik-van Oortmerssen K, van de Glind G, van den
Brink W, Smit F, Crunelle CL, Swets M, Schoevers RA (2012). Prevalence of attention-deficit hyperactivity disorder in substance use disorder patients: a meta-analysis and meta-regression analysis. Drug and Alcohol Dependence 122, 11–19.
Verdejo-Garcia A, Albein-Urios N, Martinez-Gonzalez JM, Civit E, de la Torre R, Lozano O (2014). Decision-making
impairment predicts 3-month hair-indexed cocaine relapse. Psychopharmacology 231, 4179–4187.
Verdejo-Garcia A, Benbrook A, Funderburk F, David P, Cadet JL, Bolla KI (2007). The differential relationship between cocaine use and marijuana use on decision-making performance over repeat testing with the Iowa Gambling Task. Drug and Alcohol Dependence 90, 2–11.
Verdejo-Garcia A, Lawrence AJ, Clark L (2008). Impulsivity as a vulnerability marker for substance-use disorders: review offindings from high-risk research, problem gamblers and genetic association studies. Neuroscience and Biobehavioral Reviews 32, 777–810.
Vonmoos M, Hulka LM, Preller KH, Jenni D, Baumgartner MR, Stohler R, Bolla KI, Quednow BB (2013a). Cognitive dysfunctions in recreational and dependent cocaine users: role of attention-deficit hyperactivity disorder, craving and early age at onset. British Journal of Psychiatry 203, 35–43.
Vonmoos M, Hulka LM, Preller KH, Jenni D, Schulz C, Baumgartner MR, Quednow BB (2013b). Differences in self-reported and behavioral measures of impulsivity in recreational and dependent cocaine users. Drug and Alcohol Dependence 133, 61–70.
Vonmoos M, Hulka LM, Preller KH, Minder F, Baumgartner MR, Quednow BB (2014). Cognitive Impairment in Cocaine Users is Drug-Induced but Partially Reversible: Evidence from a Longitudinal Study.
Neuropsychopharmacology 39, 2200–2210.
Wagner FA, Anthony JC (2002). Fromfirst drug use to
drug dependence; developmental periods of risk for dependence upon marijuana, cocaine, and alcohol. Neuropsychopharmacology 26, 479–488.
Washio Y, Higgins ST, Heil SH, McKerchar TL, Badger GJ, Skelly JM, Dantona RL (2011). Delay discounting is associated with treatment response among
cocaine-dependent outpatients. Experimental and Clinical Psychopharmacology 19, 243–248.
Wiers RW, Stacy AW (2006). Implicit cognition and addiction. Current Directions in Psychological Science 15, 292–296.
Wilson JJ (2007). ADHD and substance use disorders: developmental aspects and the impact of stimulant treatment. American Journal on Addictions 16 (Suppl. 1), 5–11. Winstanley CA, Olausson P, Taylor JR, Jentsch JD (2010).
Insight into the relationship between impulsivity and substance abuse from studies using animal models. Alcoholism, Clinical and Experimental Research 34, 1306–1318. 3110 L. M. Hulka et al.
https:/www.cambridge.org/core/terms. https://doi.org/10.1017/S0033291715001063