Predicting the Response to Combination
Antiretroviral Therapy: Retrospective Validation of
geno2pheno-THEO on a Large Clinical Database
André Altmann,1Martin Däumer,2Niko Beerenwinkel,4Yardena Peres,5Eugen Schülter,3Joachim Büch,1 Soo-Yon Rhee,6Anders Sönnerborg,8W. Jeffrey Fessel,7Robert W. Shafer,6Maurizio Zazzi,9Rolf Kaiser,3and Thomas Lengauer11Max Planck Institute for Informatics, Saarbrücken,2Institute of Immunology and Genetics, Kaiserslautern, and3Institute of Virology, University of Cologne, Cologne, Germany;4Department of Biosystems Science and Engineering, ETH Zürich, Basel, Switzerland;5IBM Research, Haifa, Israel; 6Division of Infectious Diseases, Stanford University, Stanford, and7Kaiser Permanente Medical Care Program, Northern California, San Francisco; 8Karolinska Institute, Stockholm, Sweden;9Department of Molecular Biology, University of Siena, Siena, Italy
Background. Expert-based genotypic interpretation systems are standard methods for guiding treatment selec-tion for patients infected with human immunodeficiency virus type 1. We previously introduced the software pipeline geno2pheno-THEO (g2p-THEO), which on the basis of viral sequence predicts the response to treatment with a combination of antiretroviral compounds by applying methods from statistical learning and the estimated potential of the virus to escape from drug pressure.
Methods. We retrospectively validated the statistical model used by g2p-THEO in ⬃7600 independent treatment-sequence pairs extracted from the EuResist integrated database, ranging from 1990 to 2007. Results were compared with the 3 most widely used expert-based interpretation systems: Stanford HIVdb, ANRS, and Rega.
Results. The difference in receiver operating characteristic curves between g2p-THEO and expert-based ap-proaches was significant (P⬍ .001; paired Wilcoxon test). Indeed, at 80% specificity, g2p-THEO found 16.2%– 19.8% more successful regimens than did the expert-based approaches. The increased performance of g2p-THEO was confirmed in a 2001–2007 data set from which most obsolete therapies had been removed.
Conclusion. Finding drug combinations that increase the chances of therapeutic success is the main reason for using decision support systems. The present analysis of a large data set derived from clinical practice demonstrates that g2p-THEO solves this task significantly better than state-of-the-art expert-based systems. The tool is available at http://www.geno2pheno.org.
Several drug classes have been developed that target HIV-1 replication at different stages. Although the re-cently licensed coreceptor antagonists and integrase inhibitors have just entered clinical practice, combina-tions of nucleoside/nucleotide reverse-transcriptase in-hibitors, nonnucleoside reverse-transcriptase inhibitors (NNRTIs), and protease inhibitors (PIs) have been
ex-tensively used and still remain the backbone of most highly active antiretroviral therapy (HAART) regimens. Because of the high propensity of HIV-1 to develop re-sistance to any antiretroviral compound, building an ef-fective treatment regimen in clinical practice typically in-volves screening the viral genome for known resistance mutations. Several genotype interpretation systems infer in vitro drug susceptibility and/or in vivo response to antiret-roviral treatment on the basis of HIV-1 genotype. Most of these tools use a set of rules carefully crafted by experts and classify the virus as susceptible, intermediate, or resistant to each of the single compounds. Few tools are fully data driven rather than based on expert knowledge. For exam-ple, geno2pheno[resistance] [1] and VirtualPhenotype [2] apply methods from statistical learning to predicting in vi-tro resistance on the basis of genotype.
Although all of these methods are designed to infer sus-ceptibility to individual compounds [3], recently
devel-Received 25 July 2008; accepted 28 October 2008; electronically published 24 February 2009.
Potential conflicts of interest: none reported.
Presented in part: 5th European HIV Drug Resistance Workshop, Cascais, Portugal, 28 –30 March 2007 (abstract 55).
Financial support: EuResist project (European Union grant IST-4- 027173-STP to Max Planck Institute for Informatics).
Reprints or correspondence: Mr. André Altmann, Max Planck Institute for Informatics, Campus E1.4, Saarbrücken, Germany ([email protected]).
The Journal of Infectious Diseases 2009; 199:999 –1006
© 2009 by the Infectious Diseases Society of America. All rights reserved. 0022-1899/2009/19907-0012$15.00
DOI: 10.1086/597305
oped decision support tools are being explored to infer virological response directly to a typical 3– 4-drug HAART regimen. In one study [4], artificial neural networks were used to predict the change in viral load, given the sequence, regimen, and additional host-specific features. In another recent work, we introduced the soft-ware pipeline geno2pheno-THEO (g2p-THEO) [5], which predicts the probability of reaching an undetectable viral load during the course of the regimen given the applied drug combination and the genetic makeup of the viral population. A quantitative and proba-bilistic description of the genetic barrier to drug resistance was in-cluded as an additional predictor. The genetic barrier is the esti-mated probability that the virus will not escape from drug pressure by developing additional mutations [6].
In this work, we present the external validation of g2p-THEO in a data set containing 7600 treatment-sequence pairs collected in a Europe-wide effort [7]. Virological response was dichoto-mized, and performance was compared with 3 state-of-the-art expert-based interpretation tools. In subsequent analyses, vari-ous techniques of statistical learning were applied to (1) assess the putative improvement in prediction accuracy incurred by applying models for specific drug combinations and (2) investi-gate the reliability of g2p-THEO when applied to unseen com-binations of compounds—that is, those comcom-binations that are not contained in the training data set.
METHODS
Treatment change episodes (TCEs). The present study used the previously introduced definition of a TCE [5], on which g2p-THEO is based. Briefly, a TCE consists of a genotype, a drug combination, and a binary outcome indicating success or fail-ure. A genotype derived during ongoing therapy is considered a failure, because a genotype can only be determined if the viral load is sufficiently high (HIV RNA level of⬃1000 copies/mL). A success is observed if the new therapy that follows a genotypic test can reduce the viral load to below the limit of detection once
during the course of the therapy. Although current assays have a threshold of sensitivity of 40 or 50 copies, the 400-copy thresh-old was used to include data obtained by earlier assays.
Data sets. The statistical model applied by g2p-THEO was trained on data obtained from the Stanford HIV Drug Resis-tance Database [8] (comprising data from clinical studies ACTG 320, ACTG 364, GART, and HAVANA) and from 2 northern California clinic populations undergoing genotypic resistance testing at Stanford University. From a total of 25,717 therapies, 10,288 sequences, and 6706 patients, 6359 TCEs were extracted (4776 failing and 1583 successful therapies). This data set is here-after called “Stanford-California.” Overrepresentation of certain compounds in failing or successful therapies within the Stanford-California data set led the statistical learning models to often base their decisions only on the drug combination, irre-spective of the genotype. To eliminate this artifact, g2p-THEO was trained not on the full data set but on a subset that contained the same number of failure- and success-associated genotypes for every drug combination (see Altmann et al. [5] for details). The number of genotypes per drug combination ranges from 2 to 446 (2478 TCEs in total). Hereafter, this data set is called “Stanford-CaliforniaBT” (for “balanced therapies”). In some analyses, both the California and the Stanford-CaliforniaBT data sets were evaluated again after removal of zidovudine (ZDV) ⫹ lamivudine (3TC) ⫹ indinavir (IDV) combination therapy, which was overrepresented because of the inclusion of the large ACTG 320 data set. For further analysis, a subset of Stanford-California containing only drug combina-tions with肁20 successes and 肁20 failures was selected. Only 6 treatments met this requirement (table 1); hereafter, this data set is called “Stanford-California6.”
Using the same definition, an independent TCE data set (Eu-ResistDB) was extracted from the EuResist integrated database (version 29.05.2007), comprising data from Germany (Arevir) [9], Italy (ARCA) [10], and Sweden (Karolinska Institute). From a total of 58,195 therapies, 19,258 sequences, and 16,999 pa-Table 1. Distribution of failing and successful treatment change episodes for
the 6 most common regimens in the Stanford-California and EuResistDB data sets (Stanford-California6 and EuResistDB6 subsets).
Stanford-California6 EuResistDB6 Regimen Failure Success Total Failure Success Total
ZDV⫹3TC⫹IDV 223 229 452 108 5 113 d4T⫹3TC⫹SQV/r 71 28 99 27 2 29 ddI⫹d4T⫹EFV 96 54 150 132 25 157 d4T⫹3TC⫹EFV 60 27 87 114 16 130 ddI⫹d4T⫹NFV 110 28 138 131 22 153 d4T⫹3TC⫹NFV 275 28 303 209 16 225 All regimens 835 394 1229 721 86 807
NOTE. 3TC, lamivudine; d4T, stavudine; ddI, didanosine; EFV, efavirenz; IDV, indinavir; NFV, nelfinavir; SQV/r, saquinavir/ritonavir; ZDV, zidovudine.
tients, we obtained 7603 TCEs (6217 failing and 1386 successful therapies). For further analysis, we generated the subset EuRe-sistDB6, comprising the same 6 drug combinations as in Stanford-California6 (table 1). Because the EuResist integrated database includes antiretroviral treatments started from 1990 to 2007, the main analysis was repeated on the TCE subset derived from treatments started after 31 December 2000, to minimize the contribution of obsolete therapy records.
Interpretation systems. ANRS (version 2006/07) [11], Rega (version 7.1.1) [12], and Stanford HIVdb (version 4.3.0) [8] are expert-based interpretation methods. These algorithms apply carefully handcrafted interpretation rules or tables derived by expert panels from the analysis of available in vitro and in vivo resistance data. In addition, some rules of the ANRS algorithm were derived from the statistical association between baseline genotypic data and virological response. The classification gen-erated by the interpretation systems was normalized into a score by mapping susceptible (ANRS, Rega, and Stanford HIVdb) or potential low-level resistance (Stanford HIVdb) to 1.0; interme-diate (Rega) or possible resistance (ANRS) or low-level or inter-mediate resistance (Stanford HIVdb) to 0.5; and resistant (ANRS and Rega) or high-level resistance (Stanford HIVdb) to 0.0. Thus, the rating numerically represents the activity of a drug against the virus on a scale ranging from 0 (inactive) to 1 (fully active). Individual scores for NNRTIs and for boosted PIs com-puted using the Rega algorithm were converted to 1.0, 0.25, and 0.0 and to 1.5, 0.75, and 0.0, respectively, as indicated by the algorithm developers. The treatment score or genotypic suscep-tibility score (GSS) [13] was then defined as the sum of single-drug scores for the compounds included in the regimen.
g2p-THEO is a data-driven interpretation system that directly computes a rating for a combination therapy. This value can be interpreted as the probability of the viral load being reduced to be-low the limit of detection during the course of therapy. g2p-THEO represents the HIV-1 genotype by 49 indicator variables, each of them indicating the presence (1) or absence (0) of a resistance mu-tation [14] (for the complete list, see appendix A). Similarly, treat-ment is encoded using 17 indicator variables, each representing the presence (1) or absence (0) of a compound in the regimen (for the list of considered compounds, see appendix A). In addition, viral evolution during the course of therapy is represented by the genetic barrier to drug resistance [6] for all drugs in the regimen. The ge-netic barrier is the probability that the virus will remain susceptible under drug pressure, given as a numerical value between 0 (no ge-netic barrier [i.e., the virus is expected to become resistant]) and 1 (insurmountable genetic barrier [i.e., the virus is expected to re-main susceptible]). Together with the indicator variables, the ge-netic barrier (1 value per drug) is used as input to the logistic model tree (LMT) [15] applied by g2p-THEO to compute a score for a combination therapy.
Receiver operating characteristic (ROC) curves. ROC curves depict classifier performance by giving a true-positive rate (TPR;
percentage of correctly predicted successes) for every false-positive rate (FPR; percentage of failing therapies [i.e., with a genotype ob-tained during treatment] that were predicted to be successful [i.e., to decrease viral load to⬍400 copies/mL]). The area under the ROC curve (AUC) summarizes the performance and is a conve-nient measure for comparing scoring systems without the need to provide a particular cutoff [16]. Briefly, the AUC is a value between 0 and 1 corresponding to the probability that a randomly selected success receives a higher score than a randomly selected failure [17]. ROCR software (version 1.0-2) [18] was used for the ROC analysis. Comparative analysis. The statistical model applied by g2p-THEO was used to predict the outcome of the genotype-therapy pairs in the external EuResistDB data set. The performance was compared with that of the 3 expert-based interpretation tools: ANRS, Rega, and Stanford HIVdb. The EuResistDB data set was used as an independent test set. One hundred bootstrap replicates of the EuResistDB data set were used for computing SDs.
Stability. To further analyze the robustness of the approach, the prediction of response to drug combinations that were not present in the training data was simulated by a variant of cross-validation on the training data. In standard cross-cross-validation, the available data are split randomly into n equally sized nonoverlap-ping subsets. Then, n⫺ 1 pooled subsets are used as a training set, and the remaining subset is used as a test set to compute the perfor-mance of the model. This procedure is repeated n times. Hence, every subset is used as a test set once. To simulate the prediction of unseen drug combinations, the splits were not carried out randomly, and every subset contained only TCEs with the same drug combination. Results derived by this “therapy-fold” cross-validation were compared with results of standard cross-cross-validation, with the number of folds equal to the number of different drug combinations. A substantial loss in performance (e.g., a loss of 0.1 in AUC) for the therapy-fold cross-validation compared with the nor-mal protocol indicates unstable behavior with respect to unseen drug combinations, because it indicates the requirement to include examples of the drug combination that should be predicted in the training data for maintaining the performance. The experiment was repeated on the special subset Stanford-CaliforniaBT and on the complete EuResistDB data set. Because of limited computational resources, the LMT applied by g2p-THEO was replaced by the faster linear support vector machines (SVMs) [19], with similar predictive performance.
Regimen-specific models. For some drug combinations, many samples were available. Models trained exclusively on TCEs for 1 drug combination are expected to predict response to that regimen more accurately than models trained on all avail-able TCEs. The Stanford-California6 subset contained sufficient data for training 6 regimen-specific models and for measuring their performance. The performance of the individual models was assessed by 10 repetitions of 5-fold cross-validation on data comprising only 1 drug combination. The performance of the full model was assessed by 10 repetitions of a variant of 5-fold
cross-validation in which all TCEs with other drug combina-tions were added to the 4 subsets forming the training data. SVMs with a linear kernel were used as a statistical learning method. Performance in an independent test set was assessed by predicting the outcome of TCEs in EuResistDB6 with the full model and the 6 regimen-specific models (10 repetitions). Re-sults were compared with those obtained using g2p-THEO and the 3 expert-based interpretation tools.
RESULTS
Comparative analysis. Figure 1 depicts the ROC curves for the 3 expert-based interpretation tools and g2p-THEO. The curves for Stanford HIVdb, ANRS, and Rega did not differ sub-stantially, resulting in comparable TPRs and FPRs for every GSS cutoff. In contrast, in the FPR range from 0% to 40%, the curve for g2p-THEO was distinctly located above all the other curves. For higher FPRs, all curves proceeded with similar slopes. The AUC value for g2p-THEO was significantly larger than those for the expert-based approaches (P⬍ .001; paired Wilcoxon test). ROC curves allow for a detailed analysis of specific points on the curve. For example, at a FPR of 20% (close to a GSS cutoff of 2.5 for Rega and ANRS and of 2.0 for Stanford HIVdb), Stanford HIVdb, ANRS, and Rega yielded TPRs of 44.2% (SD, 3.2%),
47.8% (SD, 2.7%), and 46.5% (SD, 2.2%), respectively. In con-trast, at the same FPR g2p-THEO achieved a TPR of 64.0% (SD, 1.6%). On the other hand, at a false-negative rate (FNR) of 10% (close to a GSS cutoff of 1.0 for all systems), Stanford HIVdb, ANRS, and Rega yielded true-negative rates of 54.1% (SD, 2.0%), 51.0% (SD, 2.1%), and 55.9% (SD, 0.8%), respectively, compared with 54.7% (SD, 1.8%) for g2p-THEO. Restriction of the EuResistDB data set to therapies started after 31 December 2000 led to an even more pronounced difference in AUC be-tween g2p-THEO (0.824 [SD, 0.006]) and the expert-based ap-proaches (for Stanford HIVdb, 0.728 [SD, 0.008]; for ANRS, 0.733 [SD, 0.008]; for Rega, 0.754 [SD, 0.007]).
Stability. Table 2 summarizes the results of the stability anal-ysis. The standard cross-validation performance on the Stanford-California data set was in line with previously published results [5]. For both Stanford-California data sets containing the highly prev-alent ZDV⫹3TC⫹IDV regimen, the therapy-fold cross-validation yielded slightly worse results than the standard protocol (difference in AUC of⬃0.03). In contrast, in the EuResistDB data set and both Stanford-California data sets without ZDV⫹3TC⫹IDV, no loss in performance was observed.
Regimen-specific models. Table 3 shows the mean AUC and SD for the regimen-specific models and the full model for Figure 1. Receiver operating characteristic (ROC) curves for the EuResistDB data set. Every method is represented by a single ROC curve, namely Stanford HIVdb, ANRS, Rega, and geno2pheno-THEO (g2p-THEO). Each point on the curve represents a classifier with a different cutoff and allows the true-positive rate (TPR) and false-positive rate (FPR) for that cutoff to be determined. Whiskers indicate the SDs of the TPRs at a specific FPR. The genotypic susceptibility score (GSS) and predicted success probability (p) cutoffs leading to specific TPR and FPR values are indicated within the plot for expert-based approaches and g2p-THEO, respectively. For each method, the area under the ROC curve and its SD are given parenthetically in the box.
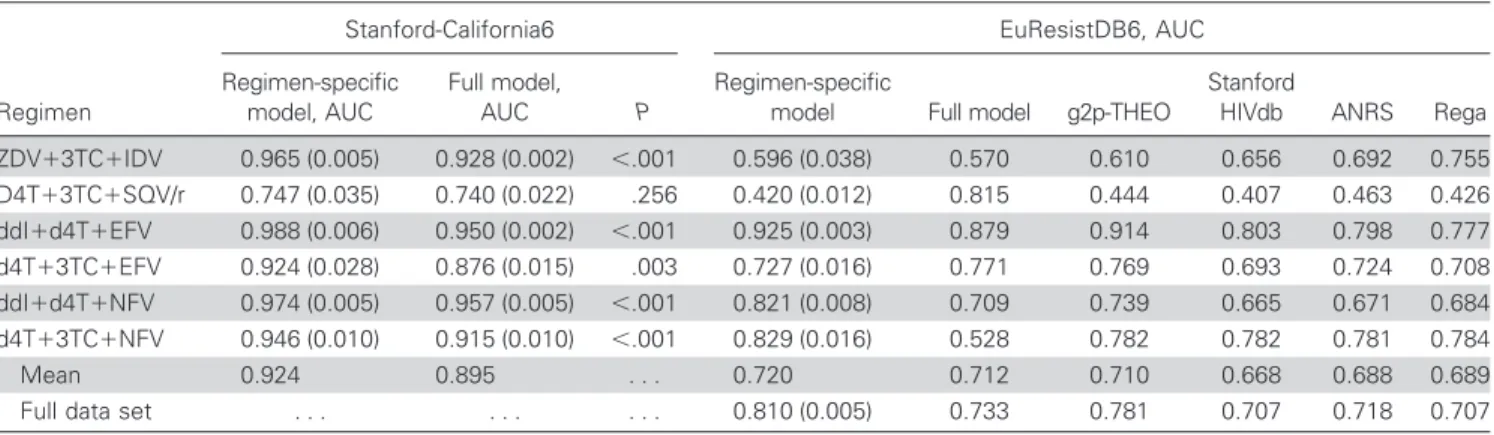
the 6 most common drug combinations in the Stanford-California data set. The results for the combination of stavudine (d4T)⫹ 3TC ⫹ saquinavir/ritonavir (SQV/r) were the worst for both models, and there was no benefit in using the regimen-specific model. However, for the remaining 5 drug combina-tions, the benefits of regimen-specific models ranged from 0.017 to 0.048 and reached statistical significance. Within the EuRe-sistDB6 data set, an insufficient number of successful TCEs was available for ZDV⫹3TC⫹IDV and d4T⫹3TC⫹SQV/r (table 1). The full model outperformed the regimen-specific model only for d4T⫹ 3TC ⫹ efavirenz (EFV). For the remaining 3 drug combinations, the benefit of the regimen-specific model was more pronounced than in the cross-validation setting and
ranged from 0.046 to 0.301 for d4T⫹ 3TC ⫹ nelfinavir (NFV), a combination for which the full model actually failed to make useful predictions. The LMTs in g2p-THEO also outperformed the regimen-specific model for d4T⫹3TC⫹EFV. In the remain-ing 3 cases, the benefit of the regimen-specific models ranged from 0.011 to 0.082. All regimen-specific models outperformed the expert-based methods.
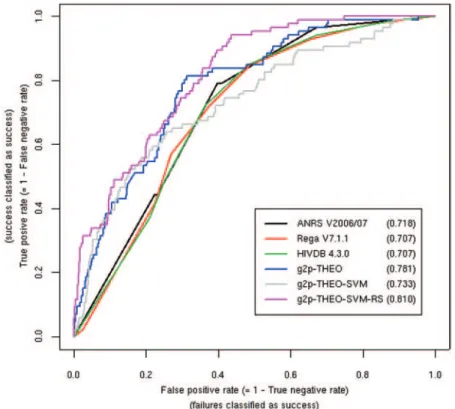
Figure 2 depicts the ROC curves for the regimen-specific models (THEO-SVM-RS), the full model (THEO-SVM), g2p-THEO, and the expert-based methods applied to the EuResistDB6 data set. The full model performed better than the expert-based methods in the area below a FPR of 32% but worse in the remaining region. As in the previous ROC plot (figure 1), g2p-THEO per-Table 2. Area under the receiver operating characteristic curve (AUC) values
obtained by standard cross-validation and therapy-fold cross-validation.
AUC Data set Drug combinations, no. Standard cross-validation Therapy-fold cross-validation Stanford-California With ZDV⫹3TC⫹IDV 876 0.901 0.870 Without ZDV⫹3TC⫹IDV 875 0.898 0.895 Stanford-CaliforniaBT With ZDV⫹3TC⫹IDV 323 0.838 0.812 Without ZDV⫹3TC⫹IDV 322 0.812 0.813 EuResistDB 712 0.847 0.844
NOTE. The rows of the table correspond to the 5 data sets, with both Stanford-California data sets studied with and without the zidovudine (ZDV)⫹ lamivudine (3TC) ⫹ indinavir (IDV) drug combination, in light of the overrepresentation of this regimen caused by the ACTG 320 data. (Stanford-CaliforniaBT is the “balanced therapies” subset; see Methods for a detailed explanation.) Note that computation of the AUC requires positive and negative samples, but because of the nature of therapy-fold cross-validation, it could not be ensured that positive and negative samples were present in every subset of the cross-validation. Thus, it was not possible to compute foldwise AUC values or their SDs and statistical significance.
Table 3. Area under the receiver operating characteristic curve (AUC) values for cross-validation and training test set-up.
Stanford-California6 EuResistDB6, AUC
Regimen Regimen-specific model, AUC Full model, AUC P Regimen-specific
model Full model g2p-THEO
Stanford
HIVdb ANRS Rega ZDV⫹3TC⫹IDV 0.965 (0.005) 0.928 (0.002) ⬍.001 0.596 (0.038) 0.570 0.610 0.656 0.692 0.755 D4T⫹3TC⫹SQV/r 0.747 (0.035) 0.740 (0.022) .256 0.420 (0.012) 0.815 0.444 0.407 0.463 0.426 ddI⫹d4T⫹EFV 0.988 (0.006) 0.950 (0.002) ⬍.001 0.925 (0.003) 0.879 0.914 0.803 0.798 0.777 d4T⫹3TC⫹EFV 0.924 (0.028) 0.876 (0.015) .003 0.727 (0.016) 0.771 0.769 0.693 0.724 0.708 ddI⫹d4T⫹NFV 0.974 (0.005) 0.957 (0.005) ⬍.001 0.821 (0.008) 0.709 0.739 0.665 0.671 0.684 d4T⫹3TC⫹NFV 0.946 (0.010) 0.915 (0.010) ⬍.001 0.829 (0.016) 0.528 0.782 0.782 0.781 0.784 Mean 0.924 0.895 . . . 0.720 0.712 0.710 0.668 0.688 0.689
Full data set . . . 0.810 (0.005) 0.733 0.781 0.707 0.718 0.707
NOTE. Rows correspond to the 6 regimens in the 2 data sets. The columns for the Stanford-California6 data show the AUC values derived by 10 repetitions of 5-fold cross-validation for the regimen-specific models and the full model using all available training data (SDs are in parentheses); P values for the comparison of the performances of the 2 models were obtained by the Wilcoxon rank-sum test. The columns for the EuResistDB6 data set show the AUC values for the regimen-specific models (SDs are in parentheses), with the full model using all Stanford-California data, the original geno2pheno-THEO (g2p-THEO) predictions, and the 3 expert-based approaches (Stanford HIVdb, ANRS, and Rega). 3TC, lamivudine; d4T, stavudine; ddI, didanosine; EFV, efavirenz; IDV, indinavir; NFV, nelfinavir; SQV/r, saquinavir/ritonavir; ZDV, zidovudine.
formed better than the expert-based interpretation tools in the area below a 50% FPR and performed as well in the remaining region. However, the regimen-specific models outperformed the other methods over the whole range of FPRs. More specifically, they yielded a TPR of 58.4% at a FPR of 20%, compared with 39.8% for the expert-based methods and 53.6% for g2p-THEO.
DISCUSSION
Validation of HIV genotype interpretation systems is a crucial step in translating computer-based methods into clinically effec-tive treatment decision support tools. In the present study, using an external data set of⬃7600 TCEs extracted from the EuResist integrated database, the recently developed g2p-THEO system was shown to outperform the 3 most widely used expert-based interpretation systems. Although the EuResist data set included many obsolete therapies because of its long observation period, the same results were confirmed when therapies started before 1 January 2001 were removed. The g2p-THEO system was more ac-curate than ANRS, Stanford HIVdb, and Rega by 16.2%–19.8% in the detection of therapeutic success (20% FPR). However, all of the systems were comparable in detecting treatment failure at a 10% FNR. This finding suggests that expert-based systems are better suited to detect the failure of therapy than to detect suc-cess, probably because their original purpose was to detect
resis-tance to individual drugs. However, whether a treatment will most likely be successful is exactly the response a user expects from a decision support tool. Current expert-based approaches are indeed evolving into clinically oriented tools aimed at build-ing effective combination regimens. Computbuild-ing a regimen GSS by simple summation of the individual drug scores derived by expert-based systems fails by definition to weight both different drug potencies and drug interaction effects. However, such an unweighted GSS is still commonly used [20, 21] in the absence of any agreed-upon standard for a weighted GSS. Notably, the lat-est Rega algorithm has introduced arbitrary drug weights in an attempt to account for the expected increased potency of ritonavir-boosted PIs and a lack of intermediate NNRTI activity. The superior performance of g2p-THEO may have derived from 2 factors. First, the calculated genetic barrier provides use-ful information by estimating the probability of viral evolution under drug pressure [5]. Second, the training process assigns weights to all drugs. Hence, during the decision making process, drugs are not treated equally. As shown in Altmann et al. [22], this can significantly improve the performance of genotype in-terpretation tools. On the other hand, g2p-THEO is currently limited to a set of well-established resistance mutations, which might explain its inability to improve the detection of failing regimens.
Figure 2. Receiver operating characteristic (ROC) curves for regimen-specific models applied to the EuResistDB6 data set. Every method is represented by a ROC curve for a subset of the EuResistDB data comprising 6 different treatments. In addition to the methods depicted in figure 1, ROC curves are shown for g2p-THEO-SVM (geno2pheno-THEO [g2p-THEO] in which logistic model trees were replaced by support vector machines [SVMs]) and g2p-THEO-SVM-RS (g2p-THEO using regimen-specific SVMs). For each method, the area under the ROC curve is given parenthetically in the box.
In the computation of a score for a drug combination, the ro-bustness of the tool with respect to unseen drug combinations is an important issue. In both Stanford-California data sets, a slight de-crease in the AUC was observed in predictions for unseen drug combinations. Overrepresentation of ZDV⫹3TC⫹IDV therapy due to inclusion of the ACTG 320 clinical trial in the data sets was identified as a possible confounder of this analysis, because no de-crease in performance with unseen drug combinations was ob-served after removal of TCEs containing the ZDV⫹3TC⫹IDV combination. Thus, our stability analysis indicated that g2p-THEO returns reliable scores for unobserved drug combinations. The ma-jor reason for the preservation of performance is that the prediction is based on a linear model. Indeed, during the learning process of the linear model, contributions of every single covariate to the out-come are computed. This also holds for drugs in a regimen, because the impact has to be distributed among these drugs. In the end, observed and unobserved drug combinations are both composed of observed compounds. However, this property is also a potential disadvantage of linear models. Specifically, if the prediction is based on a linear model, the synergistic effects between drugs or muta-tions cannot be represented unless a large number of covariates are introduced to explicitly model these effects. In contrast, in regimen-specific models all mutations are evaluated in the context of the same drug combination, thus rendering the explicit modeling of interactions unnecessary. In the Stanford-California6 data set, the regimen-specific models for all drug combinations exhibited in-creased performance compared with the full model, even though the full model had access to many more training samples. This find-ing was confirmed in independent data. However, the benefit of regimen-specific models decreased when they were compared with the full statistical model for g2p-THEO. This can be explained by the fact that g2p-THEO applies LMTs that directly train multiple linear models on distinct subsets of the training data. Unfortu-nately, only a few outdated regimens gave rise to enough training data for regimen-specific models. However, a promising approach has been recently proposed [23], one that pools data on “similar” regimens to overcome this limitation in generating regimen-specific models.
A major issue with any fully data-driven system is the in-ability to generate predictions for newly licensed compounds because of the delayed availability of sufficient training data. This drawback can be addressed only by multicenter efforts and cooperation between drug companies and regulatory bodies for immediate release of clinical trial data. However, because an optimized background regimen is recommended for the effective use of any new compound, interpretation systems are still relevant for choosing the backbone drugs, particularly in heavily experienced patients. Expert-based systems can complement data-driven systems for predicting the activity of novel drugs until sufficiently large genotype-response data sets are available.
Data-driven systems need a large amount of data for training, so observational cohort data are often used. These provide a valuable source for assessing the impact that drug resistance has on the re-sponse to treatment but typically lack other relevant information, including adherence levels and pharmacokinetics data. Weighting for these factors is expected to help us develop better systems aimed at building effective regimens. It must also be noted that modern and future antiretroviral treatment strategies are expected to limit the development of drug resistance by providing increased potency and convenience, perhaps making treatment toxicity issues rela-tively more relevant than resistance over time. However, drug resis-tance and cross-resisresis-tance remain issues for a substantial propor-tion of patients harboring viral populapropor-tions that display a complex mutational pattern because of multiple treatment failures. In addi-tion, toxicity is also a major contributor to the selection of drug resistance through decreased adherence. Developed as a clinically oriented tool, g2p-THEO allows the user to exclude specific drugs for toxicity issues and provides a total pill count for each regimen. Although no data-driven system is meant to replace a comprehen-sive patient evaluation by an expert HIV specialist, validated tools such as g2p-THEO can provide an appropriate support to most caregivers of HIV-infected patients.
APPENDIX A
INDICATOR VARIABLES AND SVM SETTINGS
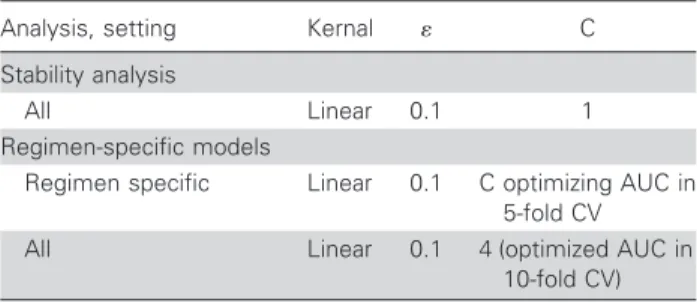
We used indicators for the following mutations: for protease, 10F/ I/R/V, 16E, 20M/R/I, 24I, 30N, 32I, 33F/I/V, 36I/L/V, 46I/L, 47V/A, 48V, 50L/V, 53L, 54L/V/M/T/A/S, 60E, 62V, 63P, 71V/T/I/L, 73S/ A/C/T, 77I, 82A/F/T/S, 84V, 88D/S, 90M, and 93L; for reverse transcriptase, 41L, 44D, 62V, 65R, 67N, 70R, 74V, 75T/M/S/A/I, 77L, 100I, 103N, 106A/M, 108I, 115F, 116Y, 118I, 151M, 181C/I, 184V/I, 188C/L/H, 190S/A, 210W, 215F/Y, and 219Q/E. We con-sidered the following compounds: ZDV, zalcitabine, didanosine, d4T, 3TC, abacavir, tenofovir, nevirapine, delavirdin, EFV, SQV, IDV, ritonavir boosting dose, NFV, amprenavir, lopinavir, and atazanavir. The settings used for the SVM are shown in table A1.
Table A1. Support vector machine settings.
Analysis, setting Kernal C
Stability analysis
All Linear 0.1 1
Regimen-specific models
Regimen specific Linear 0.1 C optimizing AUC in 5-fold CV
All Linear 0.1 4 (optimized AUC in
10-fold CV) NOTE. C, cost factor; CV, cross-validation; AUC, area under the re-ceiver operating characteristic curve.
References
1. Beerenwinkel N, Daumer M, Oette M, et al. Geno2pheno: estimating phenotypic drug resistance from HIV-1 genotypes. Nucleic Acids Res
2003; 31:3850 –5.
2. Vermeiren H, Van Craenenbroeck E, Alen P, Bacheler L, Picchio G, Lecocq P. Prediction of HIV-1 drug susceptibility phenotype from the viral genotype using linear regression modeling. J Virol Methods
2007; 145:47–55.
3. Vercauteren J, Vandamme AM. Algorithms for the interpretation of HIV-1 genotypic drug resistance information. Antiviral Res 2006; 71: 335– 42.
4. Larder B, Wang D, Revell A, et al. The development of artificial neural networks to predict virological response to combination HIV therapy. Antivir Ther 2007; 12:15–24.
5. Altmann A, Beerenwinkel N, Sing T, et al. Improved prediction of re-sponse to antiretroviral combination therapy using the genetic barrier to drug resistance. Antivir Ther 2007; 12:169 –78.
6. Beerenwinkel N, Daumer M, Sing T, et al. Estimating HIV evolution-ary pathways and the genetic barrier to drug resistance. J Infect Dis
2005; 191:1953– 60.
7. Aharoni E, Altmann A, Borgulya G, et al. Integration of viral genomics with clinical data to predict response to anti-HIV treatment. In: IST-Africa conference proceedings. Dublin: IIMC International Informa-tion Management Corp., 2007.
8. Rhee SY, Gonzales MJ, Kantor R, Betts BJ, Ravela J, Shafer RW. Human immunodeficiency virus reverse transcriptase and protease sequence database. Nucleic Acids Res 2003; 31:298 –303.
9. Roomp K, Beerenwinkel N, Sing T, et al. Arevir: a secure platform for designing personalized antiretroviral therapies against HIV. Data inte-gration in the life sciences. Vol 4075. Berlin/Heidelberg: Springer, 2006: 185–94.
10. De Luca A, Di Giambenedetto S, Romano L, et al. Frequency and treatment-related predictors of thymidine-analogue mutation patterns in HIV-1 isolates after unsuccessful antiretroviral therapy. J Infect Dis
2006; 193:1219 –22.
11. Meynard JL, Vray M, Morand-Joubert L, et al. Phenotypic or genotypic resistance testing for choosing antiretroviral therapy after treatment fail-ure: a randomized trial. AIDS 2002; 16:727–36.
12. Van Laethem K, De Luca A, Antinori A, Cingolani A, Perna CF, Van-damme AM. A genotypic drug resistance interpretation algorithm that significantly predicts therapy response in HIV-1-infected patients. An-tivir Ther 2002; 7:123–9.
13. De Luca A, Cingolani A, Di Giambenedetto S, et al. Variable prediction of antiretroviral treatment outcome by different systems for interpreting genotypic human immunodeficiency virus type 1 drug resistance. J In-fect Dis 2003; 187:1934 – 43.
14. Johnson VA, Brun-Vezinet F, Clotet B, et al. Update of the drug resis-tance mutations in HIV-1: 2005. Top HIV Med 2005; 13:51–7. 15. Landwehr N, Hall M, Frank E. Logistic model trees. Mach Learning
2005; 59:161–205.
16. Brun-Vezinet F, Costagliola D, Khaled MA, et al. Clinically validated genotype analysis: guiding principles and statistical concerns. Antivir Ther 2004; 9:465–78.
17. Fawcett T. An introduction to ROC analysis. Pattern Recogn Lett
2005; 27:861–74.
18. Sing T, Sander O, Beerenwinkel N, Lengauer T. ROCR: visualizing clas-sifier performance in R. Bioinformatics 2005; 21:3940 –1.
19. Chang CC, Lin CJ. LIBSVM: a library for support vector machines, 2001. Available at: http://www.csie.ntu.edu.tw/⬃cjlin/libsvm/.
20. Maggiolo F, Airoldi M, Callegaro A, et al. Prediction of virologic out-come of salvage antiretroviral treatment by different systems for inter-preting genotypic HIV drug resistance. J Int Assoc Physicians AIDS Care (Chic Ill) 2007; 6:87–93.
21. Cozzi-Lepri A, Phillips AN, Ruiz L, et al. Evolution of drug resistance in HIV-infected patients remaining on a virologically failing combination antiretroviral therapy regimen. AIDS 2007; 21:721–32.
22. Altmann A, Sing T, Vermeiren H, et al. Inferring virological response from genotype: with or without predicted phenotypes? Antivir Ther
2007; 12:S169.
23. Bickel S, Bogojeska J, Lengauer T, Scheffer T. Multi-task learning for HIV Therapy screening. In: Proceedings of the 25th International Con-ference on Machine Learning. New York: ACM, 2008:56 – 63.