and formal features of cartoons*
ANDREA C. SAMSON and OSWALD HUBER
Abstract
The present study investigates gender di¤erences in the use of formal features of cartoons, like the amount of text, the number of panels, or the applica-tion of color. For the analysis, 300 cartoons (150 each by female and male cartoonists) were selected randomly from the works of 1519 cartoonists. Twenty-one formal features were analyzed. On average, female cartoonists use more text, include text more frequently, and also draw more panels. These di¤erences were expected, because Di¤erential Psychology has shown for a long time in a variety of cultures that, on average, women tend to perform better in tasks testing verbal intelligence whereas men per-form significantly better in tasks that require spatial intelligence. We also found a di¤erence in the type of joke: Women more frequently draw toons with incongruity-resolution humor, whereas men prefer to draw car-toons with nonsense humor. The results are discussed in relation to gender di¤erences in humor processing and gender di¤erences in general.
Keywords: Cartoon; humor; gender; formal features.
1. Introduction
Before the introduction of our main hypotheses, it is necessary to define cartoons and di¤erentiate them from comics. Cartoons are drawings in which an action, situation, or person is caricatured or sym-bolized, often in a satirical manner (Gerberg 1989). While comics are normally not restricted to a limited number of panels, a cartoon is a joke told in a picture (drawing, painting, etc.) comprising one or only
Humor 20–1 (2007), 1–25 0933–1719/07/0020–0001 DOI 10.1515/HUMOR.2007.001 6Walter de Gruyter
a few panels (Nilsen and Nilsen 2000). The style of cartoon is mostly characterized by simple lines, exaggerated features, as well as sketch-like and simplified figures. Comics are more orientated towards stories, their artwork is detailed, anatomically correct, and the drawing often closely resembles reality.
In the present study we focus exclusively on cartoons. Here, one can distinguish between the content of the joke and its formal pictorial repre-sentation. There are substantial di¤erences between the formal styles of cartoonists, as shown in a comparison of works by Van Amerongen, Tomascho¤, Serre or Glashan, for example. Books and courses teaching the art of drawing cartoons usually pay special attention to formal fea-tures of the picture and their e¤ect on the viewer, for example, Gerberg (1989), Keener (1992), Maddocks (1982), and Whitaker (1994). As such statements are not based on systematic research, they have to be consid-ered as subjective theories of the artists.
In this study, we focus on formal style and investigate whether cartoons drawn by female and by male cartoonists di¤er in their formal features. Although cartoons are often used in research on humor or, for example, on stereotypes, empirical studies on formal features of cartoons are quite rare (Huber and Leder 1997). Ring (1975) showed that the position of a speech balloon influences the recall of arguments. Arguments in balloons on the right or left top were recalled more easily than those positioned be-low the center. Jones et al. (1979) tested the proportional e¤ect of the pic-ture component and the text component of cartoons on humor ratings. They found that the humor of the cartoon picture was positively related to the humor rating of the entire cartoon, particularly in the case of highly humorous cartoons. McKay and McKay (1982) compared non-captioned cartoons to captioned cartoons and to the independent ratings of the picture and captions of the captioned cartoons. Captioned cartoons were rated significantly funnier than the independent ratings of pictures or captions. They found a di¤erence in funniness between strictly picto-rial, non-captioned cartoons and non-captioned cartoons with text in the picture. The first were rated funnier. Karabas (1990) analyzed the e¤ect of hair as one formal element in Turkish cartoons with respect to viewers’ attitude toward the persons and situations in the cartoons. Herzog and Larwin (1988) studied humor appreciation for captioned cartoons as a function of cartoon category and eight predictor vari-ables: complexity, di‰culty, fit (how well the caption fits the drawing), depth between the surface meaning and the deeper meaning of the
cartoon, visual humor, artwork, vulgarity, and originality. Cartoons judged to have the most originality and the best fit were appreciated most. Huber and Leder (1997) varied the number of panels as one aspect of a cartoon’s complexity. Contrary to their expectations, the less com-pact version was evaluated as funnier than the comcom-pact one. This result seems to be due to the fact that less compact cartoons are easier to under-stand. Woschek (1991) compared cartoons without facial expression to redrawn cartoons with facial expression (and vice versa) and demon-strated that cartoons with emotional facial expression are rated less funny than cartoons without.
For an investigation of gender di¤erences of cartoonists, one is con-fronted with a striking asymmetry: There are many more male cartoonists than female ones. Stoutsenberger (1994) reports a fraction of only about two or three percent of female members of the National Cartoonists Society in the United States. According to him, this quota has remained stable since the forties and fifties. Statistics on non-organized cartoon-ists and the situation in other countries are not available. One can only speculate on the reasons for the asymmetry. We expect e¤ects of socialization and culture play an important role, but do not exclude explanations based on neurological or evolutionary findings on gender di¤erences.
Empirical results concerning gender di¤erences are available mainly for the area of humor reception (e.g., Lampert and Ervin-Tripp 1998; Ruch and Hehl 1998). Research on humor production is quite scarce. An example for the latter type of study is Brodinsky and Rubien (1976). They found that men produce funnier captions for sexual or aggressive car-toons, whereas there was no gender di¤erence for neutral cartoons.
We are not aware of any empirical studies focusing on gender di¤er-ences in formal features of humor production, especially of cartoons. Therefore, our hypotheses cannot be founded on available empirical re-sults or existing theories. Furthermore, we do not know of any cultural or societal norms or even recommendations concerning formal features of cartoons (such as the number of panels a cartoon should have, or the amount of text) that are di¤erent for female and male cartoonists. For that reason, in this first study we concentrate on results from Di¤erential Psychology.
For a long time Di¤erential Psychology has shown that in a variety of cultures, on the average, women perform better in tasks testing verbal intelligence, although in recent research the di¤erences are often found
to be weak. Men, on the other hand, perform much better in tasks that require spatial intelligence. An overview of the relevant results can be found, for example, in Kimura (2000), Burnett et al. (1979), and Silver-man and Phillips (1998).
Based on these results, we expect female and male cartoonists to di¤er mainly in their use of language elements. In cartoons by female cartoon-ists, verbal elements should play a more prominent role than in those by male cartoonists. They should include text more often, and texts in cap-tions or speech balloons should have a higher number of words. We as-sume that the use of language elements in cartoons in general is influ-enced by a variety of factors, such as culture, cartoon tradition, and sociological factors. However, we do not know of factors that should op-erate di¤erently on female and male cartoonists. We will come back to this issue in the discussion section.
Furthermore, we expect that cartoons by female cartoonists have more panels based on the assumption that women have a more elaborate narra-tive style in telling jokes. This expectation is independent from the hy-pothesis about language elements because it is possible for a cartoon to consist of several panels but lack text.
With respect to other formal features that concern aspects of the draw-ing as well as formal characteristics of the joke (e.g., the distinction be-tween Incongruity-resolution and nonsense jokes, see Method section, sub-section Analysis of formal features of cartoons) we don’t expect to find any gender di¤erences.
2. Method
In order to test our hypotheses and to investigate possible gender di¤er-ences in other formal features as well, we first created a list of cartoonists. In a first phase, we randomly selected a sample of 80 cartoons. With the help of these cartoons, the formal features for the comparison of fe-male and fe-male cartoonists were defined and a coding system developed. We also used this first analysis as an initial basis for the formulation of our hypotheses.
In the second phase, we selected 150 cartoonists and their cartoons for the main analysis and coded them according to our coding system. The results are reported in the results section. Of course, the cartoons used in the first phase were not included in the second phase.
2.1. Selection of cartoonists and cartoons
We made use of a variety of sources in order to find as many cartoonists as possible, especially to include the relatively few female cartoonists: magazines, omnibus volumes of cartoons, specialist journals on cartoons, cartoon books, books on cartooning, listings of cartoon publishers, per-sonal contacts, and databases on the Internet.
In total, our list comprised 1519 cartoonists from 61 countries, with 9.01% of them female. This percentage is remarkably higher than that given by Stoutsenberger (1994), and is at least an indicator that our e¤ort to find as many female cartoonists as possible was successful. Our list also contains cartoonists who are not members of cartoonists societies, as well as cartoonists from countries other than the United States. We have also included amateur cartoonists.
From this list we eliminated cartoonists who did not fulfill at least one of the following criteria (criteria for cartoons in the first phase are given in parentheses): (i) The cartoonist has been published in the last 10 (30) years, and (ii) there were at least two (one) cartoons available for analy-sis. These criteria reduced our initial list to 767 (662) cartoonists from 52 (49) countries, of which 14.73% (9.5%) are female. In the first phase we used weaker criteria because we concentrated only on formulating and defining formal features and not on confirming hypotheses. It should also be mentioned here that at the time when we selected cartoons for the ini-tial test our list comprised only 1282 cartoonists, which accounts for the smaller figures as compared to the reduced list for the main analysis.
From this reduced list, we randomly selected 75 male and 75 female cartoonists for the main analysis. We selected — also randomly — two cartoons from each of these cartoonists. In some rare instances there were only two cartoons available, therefore no selection was possible. Thus, for the main analysis, we used 300 cartoons, 150 by female and 150 by male cartoonists.
2.2. Analysis of formal features of cartoons
For the selection of the formal features to be analyzed, we used sources such as books on cartooning and the analysis of the cartoons in the first phase. From the initial list of features, we eliminated features that (i) could not be rated unambiguously (e.g., exaggerated gesture), (ii) didn’t
show su‰cient variance (e.g., nonverbal dialogue), and (iii) features that correlated highly with other selected features and were therefore redun-dant (e.g., the features complexity and details).
The following features were included in the analysis. It should be noted that for some of the features we only made a dichotomous yes-no distinc-tion (e.g., emodistinc-tional expression), although a more refined scale could be applied in principle. However, we wanted to restrict our analysis to dis-tinctions that could be coded reliably.
1. Number of panels: A cartoon consists of at least one panel, but may also be composed of several. We counted the number of panels.
2. Text: A cartoon was classified as containing text if it included text in any form: speech balloon, caption, or text within the picture. Otherwise it was coded as not containing any text. The signature of the cartoonist was not classified as text.
3. Number of words: The words in the text were counted.
4. Caption: A cartoon was classified as having a caption or not. A cap-tion may be a verbal utterance of (at least) one of the characters1in the
cartoon, but may also be an explanatory text, a comment, etc.
5. Speech balloon: A cartoon was classified as having a speech balloon or not. A speech balloon may contain a verbal utterance or a thought of (at least) one of the characters in the cartoon.
6. Text in the picture: A cartoon was classified as having a text within the picture or not. We distinguished three types of text: speech/thinking text, referential text as well as the combination of both. An example of a referential text within the picture is a sign with the words ‘‘Drug Store.’’
It should be noted that a cartoon may contain all three elements: a cap-tion (4), a speech balloon (5) and a text in the picture (6). Examples can be found, for example, in the cartoons of Gary Larson.
7. Number of characters: The characters in the cartoon were counted. 8. Number of speaking characters: The speaking characters in the car-toon were counted.
9. Identifiability of the speaking character: This category is relevant only for those cartoons in which at least one speaking character is por-trayed. A cartoon was classified as clearly identifiable, if the speaking character can be identified easily, for example, if the mouth of the speak-ing character is drawn as open and that of the listenspeak-ing character is drawn as closed. Otherwise it was classified as not clearly identifiable.
10. Emotional expression: A cartoon was classified as depicting an exaggerated emotional expression (e.g., fear, happiness, anger), if
at least one of the characters was depicted with an exaggerated facial expression.
11. Details: On a five-point scale we distinguished between cartoons with very little detail (1) and those with rich detail (5).
12. Distortion: On a five-point scale we distinguished between an un-distorted or only mildly un-distorted cartoon (depicting the pictorial ele-ments as a whole) (1), and those with a very distorted representation (5).
13. Partial distortion (‘‘Tendenzselektion;’’ cf. Woschek 1991): On a five-point scale we classified cartoons that don’t contain any distorted elements (1) and cartoons that display a very distorted representation of specific elements (e.g., the face, the body) (5). A distorted representation of elements is characteristic for cartoons.
14. Instrument: We distinguished between the use of any kind of pen (including a pencil), a brush, a mixed technique and/or computer-based work.
15. Color: We distinguished cartoons in black and white from cartoons in color.
16. Brightness: On a five-point scale we distinguished a very bright car-toon (1) from one that is very dark (5).
17. Style: On a five-point scale we distinguished between a cartoon drawn in a precise/functional manner (1) and those drawn in a playful/ imprecise manner (5).
18. Lines: On a five-point scale we distinguished a cartoon with few lines or strokes (1) to those with many (5).
19. Background: We distinguished cartoons with a background from those without. A drawing that is printed on an area of homogenous color was classified as not having a background.
20. Position of the punch line: We distinguished punch lines according to their position in the picture — whether they were on the right, left or middle. If the punch line could not be located in a specific spot, this was coded as well.
21. Incongruity-resolution and nonsense humor: Ruch and Hehl (1998) di¤erentiate the content of a cartoon from its structural properties. We added those two of their three factors that have consistently appeared in several studies to our list: Incongruity-resolution humor, nonsense hu-mor, and sexual humor. Incongruity-resolution humor is characterized by punch lines through which the surprising incongruity can be largely resolved. In the case of nonsense humor the punch line may provide no resolution at all, it may provide a partial resolution, or create new
absurdities or incongruities (McGhee et al. 1990). We did not include the third factor (sexual humor) because our cartoon corpus contained only few jokes with sexual content. Furthermore, sex cartoons can be classified as incongruity-resolution or nonsense humor as the sexual content factor is orthogonal to the other structural factors.
3. Results
3.1. Intercoder reliability
In order to test the reliability of our coding procedure, a random sample of 60 cartoons was taken from the 300 cartoons analyzed and coded by two coders. Intercoder reliability of nominal-scaled items was com-puted using Cohen’s Kappa; for interval-scaled items we used Spearman’s rho. Interrater reliability was satisfactorily high: emotional expression (Kappa¼ :77), details (rho ¼ :89), degree of distortion (rho ¼ :74), bright-ness (rho¼ :82), style (rho ¼ :84), lines (rho ¼ :90), partial distortion (rho¼ :77), and incongruity-resolution/nonsense humor (Kappa ¼ :81). Note that we computed intercoder reliability only for those features where there was a leeway in coding. Therefore, for example, number of panels or number of words were not included. Consequently, the obtained values for intercoder reliability concern only the critical variables. Had all variables been taken into account, the mean intercoder reliability values would be much higher.
In the coding process, the first coder evaluated the cartoons knowing the gender of the cartoonists, but the second did not know whether the cartoons were drawn by men or women. Because the intercoder reliability is su‰ciently high, a biasing e¤ect of knowledge on coding can be excluded.
3.2. Statistical tests
The following statistical tests were used for the comparison of female and male cartoonists. For features measured on an interval-scale, an analysis of variance (ANOVA) was employed. For nominal-scaled variables a w2
test or Fisher’s exact probability test was computed. In Tables 1 and 2, the statistical test values and the significance levels for all the investigated features are summarized. Table 3 presents single comparisons of nominal
scaled variables with more than two levels. Bonferroni corrections were computed if several variables concern one and the same hypothesis. These corrections are included in the Tables.
3.3. Analysis of the features
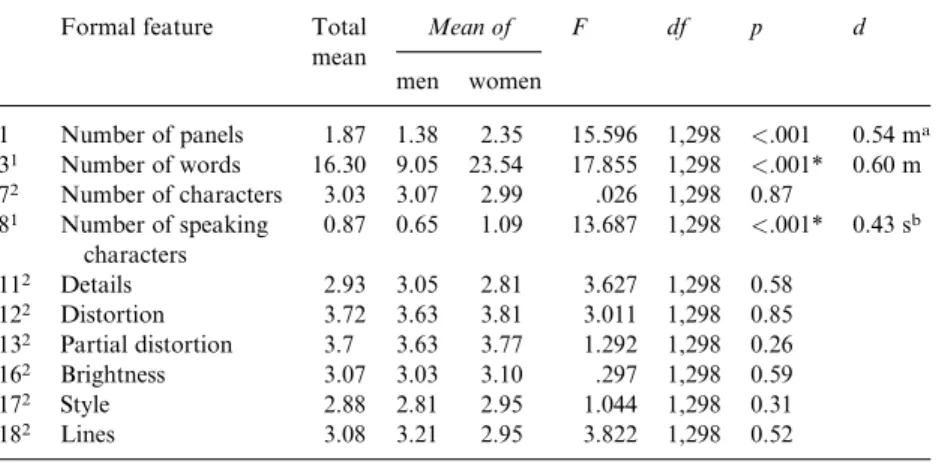
As shown in Tables 1 and 2, female cartoonists draw significantly more cartoons with text and use more words in their cartoons. In both cases, the e¤ect is of medium size. These results confirm our first hypothesis. There isn’t any di¤erence between female and male cartoonists in the use of a caption and in the use of text within the picture, but single compar-isons showed that women include text for speech or thinking text more frequently in their cartoons. There aren’t any gender di¤erences in the category for referential text and in the category that combines text for speech or thinking texts and referential text. However, female cartoonists draw a speech balloon more often than their male colleagues.
Female and male cartoonists also show a di¤erence in the number of panels they use. Female cartoonists, on average, draw more panels than
Table 1. Comparison of the means of interval-scaled features as a function of gender
Formal feature Total Mean of F df p d mean men women 1 Number of panels 1.87 1.38 2.35 15.596 1,298 <.001 0.54 ma 31 Number of words 16.30 9.05 23.54 17.855 1,298 <.001* 0.60 m 72 Number of characters 3.03 3.07 2.99 .026 1,298 0.87 81 Number of speaking characters 0.87 0.65 1.09 13.687 1,298 <.001* 0.43 sb 112 Details 2.93 3.05 2.81 3.627 1,298 0.58 122 Distortion 3.72 3.63 3.81 3.011 1,298 0.85 132 Partial distortion 3.7 3.63 3.77 1.292 1,298 0.26 162 Brightness 3.07 3.03 3.10 .297 1,298 0.59 172 Style 2.88 2.81 2.95 1.044 1,298 0.31 182 Lines 3.08 3.21 2.95 3.822 1,298 0.52 Key:
am . . . medium e¤ect size bs . . . small e¤ect size
*¼ p < :01 when Bonferroni corrected
1Bonferroni corrections for features that concern the language hypothesis. The a-level was
divided by six.
2Bonferroni corrections for the residual features (third hypothesis). The a-level was divided
the male ones (Table 1). We furthermore wanted to know whether female cartoonists more frequently draw two or more panels instead of only one. For this examination, we dichotomized the number of panels into two categories: cartoons with a single panel and cartoons with two or more panels. As Feature 1* in Table 2 demonstrates, male cartoonists draw one-panel cartoons more frequently than female cartoonists.
Even though the number of the depicted characters does not di¤er be-tween genders, female cartoonists include more speaking individuals in their cartoons. In the cartoons with speaking characters (N¼ 181), there is no gender e¤ect concerning the identifiability of speaking characters.
There is a tendency by female cartoonists to draw characters with an exaggerated emotional expression more often than the males. After Bonferroni correction, there is no significant di¤erence lower than a¼ :05, but there is a small e¤ect size (w ¼ :17). The same is true for the variables for background and color: male cartoonists more often include
Table 2. Comparison of the percentages of nominal-scaled features as a function of gender (only variables with two steps)
Formal feature N Total Percentages of w2(1) p w
mean
men women
1* One vs. two or more panels 300 21.3 11.3 31.3 17.88 <.001 0.24 sb 21 Text 300 77.3 64.7 90 27.46 <.001** 0.30 ma 4 Caption 300 23.0 22.7 23.3 0.02 0.89 51 Speech balloon 300 48.7 36.7 60.7 17.29 <.001** 0.24 s 9 Identifiability of speaking character (if speaking characters) 181 94.5 94.5 94.4 0.000 0.98 102 Emotional expression 300 53.7 45.3 62.0 8.38 <.01*** 0.17 s 152 Color 300 57.0 64.7 49.3 7.19 <.01*** 0.15 s 192 Background 300 62.3 70 54.7 7.51 <.01*** 0.16 s 212 Incongruity-resolution/ nonsense humor 300 50.0 38.0 62.0 17.28 <.001** 0.24 s Key:
am . . . medium e¤ect size bs . . . small e¤ect size
** p < :01 when Bonferroni corrected *** p < :10 when Bonferroni corrected
1Bonferroni corrections for features that concern the language hypothesis. The a-level was
divided by six.
2Bonferroni corrections for the residual features (third hypothesis). The a-level was divided
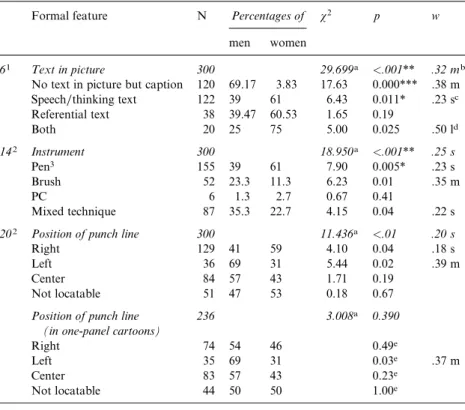
Table 3. Comparison of the percentages of nominal-scaled features as a function of gen-der — here only the variables with more than two steps
Formal feature N Percentages of w2 p w
men women
61 Text in picture 300 29.699a <.001** .32 mb
No text in picture but caption 120 69.17 3.83 17.63 0.000*** .38 m Speech/thinking text 122 39 61 6.43 0.011* .23 sc Referential text 38 39.47 60.53 1.65 0.19 Both 20 25 75 5.00 0.025 .50 ld 142 Instrument 300 18.950a <.001** .25 s Pen3 155 39 61 7.90 0.005* .23 s Brush 52 23.3 11.3 6.23 0.01 .35 m PC 6 1.3 2.7 0.67 0.41 Mixed technique 87 35.3 22.7 4.15 0.04 .22 s 202 Position of punch line 300 11.436a <.01 .20 s
Right 129 41 59 4.10 0.04 .18 s
Left 36 69 31 5.44 0.02 .39 m
Center 84 57 43 1.71 0.19
Not locatable 51 47 53 0.18 0.67 Position of punch line
(in one-panel cartoons)
236 3.008a 0.390 Right 74 54 46 0.49e Left 35 69 31 0.03e .37 m Center 83 57 43 0.23e Not locatable 44 50 50 1.00e Key: adf¼ 3
bm . . . medium e¤ect size cs . . . small e¤ect size dl . . . large e¤ect size
ebecause N¼ 236, binomial tests were computed against their expected distributions (men
and women are not equally distributed) * p < :05 when Bonferroni corrected ** p < :01 when Bonferroni corrected *** p < :001 when Bonferroni corrected
1Bonferroni corrections for features that concern the language hypothesis. The a-level was
divided by six.
2Bonferroni corrections for the residual features (third hypothesis). The a-level was divided
by 14.
3By single comparisons in nominal scaled variables with more then two steps Bonferroni
a background (w¼ :16) and women’s cartoons are mostly in black and white, whereas men’s are mostly in color (w¼ :15).
Men and women di¤er in the instruments they use for drawing car-toons. Single comparisons showed that women more often use a type of pen (Table 3).
There is a higher tendency for men to place the punch line in the left half of the cartoon. Even when there is no generally significant di¤erence considering only one-panel cartoons (N¼ 236), the tendency from men to place the punch line in the left half of the cartoon persisted (binomial test, p < :05). This e¤ect didn’t remain after Bonferroni correction, but there is a medium e¤ect size (w¼ :37).
There is a di¤erence in the structural type of joke. Female cartoonists mostly draw incongruity-resolution cartoons, whereas male cartoonists prefer nonsense cartoons (Table 2).
No significant gender di¤erences were found for the remaining formal features (details, distortion, partial distortion, brightness, style and lines).
3.4. Further analyses
Several additional variables, such as the age of cartoons, country and lan-guage of cartoonists, and source of cartoons, were analyzed. This was done in order to separate the e¤ect of gender from the influence of these factors.
Age of Cartoons: 6% of the 300 cartoons were older than 5 years, none was older than ten years. There was no gender di¤erence.
Country: The 150 selected cartoonists were from 22 di¤erent countries. Cartoonists were divided into three language areas:236% of the
cartoon-ists are from English-speaking countries, 46% from German-speaking countries, and 27% are from areas where other languages are spoken. Fe-male and Fe-male cartoonists were distributed di¤erently (w2ð2Þ ¼ 27:11,
p < :001). In the English-speaking group, 80% of the cartoonists were women, but only 26% of the cartoonists in the other-languages group. In the German-speaking group, men and women were distributed evenly.
There was also an unequal distribution in the groups of countries the cartoonists belong to (w2ð2Þ ¼ 78:03, p < :001). Americans and
Cana-dians represent 33.3% of the cartoonists, Europeans 63.3% and 3.3% came from other countries.3 There were more women (86%) than men
European group. In the group from other countries there was an equal distribution.
Source: We categorized five groups of sources from which we took the cartoons: (i) Internet (private homepages by cartoonists or cartoon data-bases) (72.3%), (ii) books about/by one cartoonist (4.7%), (iii) antholo-gies with contributions of several cartoonists (18.0%), (iv) newspapers (0.3%) and (v) satirical magazines (4.7%). To analyze the even distribu-tion of men and women we computed a w2 test. This test requires at least
five instances in each cell. Therefore we had to condense the fourth and fifth groups into one. There was no gender e¤ect (w2ð3Þ ¼ 3:44, p > :05).
4. Discussion
The main results of our study can be summarized as follows: Verbal ele-ments play a greater role in the cartoons of female cartoonists than in those of male ones. This result is confirmed by the more frequent occur-rence of textual elements and by the larger number of words in the car-toons by female cartoonists. Furthermore, carcar-toons by female cartoonists have more panels and include a larger number of speaking characters.
There is a di¤erence also in the formal structure of the jokes: Female cartoonists more frequently draw incongruity-resolution jokes, whereas male cartoonists prefer nonsense jokes.
How can this clear gender di¤erence be explained? Gender is a complex concept that involves genetic and other biological di¤erences as well as cultural and social factors and the interactions between these factors.4
There are di¤erent social and cultural norms for men and women with re-spect to the content of a joke (e.g., sex jokes), for an overview see, for ex-ample, Lampert and Ervin-Tripp (1998). In our study, on the other hand, we focus on some formal features of cartoons that are independent from the content of a joke. We do not know of any norm or rule di¤erently prescribing the use of formal features in their work for female and male cartoonists. Thus, we favor the diversities in cognitive abilities of men and women that have been highlighted by Di¤erential Psychology as a possible explanation for the observed di¤erences (cf., e.g., Kimura 2000; Burnett et al. 1979; Silverman and Phillips 1998). It should be noted that this explanation presupposes the distribution of cognitive gender di¤er-ences to be the same in the subset of cartoonists as in the general popula-tion. There is, however, no reason to assume a di¤erent distribupopula-tion.
The di¤erence in verbal abilities is often linked to hemispheric in-formation processing and to a more developed interconnection of the hemispheres in the brains of women (Johnson 1990; Kimura 2000). An EEG-study on humor processing revealed that the activation patterns de-pend on hemispheric asymmetries (Coulson and Lovett 2004) that vary according to gender (Kimura 2000). The counterpart to the higher verbal abilities of women is men’s well-established strength in visual-spatial tasks. Here, the gender di¤erences are more distinct and more stable than those in verbal abilities (Kimura 2000).
The predictions based on the di¤erences in visual-spatial abilities work into the same direction as the predictions based on verbal abilities. The average male cartoonist should concentrate on visual-spatial aspects of his cartoons to a greater extent than the average female one, and conse-quently to a lesser extent on verbal aspects.
The gender di¤erences in the preference for verbal aspects may also lead to a preference for di¤erent types of cartoons. We tested this assump-tion by distinguishing three groups of cartoons, according to the impor-tance of the picture for the joke: (i) The picture is an illustration of the verbal joke, no further information is provided by the picture that could not be described verbally, for example ‘‘. . . person A says . . . then person B says . . .’’, or the picture is just superfluous to get the joke. (ii) There is supporting information in the picture that is not contained in the text. The function of the picture is used to emphasize or, for example, to describe a special situation, but the punch line of the joke is still in the text. (iii) The picture is essential: the punch line is in the picture itself, not in the text.
For this analysis, we considered only verbal cartoons (N¼ 232); non-verbal cartoons were not included because here the punch line is obvi-ously always in the picture. In 21.6% of the cartoons the picture has a purely illustrating function, in 17.7% of the cases, the picture has a sup-porting function, and in 60.8% of the cartoons the picture is essential for the joke. A w2test revealed a significant gender e¤ect to this three groups
(w2ð2Þ ¼ 19:242, p < :001). Women significantly more frequently draw
cartoons in which the picture has a pure illustrating function (binomial test p < :001). They also significantly more often draw cartoons, in which the picture has a supporting function (binomial test, p < :01). However, there was no gender e¤ect for cartoons where the picture is essential. For future research, it is conceivable to investigate the function of text and picture components in more detail. Jones et al. (1979) demonstrated that humor ratings of cartoon pictures were positively related to humor
ratings of the entire cartoon. It would be interesting to analyze if there is the same e¤ect for all three groups that are described above. It would also be interesting to investigate the e¤ect of position of the incongruity or punch line (i.e., in the text, in the text versus the picture, in the picture) on funniness and understandability ratings or other variables.
However, we want to discuss seven alternative explanations for our findings that could be confounded with the cognitive gender di¤erences.
1. Di¤erent themes of jokes may suggest di¤erent amounts of dialogue in a cartoon. For example, interpersonal issues and issues of relationship may be better depicted in form of a dialogue or an extract of a dialogue. If female and male cartoonists draw such themes with di¤erent frequency, this fact could explain the di¤erences in the use of verbal aspects. In order to test this alternative explanation, we distinguished three types of themes: (i) cartoons that focus on interpersonal/relationship issues directly, (ii) cartoons with an interaction between people without treating interper-sonal/relationship issues, and (iii) cartoons with no interaction and no fo-cus on interpersonal/relationship issues. Although women fofo-cus more on interpersonal relationship issues (32%) than men (23.3%), the di¤erences turned out to be not significant when analyzed with a w2test. It was strik-ing that not all cartoons that focus on interpersonal/relationship issues included text, 23.4% of these cartoons were nonverbal. This means that even relationship problems can be represented in nonverbal cartoons. In-terestingly, most of them (88.9%, 16 cartoons out of 18) were drawn by male cartoonists. It seems that male cartoonists do not generally focus on di¤erent themes or topics, but tend to express themselves without text more often. This is in accordance with our main hypothesis.
2. We addressed the possible influence of generational di¤erences. However, an e¤ect of the age of cartoons is highly implausible because 94% of our analyzed cartoons were younger than five years. An e¤ect of the age of the cartoonist could not be investigated because birth dates were not available for the great majority of cartoonists.
3. We considered a possible e¤ect of language area or country on the for-mal features. As mentioned in the results section, the fefor-male sample con-tains more women from English-speaking countries and from the United States and Canada, whereas there are more men from Europe and from other language speaking areas. It could be interesting to investigate in a further study cultural or linguistic aspects in cartoons more systematically. Because we sampled only 22 countries, mainly cartoonists from United States, Canada, and Europe, our results may only be representative for
these cultural areas. In further studies it would be advisable to include more cartoonists from African, Arabic, Asian countries, etc.
Although we expect that there is no cross-cultural di¤erence in ing style between female cartoonists from United States and male cartoon-ists from Germany, this possibility cannot be excluded with certainty.
For further research it could be interesting to investigate systematically, in a study designed to equally balance several language areas, the e¤ect of language on conventional cartooning aspects, e.g., the use of text or as-pects of drawing style.
We analyzed the e¤ect of language or nationality on those variables that showed a gender e¤ect (number of panels, number of words, text, speech balloon, type of joke, text in picture, instrument). The statistical methods and descriptions are given in the appendix. In this section, we just want to summarize the results. The analyses show that gender has an influence on all dependent variables analyzed (except instrument, for which the results are inconsistent; see below). Thus, we can exclude that the e¤ects found in our study can be explained by language or country, even if some variables are additionally influenced by them.
4. We are interested if there is a possible e¤ect of the source of car-toons. The source in which the cartoon was published might influence the selection of cartoons, for example, certain features that are to be expected from certain newspapers or magazines, such as if they publish almost exclusively black and white cartoons (e.g., The New Yorker) or mainly color cartoons (e.g., Playboy). To exclude this possibility we formed several groups of the source or medium: Internet (private home-pages of cartoonists or databases), books about/by one cartoonist, anthologies of several cartoonists, newspapers, and satirical magazines. There was no gender e¤ect. Most of the cartoons were from the Internet, so possible restrictions imposed by newspapers or magazines can be ex-cluded. Because cartoons can be published without formal restrictions on the Internet, an e¤ect of source can be excluded.
Two further explanations can unite the gender di¤erences observed for several features. These explanations are not mutually exclusive and, with the help of di¤erent cognitive abilities, do not contradict the explanation: 5. Unlike male cartoonists, females might put more e¤ort into making their cartoons more understandable. This assumption could explain the use of more panels, more text (more text in general, more words and more speech balloons) and more speaking characters as well. Huber and Leder (1997) found that cartoons with more panels are easier to understand
than those with few or even just a single panel. It is possible that the sig-nificance of verbal elements in the female cartoonists’ work is caused by their attempt to communicate more e¤ectively. However, analyses on the content of the texts are necessary in order to test this possibility.
There are (at least) two reasons why female cartoonists might put a bigger e¤ort into making their cartoons more understandable: a) It may be more important to them to be understood in communication, or b) they may possibly make a lower assessment of the cartoon consumer’s capabilities than their male colleagues. Female cartoonist may also use more exaggerated emotional expressions to make their cartoons more understandable.
6. As mentioned above, men and women may have di¤erent narrative styles in telling jokes. Whereas a picture may be self-su‰cient for men, possibly allowing them to present a joke in a very compact form, women might try more often to tell a longer and more elaborate story, even when working with pictures. Jenkins (1996) also mentioned that there are for-mal di¤erences in the humor of men and women.
7. The di¤erent preferred styles in humor production also o¤er a poten-tial explanation why there are so relatively few female cartoonists. For most women, cartoons may simply not be the preferred means for personal expression within humor production. If this hypothesis is true, then in other (professional) areas of humor production, men and women should be distributed more evenly: in humorous literature, cabaret pro-ductions, comedy and stand-up comedy, among joke writers, etc.
An alternative explanation for the di¤erent distribution of female and male cartoonists could be that most cartoon editors are male and — unintentionally or intentionally — prefer the cartoons of male cartoonists. However, an analysis of cartoon editors doesn’t confirm this general ex-planation, at least not at the present time. We analyzed several 2003 is-sues of THE GAG RECAP, a journal for cartoonists. This publication provides a list of addresses of US journals with nation-wide distribution to which cartoonists can apply and send their work. This list comprised 59 journals, 37 of which supplied the name of the cartoon editor. In one case, we were not able to determine the gender of that particular editor. Of the 36 remaining cases (¼ 100%), 16 editors (44%) were female and 20 (56%) were male. Even for the four sex magazines included, two of the cartoon editors were female and two were male. This result speaks against the assumption that female cartoonists are discriminated against in the cartoon business, as Betty Swords (1992) asserts. On the other
hand, female editors, just like their male counterparts, might also show a preference for male cartoonists.
There is one variable influenced by gender that concerns drawing as-pects: the use of instruments. Whereas women tend to draw with a type of pen, men more often use a kind of brush. The more frequent use of a brush is probably connected to the fact that men have a (nonsignificantly) higher tendency to produce color cartoons. From these results, it cannot be concluded that there are real di¤erences in drawing style between men and women. Further research is necessary.
With respect to the types of joke, men draw more cartoons with non-sense humor, whereas women draw more incongruity-resolution cartoons. Ruch and Hehl (1998) could not find any gender di¤erences in the appre-ciation of incongruity-resolution and nonsense humor. According to their study, further personality traits correlate with the predilection for non-sense and other traits with a preference for incongruity-resolution humor. For example, the preference for nonsense humor correlates with openness to experiences as well as some other facets of openness (aesthetics, ideas and values). In contrast to this, people who prefer incongruity-resolution humor have high values in agreeableness, which correlates negatively with the variable values, which constitutes one facet of openness (NEO-PI; Costa and McCrae 1985). However, men normally do not di¤er from women in these personality characteristics, except that women tend to have higher values in openness. As Babad (1974) and Ko¨hler and Ruch (1996) point out, humor appreciation and production do not correlate, particularly in behavioral data. Therefore, it is possible that the results from Ruch and Hehl (1998) concern only humor reception and not humor production. To answer this question further research is necessary.
Our finding seems to agree with the results of Forabosco and Ruch (1994) who investigated humor appreciation and found that women prefer incongruity-resolution humor and men prefer nonsense humor. However the authors suppose that their finding could be the result of the confounding with the age of the subjects: Men were younger than women in their subject pool and the older people are, the more they prefer incongruity-resolution humor.
Another interesting point is that appreciation of incongruity-resolution humor correlated with a preference for simple and representational paint-ings as well as simple line drawpaint-ings, whereas appreciation of nonsense humor5correlated with a preference for complex and fantastical
1998). This may explain why men have a higher tendency to produce car-toons in color, whereas women prefer carcar-toons in black and white and those drawn with a pen (instead of a brush). However, the use of color may also be related to the demands of the specific journals, therefore its use is di‰cult to interpret.
In conclusion, we found clear di¤erences between certain formal fea-tures in the work of female and male cartoonists. Our results concern the production of cartoons. An interesting question for future empirical re-search is whether the same di¤erences can also be revealed among car-toon recipients. Do female carcar-toon recipients prefer carcar-toons with more text, more panels etc. in comparison to male recipients? When this ques-tion is addressed it is important to avoid confounding these preferences and the recipients’ preference for cartoons drawn by men or women. Car-toons can also be seen as a form of art. Because we have found gender di¤erences in the use of formal features in this specific art form, it would be interesting to investigate gender di¤erences in formal features also of other art forms.
In humor research, cartoons, in contrast to jokes, have received less attention, and there is, for example, no theory that explicitly addresses the perceptual and processing di¤erences between textual humor on the one hand and textual-pictorial and purely pictorial humor on the other. Such a study, which focuses in more detail on cognitive aspects of cartoon processing, as well as aesthetical aspects of cartoons, is in preparation (Samson and Hempelmann forthcoming).
University of Fribourg
Appendix
Some additional analyses were performed to analyze possible e¤ects of country and language of the cartoonists on formal features.
Because the distribution of the factor gender over the factors country and language is not balanced, the results of the w2analyses and ANOVAs have to be
confirmed by multifactorial analysis integrating the latter factors in the analysis. However, the factors country and language are highly correlated (Spearman’s rhoð150Þ ¼ :84, p < :01) and thus an integration of both factors in one model is problematic. Therefore we computed two models for each dependent variable. The first uses the factors gender and country, the second gender and language. The objective of this analysis is to test if the factor gender is still influential if ef-fects of the other factors are controlled. All dependent variables showing an e¤ect in the w2analyses and ANOVA were reanalyzed.
We first present the analysis for interval scaled dependent variables. We first computed MANOVAS to test if both dependent variables (number of panels and number of words) show an influence of the factors gender and language. Only the factor gender has a significant influence on the multivariate dependent variables (Fð2;295Þ ¼ 7:73, p < :01). Therefore separate analysis for both dependent vari-ables could be computed. Both confirmed the influence of the factor gender and the nonsignificance of the factor language (e¤ect of gender on number of panels Fð2;296Þ ¼ 13:49, p < :001; e¤ect of gender of number of words F ð2;296Þ ¼ 8:70,
p < :01).
When testing the influence of country and gender on these two variables, we found a significant gender e¤ect (Fð2;295Þ ¼ 7:19, p < :01). Therefore separate analyses for both dependent variables could be computed. Both confirmed the in-fluence of the factor gender and the nonsignificance of the factor language (e¤ect of gender on number of panels Fð2;296Þ ¼ 12:54, p < :001; e¤ect of gender of number of words Fð2;296Þ ¼ 8:07, p < :01).
The nominal scaled dependent variables were analyzed by means of logit anal-ysis. Logit analysis fits a hierarchy of logit models to the data (see, e.g., Agresti 1990; DeMaris 1992). It uses the measures of the likelihood ratio statistic G2and
DG2, which are approximately w2distributed.
One vs. two or more panels: The first variable investigated with logit analysis was the variable one vs. two or more panels. In the analysis with country and gender as independent variables, the model with condition gender only fitted best G2
(4)¼ 7.30; p > :05. The other models did not fit (null model G2 (5)¼ 25.75;
p < :05, model with condition language only G2(3)¼ 17.35; p < :05 and model
with condition gender and language G2(2)¼ 6.11; p < :05). This is according to
the previous w2analysis.
Although the model with the condition gender only is not significant at an a-level of .05 in the logit analysis with language and gender as independent vari-ables (G2 (4)¼ 10.98; p ¼ :027), it fits well on the .01 level and is significantly
better than the null model (DG2 (1)¼ 18.45; p < :001) (null model: G2 (5)¼
29.44; p < :01). The other two models were not better (model with condition lan-guage only G2(3)¼ 21.367; p < :01; model with condition gender and language
G2(2)¼ 9.102; p ¼ :011.)
Because the w2 analysis and the model with the factors country and gender
could show that gender has a significant influence on the variable one vs. two or more panels, and the current analysis showed also a big influence of the factor gender, the mere fact that the latter model reached significance only on a .01 level, cannot be interpreted as a falsifying influence of the factor.
Text: The model with condition gender and country fitted best G2 (2)¼ 5.65;
p > :05. The other models have to be rejected (null model G2 (5)¼ 49.217;
p < :05; model with condition country only G2(3)¼ 15.45; p < :05; model with
condition gender only G2(4)¼ 20.46; p < :05).
No model fitted if computing logit analysis with language and gender (null model G2 (5)¼ 57.23; p < :05; model with condition language only G2 (3)¼
18.35; p < :05; model with condition gender only G2(4)¼ 28.47; p < :05; model
with condition gender and language G2(2)¼ 8.509: p ¼ :014).
Because the w2analysis and the model with the factor country and gender could
show that gender has a significant influence on the variable text, and the current analysis showed also a big influence of the factor gender (DG2 (1)¼ 28.76,
p < :001), the mere fact that the latter model reached significance only on a .01 level, cannot be interpreted as a falsifying influence of the factor.
Speech balloon: We tested the variable speech balloon on language and gender: The model with condition gender and language fitted best G2(2)¼ 5.06; p > :05.
All other models have to be rejected (null model G2(5)¼ 38.76; p < :05, model
with condition language only G2(3)¼ 12.31; p < :05 and model with condition
gender only G2(4)¼ 21.29; p < :05).
There is an e¤ect of gender and language on the use of speech balloons. Women more often use speech balloons and cartoonists from German speaking areas have more speech balloons than cartoonist speaking English or other languages.
As country and gender seem to have an influence on the use of speech balloons, we again computed logit analysis. The model with condition gender only fitted best G2(4)¼ 5.28; p > :05. Simpler models were not significant (null model G2
(5)¼ 22.75; p < :05 and model with condition language only G2 (3)¼ 9.72;
p < :05). The model with condition gender and language has to be rejected either, because the decrease from DG2was not enough G2(2)¼ .73; p > :05.
The gender e¤ect was confirmed by these analyses, but language also has an influence.
Incongruity-resolution and nonsense humor: When analyzing the e¤ect of country and gender the model with condition gender only fitted best G2 (4)¼ .82;
p > :05. The other models have to be rejected (null model G2 (5)¼ 18.27;
p < :05; model with condition language only G2 (3)¼ 12.50; p < :05; model
with condition gender and language G2(2)¼ .10; p > :05.)
When computing logit analysis with language and gender, the model with the condition gender only is not significant on a a-level of .05 (G2 (4)¼ 10.19;
p¼ :037), but it fits well on the point .01 level and is significantly better than the null model (DG2(1)¼ 17.45; p < :001): null model G2(5)¼ 27.64; p < :01). The
other two models have to be rejected either (model with condition language only G2 (3)¼ 19.77; p < :01, with condition gender and language G2 (2)¼ 8.71;
p¼ :013).
Because the w2analysis and the model with the factor country and gender could
show that gender has a significant influence on the type of joke, and the current analysis also showed a big influence of the factor gender, the mere fact that the latter model reached significance only on a .01 level, cannot be interpreted as a falsifying influence of the factor.
Text in picture: The model with condition gender and language fitted best G2 (6)¼ 7.73; p > :05. The other models were not significant (null model G2
(15)¼ 59.73; p < :05; model with condition language only G2 (9)¼ 27.35;
p < :05; model with condition gender only G2(12)¼ 29.30; p < :05).
In the analysis with condition country and gender the model with condi-tion gender only fitted best (G2(12)¼ 15.17; p > :05). The others have to be
re-jected because they are not significant (null model G2(15)¼ 45.60; p < :05 and
model with condition language only G2 (9)¼ 28.22; p < :05) and because DG2
decrease not enough (model with condition gender and language G2 (6)¼ 9.62;
p > :05). The gender e¤ect was confirmed by these analyses, language also has an influence.
Instrument: When computing logit analysis with the conditions language and gen-der, the model of both variables fitted best (model with condition gender and lan-guage G2(6)¼ 10.53; p ¼ :104). The other models can be rejected (null model G2
(15)¼ 49.60; p < :05; model with condition language only G2 (9)¼ 20.03;
p < :05; model with condition gender only G2(12)¼ 30.40; p < :05Þ:
When computing logit analysis with the conditions country and gender no model fitted best (null model G2 (15)¼ 46.88; p < :05; model with condition
country only G2 (9)¼ 20.09; p < :05; model with condition gender only G2
(12)¼ 27.68; p < :05; model with condition gender and language G2 (6)¼
13.11; p¼ :041). However, the last model was almost significant. In sum, there is an influence of gender, but not a strong one.
Although the w2analyses show a significant influence of gender, the logit
anal-yses showed that the factor language is also influential. If analyzed in combination with country and gender no model fitted. However the model with both predictors was close to marginal significance. If we consider that the dependent variable has four levels, and by single comparisons only one level was significant, the results are quite inconsistent. Therefore future research should investigate the specific in-fluence of their levels.
Notes
Correspondence address: [email protected]
* The authors would like to thank the anonymous reviewers for their extensive and con-structive comments and Christian F. Hempelmann for helpful comments. This study was presented at the International Society for Humor Studies Conference, June 14–18, 2004, Dijon, France.
1. We use the term ‘‘character’’ also for cases where an animal, etc. is speaking.
2. A finer distinction was not possible, because the number of cases in each cell would be too small for an analysis.
3. Here too, a finer distinction was not possible, because the number of cases in each cell would be too small for an analysis.
4. Some authors, for example, Crawford (2003) consider gender a social construct. Even if we accept the important role of social and cultural factors, we do not agree with this ex-treme view. Rather, we consider it conceivable that cartoons are the sort of humor
pro-duction most uninfluenced by gender as defined by Crawford (2003). Access to power, status, and material resources, understood as influenced by gender, should play a minor role in cartooning, when compared to other forms of humor production, for example, in face-to-face conversation or at cabaret or satirical shows. A cartoonist can even conceal her or his gender when submitting a cartoon.
5. Miller (2000) proposes humor as well as artistic or creative skills (2000, 2001) to be in-dicators of genetic fitness. Is it possible that men had to develop a better sense of humor in order to court women? Nonsense humor is more complex than humor based on incongruity-resolution and therefore can be regarded the ‘‘better’’ type of humor. The reason that men more frequently produce cartoons with nonsense humor could be a result of evolution. However, cartoons are not drawn mainly to court women. Another critical point is that women do not prefer nonsense humor more than incongruity-resolution humor.
References
Agresti, Alan
1990 Categorical Data Analysis. New York: Wiley. Babad, Elisha Y.
1974 A multi-method approach to the assessment of humor: A critical look at hu-mor tests. Journal of Personality 42, 618–631.
Brodinsky, David M., and Janet Rubien
1976 Humor production as a function of sex of subject, creativity and cartoon content. Journal of Consulting and Clinical Psychology 44, 597–600. Burnett, Sandra A., David M. Lane, and Lewis M. Dratt
1979 Spatial visualization and sex di¤erences in quantitative ability. Intelligence 3, 345–354.
Costa, Paul T., and Robert R. McCrae
1985 The NEO Personality Inventory. Manual. Odessa, FL: PAR. Coulson, Seana, and Christopher Lovett
2004 Handedness, hemispheric asymmetries, and joke comprehension. Cognitive Brain Research 19, 275–288.
Crawford, Mary
2003 Gender and humor in social context. Journal of Pragmatics 35, 1413– 1430.
DeMaris, Alfred
1992 Logit Modeling: Practical Applications. Newbury Park, CA: Sage. Forabosco, Giovannantonio, and Willibald Ruch
1994 Sensation seeking, social attitudes and humor appreciation in Italy. Person-ality and Individual Di¤erences 16, 515–528.
Gerberg, Mort
1989 Cartooning: The Art and the Business. New York: William Morrow. Herzog, Thomas R., and David A. Larwin
1988 The appreciation of humor in captioned cartoons. The Journal of Psychol-ogy 122, 597–607.
Huber, Oswald, and Helmut Leder
1997 Are more compact cartoons more humorous? Humor: International Journal of Humor Research 10, 91–103.
Jenkins, Mercilee M.
1996 Was ist daran so lustig? Scherze unter Frauen. In Kottho¤, Helga (ed.), Das Gela¨chter der Geschlechter. Humor und Macht in Gespra¨chen von Frauen und Ma¨nnern. Constance: Universita¨tsverlag, 43–60.
Johnson, A. Michael
1990 A study of humor and the right hemisphere. Perceptual and Motor Skills 70, 995–1002.
Jones, James M., Gary A. Fine, and Robert G. Brust
1979 Interaction e¤ects of picture and caption on humor ratings of cartoons. The Journal of Social Psychology 108, 193–198.
Karabas, Seyfri
1990 Hairy Turkish cartoons. Humor: International Journal of Humor Research 3 (2), 193–215.
Keener, Polly
1992 Cartooning. Englewood Cli¤s, NJ: Prentice Hall. Kimura, Doreen
2000 Sex and Cognition. London: MIT Press. Ko¨hler, Gabriele, and Willibald Ruch
1996 Sources of variance in current sense of humor inventories: How much sub-stance, how much method variance? Humor: International Journal of Humor Research 9, 363–397.
Lampert, Martin D., and Susan M. Ervin-Tripp
1998 Exploring paradigms: The study of gender and sense of humor near the end of the 20th century. In Ruch, Willibald (ed.), The Sense of Humor: Explora-tions of a Personality Characteristic. Berlin/New York: Mouton de Gruyter, 231–270.
Maddocks, Peter
1982 So You Want To Be a Cartoonist? London: Unwin. McGhee, Paul E., Willibald Ruch, and Franz-Josef Hehl
1990 A personality-based model of humor development during adulthood. Hu-mor: International Journal of Humor Research 3, 119–146.
McKay, T. D., and M. E. McKay
1982 Captioned and non-captioned cartoons: E¤ects of structural properties on ratings of humor. Perceptual & Motor Skills 54, 143–146.
Miller, Geo¤rey F.
2000 The Mating Mind: How Sexual Choice Shaped the Evolution of Human Na-ture. New York: Doubleday.
2001 Aesthetic fitness: How sexual selection shaped artistic virtuosity as a fitness indicator and aesthetic preferences as mate choice criteria. Bulletin of Psy-chology and the Arts 2 (1), 20–25.
Nilsen, Alleen Pace, and Don L. F. Nilsen
2000 Encyclopedia of 20th century American Humor. Phoenix, Arizona: Oryx Press. Ring, Erp
1975 Eine Fehlerquelle bei Bildern als Textvorlage. Zeitschrift fu¨r experimentelle und angewandte Psychologie 22, 89–93.
Ruch, Willibald, and Franz-Josef Hehl
1998 A two-mode model of humor appreciation: Its relation to aesthetic appreci-ation and simplicity-complexity of personality. In Ruch, Willibald (ed.), The Sense of Humor: Explorations of a Personality Characteristic. Berlin/New York: Mouton de Gruyter, 109–142.
Samson, Andrea C., and Christian F. Hempelmann forthcom- Cartoons: Cognition and aesthetics. ing
Silverman, Irwin, and Krista Phillips
1998 The evolutionary psychology of spatial sex di¤erences. In Crawford, Charles and Dennis L. Krebs (eds.), Handbook of Evolutionary Psychology. Mah-wah, NJ: Erlbaum, 595–612.
Stoutsenberger, Leo
1994 Ask Leo. Cartoonist Profiles 102, 68–70. Swords, Betty
1992 Why women cartoonists are rare, and why that’s important. In Barreca, Re-gina (ed.), New Perspectives on Woman and Comedy. Studies in Gender and Culture, vol. 5. Philadelphia: Gordon and Breach, 65–84.
Whitaker, Steve
1994 The Encyclopedia of Cartooning Techniques. East-Roseville (Australia): Si-mon & Schuster Australia.
Woschek, Bernard P.