HAL Id: hal-01605704
https://hal.archives-ouvertes.fr/hal-01605704
Submitted on 26 May 2020
HAL is a multi-disciplinary open access archive for the deposit and dissemination of sci-entific research documents, whether they are pub-lished or not. The documents may come from teaching and research institutions in France or
L’archive ouverte pluridisciplinaire HAL, est destinée au dépôt et à la diffusion de documents scientifiques de niveau recherche, publiés ou non, émanant des établissements d’enseignement et de recherche français ou étrangers, des laboratoires
Marine Dewaest, Cindy Villemejane, Sophie Berland, Camille Michon, Aliette
Verel, Marie Helene Morel
To cite this version:
Marine Dewaest, Cindy Villemejane, Sophie Berland, Camille Michon, Aliette Verel, et al.. Changes in protein size distribution during wheat flour cake processing. LWT - Food Science and Technology, Elsevier, 2017, 79, pp.333-341. �10.1016/j.lwt.2017.01.036�. �hal-01605704�
Version postprint
Changes in protein size distribution during wheat flour cake processing M. Dewaest, C. Villemejane, S. Berland, C. Michon, A. Verel, M.-H. Morel
PII: S0023-6438(17)30037-3
DOI: 10.1016/j.lwt.2017.01.036
Reference: YFSTL 5988
To appear in: LWT - Food Science and Technology
Received Date: 9 August 2016 Revised Date: 12 December 2016 Accepted Date: 13 January 2017
Please cite this article as: Dewaest, M., Villemejane, C., Berland, S., Michon, C., Verel, A., Morel, M.-H., Changes in protein size distribution during wheat flour cake processing, LWT - Food Science and Technology (2017), doi: 10.1016/j.lwt.2017.01.036.
This is a PDF file of an unedited manuscript that has been accepted for publication. As a service to our customers we are providing this early version of the manuscript. The manuscript will undergo copyediting, typesetting, and review of the resulting proof before it is published in its final form. Please note that during the production process errors may be discovered which could affect the content, and all legal disclaimers that apply to the journal pertain.
Version postprint
M
AN
US
CR
IP
T
AC
CE
PT
ED
Changes in protein size distribution during wheat flour cake processing
1 2
M. DEWAEST1, 2, C. VILLEMEJANE1, S. BERLAND1, C. MICHON1, A. VEREL2, M.- H. MOREL3
3 4
1 – UMR Ingénierie Procédés Aliments, AgroParisTech, Inra, Université Paris-Saclay, 91300 Massy, France 5
2 - Mondelēz International, 91400 Saclay, France 6
3 - INRA, UMR1208-IATE Ingénierie des Agropolymères et Technologies Emergents, Montpellier, France 7 8 e-mail address 9 [email protected] 10 [email protected] 11 [email protected] 12 [email protected] 13 [email protected] 14 [email protected] 15 16 17
Corresponding author: Marie-Hélène Morel. 18
19 20
Abbreviations:
BCS: sodium bicarbonate, SAPP: sodium acid pyrophosphate, SDS: Sodium Dodecyl 21Sulfate, IAM: iodoacetamide, DTE: dithioerythritol 22
23 24
Version postprint
M
AN
US
CR
IP
T
AC
CE
PT
ED
ABSTRACT:
25Aggregation of egg and wheat proteins during cake mixing and baking was monitored by
SE-26
HPLC after sequential extraction of dough and baked cakes in SDS-buffer first and then in
27
SDS/DTE buffer. Three cake recipes were compared, including either only egg, only flour, or
28
both flour and egg proteins. Dough mixing did not result in any changes in protein solubility or size 29
distribution. Baking promoted protein aggregation and quickly resulted in the solubility loss of all 30
proteins within the first extracting solvent with the exception of wheat omega gliadins. Upon baking 31
similar kinetics of proteins solubility loss in SDS-buffer were observed regardless of cake recipes. 32
Extraction of the remaining SDS-insoluble proteins with SDS/DTE buffer allowed total protein recovery 33
but only in the case of cakes made on the basis of only flour. For cakes including eggs and despite the 34
presence of DTE a disulfide reducing agent, very large polymers were release into solution, contrarily to 35
the only flour cakes where only small polypeptides (>70 000 g/mol) were mostly recovered. Protein 36
sequential extraction combined with SE-HPLC analysis highlighted the critical role of egg proteins in 37
triggering wheat and egg proteins complexation into SDS-insoluble aggregates stabilized through 38
disulfide but also non-reducible covalent bonds. 39
40 41
Keywords:
soft cake, baking, protein thermal aggregation, protein SE-HPLC, iso-peptide bonds. 4243 44
Version postprint
M
AN
US
CR
IP
T
AC
CE
PT
ED
1.
INTRODUCTION
45Like bread, cakes are among the cereal products mainly composed of wheat flour (30-40% dry weight), 46
and characterized by a soft and elastic alveolar crumb. The setting of the alveolar structure takes place 47
during baking, as the viscous and foamy cake batter transforms into an expanded and porous soft gel. 48
Although it has long since been established that both proteins and starch play a major role in cereal 49
product texture (Donelson and Wilson, 1960), their respective roles still require investigation to fully 50
understand the mechanisms involved. 51
In bread-making, proteins only come from wheat flour, and interact during mixing, resting and baking to 52
form a gluten network. Mixing flour/water blends allows for protein hydration while mechanical shear 53
enables gluten network development by stretching and distributing the gluten evenly within the dough. 54
Gluten network is mainly responsible for dough viscoelasticity, gas retention capacity and, after cooling, 55
crumb elasticity. Dough mixing energy input, as well as the quality of the flour proteins, impacts the 56
structure of the gluten network and the subsequent physical and chemical properties of the dough. 57
Several authors have shown that gluten proteins, i.e. gliadins and glutenins, are responsible for the 58
bread-making quality of flour. Since gluten proteins represent 80—85% of the total flour proteins, the 59
flour protein content is most often considered as the first wheat flour quality criterion in bread-making. 60
However, the glutenin macropolymer content would be a better parameter to predict the bread-making 61
quality of flour (Weegels et al., 1996). 62
In cake batter, gluten proteins are more diluted into the matrix, and the mixing step is far shorter. Thus, 63
it is still unclear if a gluten network is formed or even initiated in cake batter during mixing. In particular 64
the impact of cake batter mixing on flour protein size distribution remains undocumented, while for 65
bread-making a strong depolymerization effect of mixing is well established (Weegels et al., 1997, 1996). 66
Moreover, in cake-making, wheat flour is not the only ingredient providing proteins: eggs also matter 67
and represent from 30 to 50% of the total protein content of pound cakes. Egg proteins are known to be 68
thermosensitive, and thus are supposed to play a major role in cake texture setting. In 1976, Shepherd & 69
Yoell proposed a model cake structure in which starch granules play the role of bricks, and egg proteins 70
the role of mortar. This mortar would be a composite, involving ovalbumin as a flexible cementing agent, 71
and ovomucin as a non-denaturable fibrous protein, but its structure remains unclear (Donovan, 1977). 72
More recently, it has been shown that cake cell walls are be made of a combination of a protein network 73
involving both egg and gluten proteins, built upon baking, and a starch gel, set during cooling (Deleu et 74
al., 2015; Wilderjans et al., 2010). However, the specific roles of egg proteins and gluten in cake batter 75
and then crumb structure are still currently unclear. 76
Version postprint
M
AN
US
CR
IP
T
AC
CE
PT
ED
77The SE-HPLC technique, combined to protein SDS extraction, was successfully developed by Singh, 78
Donovan, Batey, & MacRitchie (1990) for wheat flour protein characterization. Morel et al. (2000), 79
improved the technique’s reproducibility and proposed to divide the SE-HPLC profile of flour SDS soluble 80
proteins into 5 fractions, which are respectively large-size glutenin macropolymers (F1 : 800,000-81
1,700,000 g/mol), small glutenin macropolymers (F2 : 800,000-120,00 g/mol), ω gliadin (F3), and then 82
γ and α /β gliadins (F4), and latterly salt-water-soluble wheat proteins (Morel et al., 2000). In 1999, 83
Huebner, Bietz, Nelsen, Bains, & Finney used SE-HPLC to evaluate the cookie-making quality of several 84
soft wheat flours. They assumed that, despite finding no strong correlation between flour protein 85
composition and cookie quality, soft flours with higher contents of glutenin macropolymers give cookies 86
an overall better quality. As observed for bread, glutenin macropolymers may play a role in biscuit 87
quality. In 2008, Wilderjans, Pareyt, Goesaert, Brijs, & Delcour used SE-HPLC to compare the protein 88
extractabilities of batter and cake according to their gluten contents. They found that when more gluten 89
is added to cake batter, protein SDS extractability decreases further after baking while cake quality 90
increases. Gluten may therefore be presumed to play a key role in cake texture. 91
92
In light of these investigations, SE-HPLC appears to be a promising tool for monitoring protein changes 93
(polymerization and aggregation) during soft cake processing steps (mixing and baking) and therefore, a 94
better understanding of the specific roles of flour and egg proteins in cake structure building. The aim of 95
this study was to validate SE-HPLC analysis of cake proteins as an effective tool to study the interactions 96
between egg and flour proteins during cake batter mixing and baking. 97
98
2.
MATERIALS AND METHOD
99 100
2.1. Materials
101
Apache bread wheat flour (13.5% moisture content, 8.6% protein content d.b., 0.42% ash content), 102
pasteurized eggs (10.6% protein w.b., 76% water content), emulsifiers (containing 9% of milk proteins, 103
d.b.), sucrose, glucose syrup (19.7% moisture content), rapeseed oil, glycerol (0.5% moisture content), 104
salt and raising agents were all provided by Mondelēz International. Native wheat starch (12.2% 105
moisture content, 0.4% gluten) was supplied by Cargill, USA. Moisture contents were determined 106
according to AACC Approved Method 44-19 (AACC, 1983). The protein contents of flour, eggs and 107
emulsifiers were determined from triplicate measurements using Kjeldhal procedure. Nitrogen-to-108
Version postprint
M
AN
US
CR
IP
T
AC
CE
PT
ED
protein conversion factors of 5.7 for wheat flour samples and 6.25 for egg and emulsifier samples were 109
applied. 110
111
2.2. Cake batter preparation
112
The standard recipe was prepared as follows: 35.0% of wheat flour, 13.5% of eggs, 8.0% of rapeseed oil, 113
10.5% of additional water, 12% of sucrose, 12% of glucose syrup, 6% of glycerin, 1.6% of emulsifiers, 114
0.2% of salt and 1.2% of raising agents. The egg-free cake batter was prepared with the same ingredients 115
except that eggs were replaced by their water equivalents in order to keep constant the batter moisture 116
content. The gluten-free recipe was prepared by replacing the 350g of flour by 11g of water and 312g of 117
native wheat starch, in order to keep constant both starch and water contents in the gluten-free cake 118
batter. All the cake batters were prepared at 20°C using a planetary Hobart N50 5-Quart mixer with a flat 119
beater paddle (Hobart Corporation, Troy, OH, USA). Powders were homogenized before adding all 120
soluble ingredients except rapeseed oil. Mixing was started for 2.5min at medium speed, before adding 121
the oil and mixing one minute more. 122
123
2.3. Cake batter baking kinetics
124
After a resting time of 30min, the cake batter was poured into 15 metallic pans of 80x45 mm (40g of 125
batter each) and baked at 180°C for 25min. The batters’ core temperatures all increased from 20°C to 126
90°C in approximately 10min, then remained at 90°C due to their high internal moisture contents. The 127
crumb temperature increased a little faster in the case of the gluten-free batter (90°C after 7.5min of 128
baking), probably due to the lower batter viscosity and the lower air bubble content. Every 5min, 3 129
cakes were removed from the oven, one for temperature measurements and two for HPLC analysis 130
sampling. In order to limit thermal fluctuation during baking, the number of sampling (and so the oven 131
door opening) was limited to five. Two different batter batches were prepared in order to obtain 3X10 132
samples, covering a 25 min baking period 133
134
2.4. SE-HPLC characterization
135
The batter protein extraction procedure was adapted from Morel et al. (2000). Eighty milligrams of 136
freeze-dried and grinded cake batter were dispersed for 80 min at 20°C, in 10ml of 1% SDS-phosphate 137
buffer (pH 6.8) containing 5mM iodo-acetic amide (IAM). After centrifugation (30 min, 18 000rpm) the 138
supernatant (SDS-soluble protein extracts) was collected and stored at -20°C before SE-HLPC analysis. 139
The pellet was re-suspended in 5ml of 1% SDS-phosphate buffer (pH 6.8) including 40mM DTE for 1h at 140
Version postprint
M
AN
US
CR
IP
T
AC
CE
PT
ED
60°C and sonicated for 5 minutes (30% power). The supernatant (DTE-soluble protein extracts) were 141
collected after centrifugation and stored as above. SE-HPLC analysis of the samples (20µL) was 142
performed on an Alliance system (Waters) using a tandem of TSK G4000-SWXL (7.8 × 300mm) and TSK 143
SWXL (6 × 40mm) columns, both from Tosoh Biosep. Elution was performed at 0.7 mL/min with 0.1% 144
SDS, 0.1M sodium phosphate buffer (pH 6.8) and 214 nm was used for protein detection. The total 145
protein extraction yield was estimated from the sum of the area of the SDS-soluble and the DTE-soluble 146
chromatography profiles after correction for the difference in solid to solvent ratios. The un-extractable 147
protein fraction remaining in the last pellet was estimated in reference to the results obtained for the 148
mixed batter for which the extraction yield was set to 100%. Cake ingredients (flour, egg and emulsifier) 149
were similarly analyzed, except that solid to solvent ratios corresponding to their specific contribution to 150
the total dry mass of the standard batter recipe were used for extraction. The apparent molecular 151
weights of the major fractions were estimated by calibrating the column with various protein standards 152
according to Morel et al. (2000). 153
154 155
3.
RESULTS AND DISCUSSION
156 157
3.1.
SE-HPLC protein profiles of cake ingredients
158
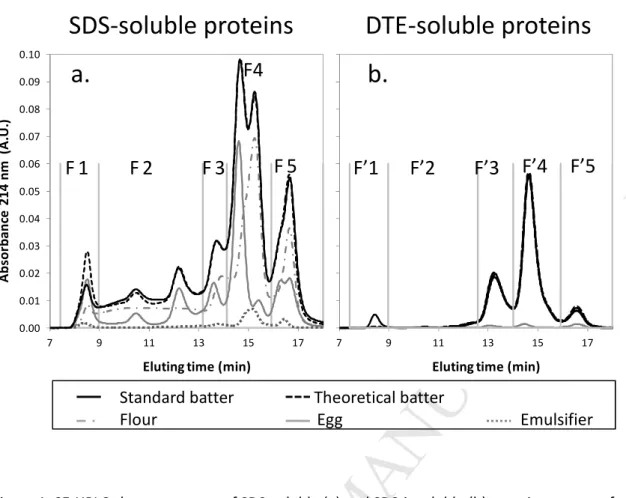
Figure 1a shows the SE-HPLC profiles of the SDS-soluble proteins from flour. The chromatogram is 159
typically divided into 5 fractions, namely F1 and F2 that include glutenin macropolymers, F3 and F4 that 160
include mostly gliadins and fraction F5 that gathers small water-soluble proteins such as albumin and 161
globulin (Morel et al. , 2000). The remaining proteins were then solubilized with a buffer including SDS 162
and DTE in order to reduce the intermolecular disulfide bonds. SE-HPLC profiles of this second extract 163
shows 3 mains peaks (Figure 1.b). The first one (F’3) can be assimilated to high-molecular-weight 164
glutenin subunits (HMW-GS) and the second one (F’4) to the low-molecular-weight glutenin subunits 165
(LMW-GS). Fraction F’5 would include water-soluble proteins, either chemically or physically linked to 166
the SDS-insoluble glutenin polymers network before its reduction by DTE. 167
The SDS-soluble whole egg protein chromatogram (Figure 1.c) presents 7 peaks but was arbitrarily 168
divided into the same 5 fractions used above, allowing for an estimate of the relative quantitative 169
contribution of egg and wheat proteins in the standard cake recipe, within the same molecular weight 170
ranges. The nature of the egg proteins as deduced from their molecular weight is presented in Table1. 171
Version postprint
M
AN
US
CR
IP
T
AC
CE
PT
ED
As shown in figure 1.e, emulsifier mostly includes water-soluble whey proteins and contributes very 172
faintly to the total protein profile of the recipe. 173
174
3.2.
SE-HPLC protein profiles of cake batter
175
Experimental profiles of the first and second sequential protein extracts of standard batter and each 176
ingredient are represented on figure 2a,b. Theoretical first and second SE-HPLC profiles were obtained 177
by summing the profiles of the ingredients containing proteins (Figure 1). 178
For both SDS-soluble and SDS-insoluble extracts, the real chromatogram superimposed with the 179
theoretical one, except for the exclusion peaks (F1 and F’1, eluting at 8.5 min). Formation of some 180
protein aggregates may have occurred during the freeze-drying step that was used to prepare dry 181
extracts of batter and egg but omitted for flour and emulsifier. 182
Since the cake batter SE-HPLC profile coincided with the sum of the SE-HPLC profiles of its protein-183
contributing ingredients, it can be deduced that neither wheat nor egg proteins underwent 184
polymerization or depolymerization during the mixing step. No covalent bond formation or rupturing 185
occurred during mixing. In addition, no SE-HPLC profile change occurred during batter resting prior to 186
baking (results not shown). During batter mixing and resting, glutenin macropolymers initially contained 187
in flour remained unchanged in terms of molecular size distribution in contrast to bread dough 188
(Mecham et al., 1962; Weegels et al., 1997). The lower mixing energy input (lower mixing speed, time, 189
and dough viscosity compared to bread dough) and the fact that gluten proteins are far more diluted in 190
cake batter may account for this lack of significant effect. 191
192
3.3.
Evolution of cake batter protein profile during the baking step
193 194
3.3.1. Evolution of cake batter protein SDS extractability during baking. 195
Proteins from egg-free, flour-free and standard batters samples collected during baking were 196
sequentially extracted and analyzed by SE-HPLC. Sequential extraction enables protein to be classified 197
into SDS-soluble and DTE-soluble proteins while the last pellet gathers the SDS-unextractable proteins 198
(Fi). Figure 3 presents the evolutions of these three protein fractions during baking for the three cake 199
recipes. 200
SDS-extractable proteins follow a three-phase evolution during baking. First, from room temperature up 201
to 60—70°C, whatever the batter formula, the total amounts of SDS-soluble and SDS-insoluble proteins 202
Version postprint
M
AN
US
CR
IP
T
AC
CE
PT
ED
remain stable. Then, between 60—70°C and 90°C, soluble protein content drops, while both SDS-203
insoluble and unextractable protein contents increase. Finally, once the baking temperature exceeds 204
90°C, the SDS-soluble protein content remains stable. 205
Wilderjans, Pareyt, Goesaert, Brijs, & Delcour (2008) also found that cake batter baking resulted in loss 206
of protein extractability in SDS buffer. They assumed that in cake batter, thermal aggregation starts 207
between 60 and 70°C and achieved as temperature exceeds 90°C. 208
Many authors reported the decrease in protein SDS extractability of wheat and egg proteins during 209
thermal treatments. The decrease is attributed to protein unfolding, exposure of hydrophobic zones and 210
formation of covalent bonds, mostly disulfide bonds (Ma and Holme, 1982; Singh and MacRitchie, 2004; 211
Singh, 2005; Van der Plancken et al., 2006). Adding DTE to the extracting solvent allowed almost total 212
protein extraction, which is consistent with the prominent role play by disulfide bonds during baking. 213
Hence in the case of standard batter (Figure 3.a and 3.c), whatever the baking time, the un-extractable 214
protein fraction remains small, and almost all the aggregated protein can be recovered after sonication, 215
disulfide bond reduction and protein denaturation with SDS. 216
In the case of the gluten-free cake recipe (Figure 3.b) even after both sonication and DTE reduction, 217
proteins become less and less extractable as baking time increases while the unextractable protein 218
fraction increases. It may indicate that, when cake batter contains only egg proteins, disulfide bonds are 219
not the only covalent bonds at play during baking, and/or that the interactions are so tight that the 220
reducing conditions do not allow the formation of small SDS-soluble aggregates. Baking of the standard 221
and gluten-free batters did not lead to similar accumulation of unextractable proteins suggesting the 222
formation of flour and egg proteins mixed aggregates. 223
224
3.3.2. Proteins involved in cake protein aggregates. 225
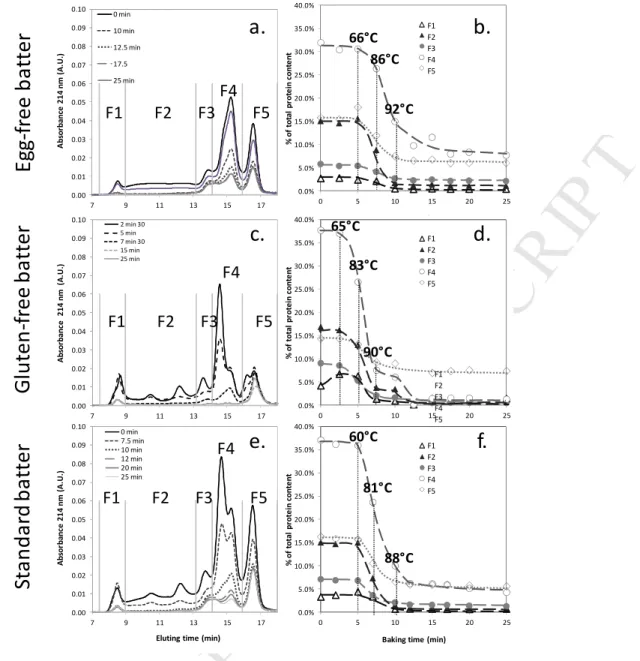
Figure 4.a shows the SE-HPLC profiles of the SDS-soluble proteins from egg-free cakes sampled at 226
different baking times. After 12.5min of baking, no more change in SDS-soluble profiles occurs and only 227
traces of protein from F3, F4 and F5 fractions remain. All fractions drop during baking, but at different 228
extents and rates (Fig. 4b). Above 60—70°C, fraction F2 rapidly decrease and disappear above 90°C. 229
Fraction F1 starts to decrease above 80°C, and totally disappears above 92°C. Fractions F3 and F5 230
decrease between 66°C and 92°C but do not completely disappear. Fraction F4 decrease is slower, 231
incomplete as well, and ends later than the other fractions do. These results are consistent with those 232
reported in the literature for heated hydrated gluten (Schofield et al., 1983; Singh and MacRitchie, 2004). 233
Version postprint
M
AN
US
CR
IP
T
AC
CE
PT
ED
Glutenin polymers (F1+F2) are found to be the first to aggregate while gliadin (F4), except omega-gliadin 234
(F3), reacts at higher temperature (>90°C). Omega-gliadins which are devoid of cysteine residues remain 235
SDS-soluble even after prolonged heating. 236
Slightly higher aggregation temperatures was observed for egg-free batter compared to heat treated wet 237
gluten. It is likely that flour dilution with large amounts of sugar and water lower protein reactivity in 238
cake batter (Donovan, 1977). Although Schofield, Bottomley, Timms, & Booth (1983) did not observe 239
globulin/albumin aggregation during heating of wet gluten, Rosell et al. (2013) found that albumin and 240
globulin partially co-aggregate with gluten proteins in flour dough during baking, which is consistent with 241
the current results. 242
Results obtained for the gluten-free cake are showed in figures 4.c and 4.d. The protein signal comes 243
from flour and egg proteins. The low density lipoprotein (LDL) amounts for more than 50% of the total 244
egg proteins followed by ovalbumin (15%), high density lipoprotein (HDL, 12.5%) and livetin (7.5%). 245
Phosvitin, ovotransferin and ovomucoid amount roughly for 3% while lyzozyme and ovomucin contribute 246
for less than 1% of total egg proteins. 247
All protein fractions decrease during baking, except fraction F1 which shows a transient increase around 248
65°C. Fraction F2, which may correspond to both yolk high density lipoprotein (HDL) and low density 249
lipoprotein (LDL), disappears in two steps; the LDL peak starts to decrease between 65°C and 83°C while 250
the HDL peak starts to decrease above 83°C. Both totally disappear above 90°C. Ovotransferrin (F3), 251
starts to decrease between 65°C and 83°C and totally disappears above 90°C. Fraction F4, which 252
probably corresponds to ovalbumin, ovoglobulin, livetin and ovomucoid, disappears in two steps; first 253
the ovalbumin-ovoglobulin-livetin peak rapidly decreases when temperature reaches 65°C, as observed 254
for F3, while the ovomucoid peak remains stable up to 83°C before totally disappearing once 255
temperature exceeds 90°C. F1, which corresponds to the larger soluble egg proteins such as ovomucin, 256
acts the same way, being stable up to 83°C before totally disappearing beyond 90°C. F5, which 257
corresponds to the smaller egg proteins such as lysozyme, only changes slightly. For all fractions, after 258
15min of baking (i.e. 8 min spent at 90°C), no more change in SDS-soluble profiles was observed. 259
Although, to our knowledge, no aggregation kinetics study was made on whole eggs, these results are 260
consistent with those found in the literature on, respectively, egg yolk and albumen: Donovan (1977), 261
found that egg albumen aggregation is mainly driven by ovotransferrin insolubilization first and, later, 262
ovalbumin. More recently, Kiosseoglou & Paraskevopoulou (2005) have reported that, in yolk, LDL and 263
livetin are more thermosensitive than HDL. 264
Version postprint
M
AN
US
CR
IP
T
AC
CE
PT
ED
Figures 4e and 4f show the results obtained for the standard cake batter. As before all protein fractions 265
tend to disappear during baking, but not at the same rate. Fraction F2 rapidly decreases above 60°C to 266
totally disappear beyond 90°C. Fractions F3, F4 and F5 severely drop between 60 and 90°C as well but do 267
not disappear at the end of baking. Fraction F1 decreases later, once temperature rises above 81°C, and 268
a few SDS-soluble proteins remain present after baking. Above 90°C, all remaining fractions do not 269
evolve or drop slightly. After baking, the SDS-soluble protein extract mostly includes fractions F3, F4 and 270
F5, as observed for the egg-free recipe. 271
Whatever the recipe, most of the changes in protein SDS extractability occur between 65 and 90°C. In 272
the case of the standard cake, protein SDS solubility might start slightly earlier, as soon as the 273
temperature reaches 60°C. The early stages of cake protein aggregation mostly involved glutenin, 274
ovalbumin, ovotransferrin, LDL, livetin and lysozyme. Gliadin, HDL and ovomucin then aggregated as 275
well. Once the temperature reaches 90°C, a comparison of the baking profiles of standard cake batter 276
formula and egg-free batter formula (Figures 4.a and 4.e) shows that the SDS-soluble protein profiles are 277
quite similar. Regardless of the presence or absence of egg proteins, the same flour proteins, in the same 278
temperature/time ranges will aggregate. 279
280
3.3.3. Protein aggregate size evolutions during baking. 281
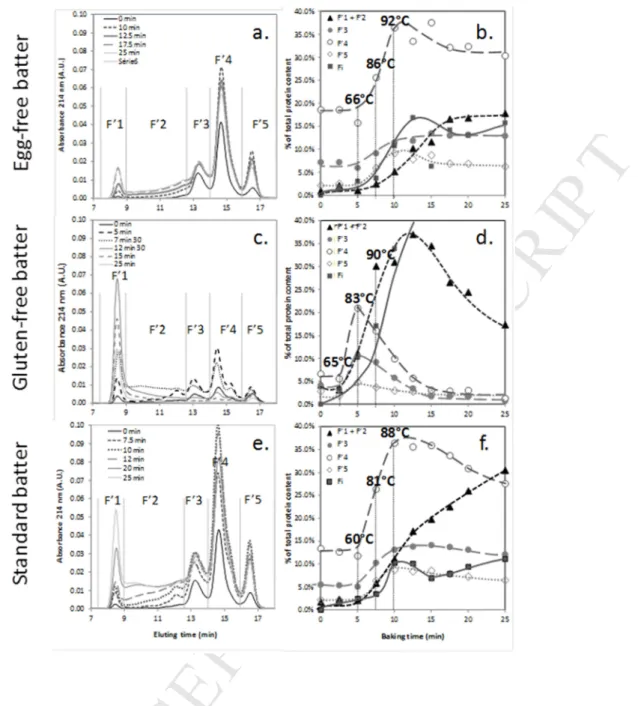
Figure 5 shows the SE-HPLC SDS-insoluble protein profiles (second extract in SDS/DTE) after different 282
baking times for the egg-free (a), gluten-free (c) and standard (e) cake recipes. Evolutions of the SE-HPLC 283
fractions are represented as well (figures 5b, 5d, and 5f). Areas numbered from F’1 to F’5 consist in the 284
DTE-reduced protein fractions as defined in section 3.1, and Fi represents unextractable proteins. For 285
sake of clarity and since both F’1 and F’2 fractions include covalently linked protein species in contrast 286
with F’3, F’4 and F’5 which include the constitutive egg or gluten protein monomers, their evolutions are 287
grouped in a F’1+F’2 curve. 288
Figure 5 reveals strong differences between the three different recipes in contrast with what was 289
observed for the soluble proteins (Figure 4). After extraction with DTE and sonication, the SDS-290
insoluble proteins from egg-free samples are at first brought into solution in the form of monomeric 291
polypeptides: HMW-glutenin subunits (F’3), LMW-glutenin subunits and gliadin (F’4) and smaller 292
polypeptides (see section 3.1) (Figure 5.a). Nevertheless, between 12 to 17 min baking and while the 293
majority of the SDS-soluble proteins have been insolubilized (Figure 4b), the SE-HPLC profile continues to 294
evolve before stabilizing. Accumulation of large protein species (F’1+F’2) occur at the expense of 295
monomeric species from fractions F’4 and F’5 (Figure 5b). This is consistent with the multi-steps 296
Version postprint
M
AN
US
CR
IP
T
AC
CE
PT
ED
aggregation mechanism of gluten protein postulated by several authors (Weegels et al., 1997; Singh & 297
MacRitchie, 2000). First, heating would induce the formation of disulfide bonds by oxidation of thiol 298
groups, mostly between glutenin polymers, resulting in the formation of SDS-insoluble aggregates that 299
could entrap some gliadin. Then gliadin, except ω-gliadin which have no cysteine residue, will unfold and 300
form disulfide bonds through sulfhydryl-disulphide exchanges with the firstly formed SDS-insoluble 301
glutenin aggregates (Domenek et al., 2002). Aggregates grow in size since the number of disulfide bonds 302
stabilizing their structure increases. These highly crosslinked aggregates would resist more to the 303
disrupting effect of DTE and sonication leading to an increase of the (F’1+ F’2) fraction. 304
Egg proteins behave differently (Figures 5.c, 5d). In the very early stage of baking, i.e. from 65 to 80°C, 305
monomeric polypeptides (F’3, F’4, F’5) are recovered, indicating that disulfide bond formation is at first 306
involved in egg protein thermal aggregation (Figures 4c, 4d). This is consistent with the literature on both 307
egg yolk and albumen (Kiosseoglou and Paraskevopoulou, 2005; Van der Plancken et al., 2006). Since 308
ovalbumin is the only egg protein to present free sulfhydryl groups, but not the only one to be 309
insolubilized in this temperature range (see section 3.2), it can be assumed that sulfhydryl/disulfide bond 310
exchanges occur and mixed egg proteins aggregates are formed. Then, above 80°C, large DTE-resistant 311
aggregates accumulates (F’1 + F’2), at the expense of the monomeric species (F’3, F’4, F’5). Further 312
baking leads to the drop of these large aggregates while the amount of unextractable protein (Fi) sharply 313
increases. This proves the formation of DTE and sonication resistant aggregates connected through 314
covalent bonds possibly of iso-peptide type (Mohammadi Nafchi et al., 2013). Indeed, since the recipe 315
contains glucose syrup and egg-lysine-rich proteins, Maillard reaction can occur to form cross-links which 316
will not be broken in presence of either denaturant or reducing agents. It is noteworthy to underline that 317
the longer the baking the more densely cross-linked the protein aggregates will be; contrarily to what 318
was observed for egg-free recipe where an equilibrium situation was observed after 17 min baking. 319
As for the egg-free formula, DTE-soluble protein profiles of the uncooked standard cake samples (Figures 320
5.e and 5f) contain three main peaks (F’3, F’4 and F’5), which likely derive from flour proteins, and a 321
small exclusion peak which can be attributed to egg protein aggregates (F’1). During the early stages of 322
baking and as observed for the previous recipes, F’3, F’4 and F’5 increase indicating that the first formed 323
SDS-insoluble protein aggregates can be readily disrupted by DTE and sonication into the constitutive egg 324
and flour protein monomers. Then above 90°C, F’4 (mostly ovalbumin, gliadin and LMW-glutenin) and to 325
a smaller extent F’3 (mostly HMW-glutenin) and F’5 decrease, at the benefit of F’1 + F’2 (Figure 5f). The 326
SDS-insoluble protein aggregates become more and more resistant to the disrupting action of DTE and 327
sonication. However, contrarily to the gluten-free recipe, the amount of unextractatible protein (Fi) 328
Version postprint
M
AN
US
CR
IP
T
AC
CE
PT
ED
remained low. This would indicate that less iso-peptide bonds takes place between the egg proteins 329
when flour proteins are also present. Contrarily to the egg-free recipe, F’1 + F’2 keeps growing all along 330
baking, while accumulation of unextractable proteins remains even below the range observed for the 331
egg-free samples. All these results support a mixed reactivity between wheat and egg proteins 332
aggregates above 90°C. During standard cake baking, protein aggregation would proceed in two steps. 333
From 65°C to 90°C, egg and flour protein would form homo-aggregates mostly stabilized by inter-chain 334
disulfide bonds. Egg proteins would then support crosslinking between both types of proteins aggregates 335
through the formation of iso-peptide bonds. In the full cake recipe, egg proteins will contribute to 336
reinforce the protein connectivity and are likely to impact the crumb mechanical strength. 337
338
4.
CONCLUSION
339
Following the changes in protein solubility and size distribution during cake mixing and baking was made 340
possible by using SE-HPLC and sequential protein extraction. Flour and egg proteins interactions during 341
cake processing were deduced from the study of standard, egg-free and gluten-free recipes. It was 342
shown that mixing did not result in gluten network development contrarily to what is commonly 343
observed during bread dough mixing. Baking induced protein aggregation but gluten and egg proteins 344
did not react in the same way when present separately or combined. Below 90°C, egg and wheat 345
proteins aggregated mainly through a thiol/disulfide exchange mechanism but did not seem to interact 346
together. The formed SDS-insoluble protein aggregates were brought into solution and analyzed by SE-347
HPLC after their disruption by sonication in the presence of SDS and DTE. By this way it was possible to 348
demonstrate that the SDS-insoluble aggregates structure continued to evolve all along baking. Hence, 349
the egg SDS-insoluble aggregates from the gluten-free recipe became less and less sensitive to DTE and 350
sonication, indicating the formation of permanent iso-peptide bonds between egg proteins. In the same 351
time/temperature baking range, the gluten SDS-insoluble aggregates from egg-free recipe remained 352
sensitive to DTE suggesting that covalent disulfide bonds were mainly accountable for protein 353
aggregation all along cake baking. An intermediate situation was observed for the standard recipe 354
indicating that above 90°C egg and wheat protein involved in separated aggregates started to interact 355
and formed mixed and DTE-resistant aggregates. In cake recipe, egg proteins would contribute to 356
increase the crosslinking density of the gluten protein aggregates all along the baking stage. 357
358
ACKNOWLEDGEMENTS
Version postprint
M
AN
US
CR
IP
T
AC
CE
PT
ED
Joëlle Bonicel (UMR IATE 1208) and Anne-Flore Monnet (Mondelez) are warmly thanked for their 360 technical support. 361 362 363
REFERENCES
364Deleu, L.J., Wilderjans, E., Van Haesendonck, I., Courtin, C.M., Brijs, K., Delcour, J.A. (2015). Storage 365
induced conversion of ovalbumin into S-ovalbumin in eggs impacts the properties of pound cake 366
and its batter. Food Hydrocoll., 49, 208–215. 367
Domenek, S., Morel, M.-H., Bonicel, J., Guilbert, S. (2002). Polymerization Kinetics of Wheat Gluten upon 368
Thermosetting. A Mechanistic Model. J. Agric. Food Chem., 50, 5947–5954. 369
Donelson, D.H., Wilson, J.T. (1960). Studies on the effect of flour-fraction interchange upon cake 370
quality.pdf. Cereal Chem., 37, 683–710. 371
Donovan, J.W. (1977). A study of the baking process by differential scanning calorimetry. J. Sci. Food 372
Agric., 28, 571–578.
373
Huebner, F.R., Bietz, J.A., Nelsen, T., Bains, G.S., Finney, P.L. (1999). Soft Wheat Quality as Related to 374
Protein Composition. Cereal Chem., 76, 650–655. 375
Kiosseoglou, V., Paraskevopoulou, A. (2005). Molecular interactions in gels prepared with egg yolk and its 376
fractions. Food Hydrocoll., 19, 527–532. 377
Ma, C.-Y., Holme, J. (1982). Effect of Chemical Modifications on Some Physicochemical Properties and 378
Heat Coagulation of Egg Albumen. J. Food Sci., 47, 1454–1459. 379
Mecham, D.K., Sokol, H.A., Pence, J.W. (1962). Extractable protein and hydration characteristics of flours 380
and doughs in dilute acid. Cereal Chem.,39, 81-93. 381
Mine, Y. (2008). Egg Bioscience and Biotechnology.Wiley-Interscience. 382
Mohammadi Nafshi, A., Tabatabaei, R.H., Pashania, B., Rajabi, H.Z., Karim, A.A. (2013). Effects of ascorbic 383
acid and sugars on solubility, thermal, and mechanical properties of egg white protein gels. Int. J. 384
Biol. Macromol., 62, 397–404.
385
Morel, M.-H., Dehlon, P., Autran, J.C., Leygue, J.P., Bar-L’Helgouac'h, C. (2000). Effects of Temperature, 386
Sonication Time, and Power Settings on Size Distribution and Extractability of Total Wheat Flour 387
Proteins as Determined by Size-Exclusion High-Performance Liquid Chromatography. Cereal Chem., 388
77, 685–691.
Version postprint
M
AN
US
CR
IP
T
AC
CE
PT
ED
Nau, F., Guérin-Dubiard, C., Baron, F., Thapon, J.L. (2010). Science et Technologie de l’oeuf, Volume 2 : De 390
l'Oeuf aux Ovoproduits. Lavoisier.
391
Rosell, C.M., Altamirano-Fortoul, R., Don, C., Dubat, A. (2013). Thermomechanically Induced Protein 392
Aggregation and Starch Structural Changes in Wheat Flour Dough. Cereal Chem., 90, 89–100. 393
Schofield, J.D., Bottomley, R.C., Timms, M.F., Booth, M.R. (1983). The effect of heat on wheat gluten and 394
the involvement of sulphydryl-disulphide interchange reactions. J. Cereal Sci., 1, 241–253. 395
Shepherd, I.S., Yoell, R.W. (1976). Cake emulsions. Food Emuls. 396
Singh, H. (2005). A study of changes in wheat protein during bread baking using SE-HPLC. Food Chem., 397
90, 247–250.
398
Singh, H., MacRitchie, F. (2004). Changes in proteins induced by heating gluten dispersions at high 399
temperature. J. Cereal Sci., 39, 297–301. 400
Singh, N.K., Donovan, G.R., Batey, I.L., MacRitchie, F. (1990). Use of Sonication and Size-Exclusion High 401
Performance Liquid Chromatography in the Study of Wheat Flour Proteins. I. Dissolution of Total 402
Proteins in the Absence of Reducing Agents. Cereal Chem. ,67, 150–161. 403
Van der Plancken, I., Van Loey, A., Hendrickx, M.E. (2006). Effect of heat-treatment on the physico-404
chemical properties of egg white proteins: A kinetic study. J. Food Eng., 75, 316–326. 405
Weegels, P.L., Hamer, R.J., Schofield, J.D. (1997). Depolymerisation and Re-polymerisation of Wheat 406
Glutenin During Dough Processing. II. Changes in Composition. J. Cereal Sci., 25, 155–163. 407
Weegels, P.L., van de Pijpekamp, A.M., Graveland, A., Hamer, R.J., Schofield, J.D. (1996). 408
Depolymerisation and Re-polymerisation of Wheat Glutenin During Dough Processing. I. 409
Relationships between Glutenin Macropolymer Content and Quality Parameters. J. Cereal Sci., 23, 410
103–111. 411
Wilderjans, E., Luyts, A., Goesaert, H., Brijs, K., Delcour, J.A. (2010). A model approach to starch and 412
protein functionality in a pound cake system. Food Chem., 120, 44–51. 413
Wilderjans, E., Pareyt, B., Goesaert, H., Brijs, K., Delcour, J.A. (2008). The role of gluten in a pound cake 414
system: A model approach based on gluten–starch blends. Food Chem., 110, 909–915. 415 416 417 418 419 420
Version postprint
M
AN
US
CR
IP
T
AC
CE
PT
ED
421Version postprint
M
AN
US
CR
IP
T
AC
CE
PT
ED
Figure 1 : SE-HPLC protein profiles of cake ingredients containing proteins. SDS-soluble (a) and DTE-soluble (b) protein extracts of Apache flour ; SDS-DTE-soluble (c) and DTE-DTE-soluble (d) extracts of pasteurized whole eggs ; SDS-soluble extract of emulsifier (e). No DTE-soluble protein extract was found for emulsifier. Sample mass was adjusted to the amount theoretically found in 80 mg of the standard cake recipe (dry basis)
0.00 0.01 0.02 0.03 0.04 0.05 0.06 0.07 0.08 0.09 7 9 11 13 15 17 A b so rb a n ce 2 1 4 n m ( A .U .)
Eluting time (min)
0.00 0.01 0.02 0.03 0.04 0.05 0.06 0.07 0.08 0.09 0.10 7 9 11 13 15 17 A b so rb a n ce 2 1 4 n m ( A .U .)
Eluting time (min)
0.00 0.01 0.02 0.03 0.04 0.05 0.06 0.07 0.08 0.09 7 9 11 13 15 17 A b so rb a n ce 2 1 4 n m ( A .U .)
Eluting time (min)
0.00 0.01 0.02 0.03 0.04 0.05 0.06 0.07 0.08 0.09 0.10 7 9 11 13 15 17 A b so rb a n ce 2 1 4 n m ( A .U .)
Eluting time (min)
F
lo
u
r
E
g
g
E
m
u
ls
if
ie
r
a.
b.
c.
d.
e.
F 1 F 2 F 3 F4 F 5 F’1 F’2 F’3 F’4 F’5 F 1 F 2 F 3 F4 F 5 F’1 F’2 F’3 F’4 F’5 0.00 0.01 0.02 0.03 0.04 0.05 0.06 0.07 0.08 0.09 0.10 7 9 11 13 15 17 A b so rb a n ce 2 1 4 n m ( A .U .)Eluting time (min)
Version postprint
M
AN
US
CR
IP
T
AC
CE
PT
ED
Figure 1: SE-HPLC chromatograms of SDS-soluble (a) and SDS-insoluble (b) protein extracts of standard cake batter and of the cake ingredients (flour, egg and emulsifier) that include proteins. A theoretical standard cake batter chromatogram was calculated by summing, in regards to their batter proportions, the chromatograms of egg, flour and emulsifier.
0.00 0.01 0.02 0.03 0.04 0.05 0.06 0.07 0.08 0.09 0.10 7 9 11 13 15 17 A b so rb a n ce 2 1 4 n m ( A .U .)
Eluting time (min)
0.00 0.01 0.02 0.03 0.04 0.05 0.06 0.07 0.08 0.09 0.10 7 9 11 13 15 17 A b so rb a n ce 2 1 4 n m ( A .U .)
Eluting time (min)
a.
b.
F
1
F
2
F
3
F4
F
5
F’1
F’2
F’3
F’4
F’5
Standard batter Theoretical batter
Version postprint
M
AN
US
CR
IP
T
AC
CE
PT
ED
Figure 3: Cake crumb protein SDS extractability of an egg-free recipe (a), a gluten-free recipe (b) and a standard recipe (c) during baking. For each baking time, unextractable protein fraction was
calculated from the difference in total SE-HPLC area between the initial un-baked batter and batter at current baking time.
0 2 4 6 8 10 12 14 0 2.5 5 7.5 10 12.5 15 17.5 20 25 S E -H P LC t o ta l a re a ( A .U .)
Baking time (min)
SDS-soluble proteins DTE-soluble proteins unextractable proteins 60°C 81°C 88°C 0 2 4 6 8 10 12 14 0 2.5 5 7.5 10 12.5 15 17.5 20 25 S E -H P LC t o ta l a re a
Baking time (min)
SDS-soluble proteins DTE-soluble proteins unextractable proteins 65°C 83°C 90°C 0 2 4 6 8 10 12 14 0 2.5 5 7.5 10 12.5 15 17.5 20 25 S E -H P L C t o ta l a re a
Baking time (min)
SDS-soluble proteins DTE-soluble proteins unextractable proteins 66°C 86°C 92°C
Baking time (min) Baking time (min) Baking time (min)
S E -H P L C t o ta l a re a ( A .U .)
Version postprint
M
AN
US
CR
IP
T
AC
CE
PT
ED
Figure 4 : SE-HPLC SDS-soluble protein profiles (a, c, e) and compositions (b, d, f) of egg-free, gluten-free and standard cake batters during baking. SE-HPLC protein fractions were obtained by calculating SE-HPLC fraction areas at different baking times.
0.0% 5.0% 10.0% 15.0% 20.0% 25.0% 30.0% 35.0% 0 5 10 15 20 25 % o f to ta l p ro te in c o n te n t
Baking time (min) F1S/(FS+FC+Fi) F2S/(FS+FC+Fi) F3S/(FS+FC+Fi) F4S/(FS+FC+Fi) F5S/(FS+FC+Fi) 0.0% 5.0% 10.0% 15.0% 20.0% 25.0% 30.0% 35.0% 40.0% 0 5 10 15 20 25 % o f to ta l p ro te in c o n te n t
Baking time (min) F1S/(FS+FC+Fi) F2S/(FS+FC+Fi) F3S/(FS+FC+Fi) F4S/(FS+FC+Fi) F5S/(FS+FC+Fi)
E
g
g
-f
re
e
b
a
tt
e
r
G
lu
te
n
-f
re
e
b
a
tt
e
r
S
ta
n
d
a
rd
b
a
tt
e
r
0.00 0.01 0.02 0.03 0.04 0.05 0.06 0.07 0.08 0.09 7 9 11 13 15 17 A b so rb a n ce 2 1 4 n m ( A .U .) Time (min) 10 min 12.5 min 17.5 25 min F1 F2 F3 F4 F5 0.00 0.01 0.02 0.03 0.04 0.05 0.06 0.07 0.08 0.09 0.10 7 9 11 13 15 17 A b so rb a n c e 2 1 4 n m (A .U .)Eluting time (min)
2 min 30 5 min 7 min 30 15 min 25 min F1 F2 F3 F4 F5 0.00 0.01 0.02 0.03 0.04 0.05 0.06 0.07 0.08 0.09 0.10 7 9 11 13 15 17 A b so rb a n c e 2 1 4 n m ( A .U .)
Eluting time (min) 0 min 7.5 min 10 min 12 min 20 min 25 min F1 F2 F3 F4 F5 0.0% 5.0% 10.0% 15.0% 20.0% 25.0% 30.0% 35.0% 40.0% 0 5 10 15 20 25 % o f to ta l p ro te in c o n te n t
Baking time (min) F1S/(FS+FC+Fi) F2S/(FS+FC+Fi) F3S/(FS+FC+Fi) F4S/(FS+FC+Fi) F5S/(FS+FC+Fi)
a.
c.
e.
d.
b.
F1 F2 F3 F4 F5 F1 F2 F3 F4 F5 F1 F2 F3 F4 F5f.
F1 F2 F3 F4 F5 66°C 86°C 92°C 60°C 81°C 88°C 65°C 83°C 90°CVersion postprint
M
AN
US
CR
IP
T
AC
CE
PT
ED
Figure 5. SE-HPLC DTE-soluble protein profiles (a, c, e) and compositions (b, d, f) of egg-free, gluten-free and standard cake batters during baking. SE-HPLC protein fractions were obtained by calculating SE-HPLC fraction areas at different baking times and were summed to evaluate DTE-soluble protein composition. The unextractable protein fraction was also estimated.
Version postprint
M
AN
US
CR
IP
T
AC
CE
PT
ED
• Cake protein aggregation during processing was studied using SE-HPLC
• Dough mixing does not impact the size distribution of egg and flour proteins
• Egg and flour proteins formed mixed aggregates upon baking
• Mixed aggregates are stabilized by thiol/disulfide and iso-peptide bonds