Analysis and Design of a Formula SAE Powertrain
by Samantha Bray
Submitted to the
Department of Mechanical Engineering
in Partial Fulfillment of the Requirements for the Degree of Bachelor of Science in Mechanical Engineering
at the
Massachusetts Institute of Technology
June 2016
C 2016 Samantha Bray. All rights reserved.
MASSACHUSETTS INSTITUTE OF TECHNOLOGY
JUL 0,8 2016
LIBRARIES
ARQIIVES
The author hereby grants to MIT permission to reproduce and to distribute publicly paper and electronic copies of this thesis document in whole or
in part in any medium now known or hereafter created.
Signature of Author:
Signature redacted
Certified by:
Professor of Mechanical Engineering
Accepted by:
Department of Mecha cal Engineering May 19, 2016
Signature redacted
Amos Winter Thesis SupervisorSignature redacted
Anette Hosoi Professor of Mechanical Engineering Undergraduate OfficerAnalysis and Design of a Formula SAE Powertrain
by Samantha Bray
Submitted to the Department of Mechanical Engineering on May 19, 2016 in Partial Fulfillment of the
Requirements for the Degree of
Bachelor of Science in Mechanical Engineering
ABSTRACT
This thesis will analyze the MIT Fom-iula SAE car to determine performance of our current and ftiture cars. The conclusion of this analysis will drive the powertrain decisions for our Model Year 2017 (MY 17) and other future cars. Very little data relating to our cars currently exists, but is vital to proper design; therefore, that is the first step of this thesis. After current performance has been gaged, the next step will be determining a motor that will optimize vehicle performance for competition. From this our team could use either two motors with an electronic differential or one motor with a limited slip differential. Tangential to determining motors, analysis will also be done to determine whether chains or a planetary gear system would be more optimal for connecting the motor output to the rear wheels.
Thesis Supervisor: Amos Winter
Acknowledgments
The author would like to thank:
Professor Winter for his advice and guidance during the process of writing this thesis. His unlimited knowledge of cars provided invaluable assistance throughout this semester and project, and his overall assistance to the team is amazing.
Patrick McAtamney for his endless advice and assistance with anything revolving around racecar, or design and manufacturing decisions. He always finds time to help a student when they need it, and his personality makes all of the work the FSAE team does more enjoyable.
Dick Perdichizzi and Kelly O'Brien for their time and assistance during wind tunnel testing.
All of the MIT FSAE members, faculty advisors, alumni, and sponsors. Three years on this team has felt like a lifetime; it's amazing looking back and realizing everything being on this team has taught me. Every teammate makes the long hours and disappointments worth it; and being with them makes every success feel incredible. Thank you.
Table of Contents
1.0 Introduction ... 6
1 -I Overview of Form ula SAE ... 6
1.2 M IT M otorsports ... 7
2.0 Testing and Analysis ... 7
2.1 Frictional Losses ... 8
2.2 Aerodynam ic Drag ... 9
2.3 Quantifying System Losses ... 12
3.0 Powertrain Requirem ents ... 13
3.1 FSAE Rules ... 13 3.2 Torque ... 14 3.3 Speed ... 15 3.4 IP Standards ... 16 4.0 Potential M otors ... 16 4.1 EM RAX 228 ... 17 4.2 EM RAX 207 ... 18 4.3 YA SA 400 ... 19
4.4 One M otor Versus Two M otors ... 20
4.5 NWhich M otor ... 20
5.0 Drivetrain ... 21
5.1 Chain Versus Planetary Gears ... 21
1.0 Introduction
The past motor assembly was designed in 2013 using two EMRAX 228 motors and a chain drive system. From testing the current car and further analysis, the team has reached a point where a more informed decision can be made for the next powertrain design. Therefore, this thesis will focus on some aspects that were not easily quantifiable in the past and how this added information helps drive the requirements of the motors. In addition, focus will be placed on how the motors will be driven, mainly looking at the optimal mechanism for torque transfer. This thesis serves as a guideline to help prepare the team for Model Year 17 design.
1.1 Overview of Formula SAE
Formula SAE, or FSAE, is a competition where teams from all over the world work to design and manufacture an open-wheel racecar; each team typically spends one year constructing a new, custom Formula Style car. There are ten main competitions every year, three of which are in the United States.
The main objective of Formula SAE is to give students an opportunity to gain hands on experience on different facets of engineering. Not only are students expected to design a reliable mechanical system, but they are expected to understand and interpret the complicated analysis that result. In order to do well at competition, driver ergonomics and handling become very important, in addition to the base design parameters.
There are three main subcategories for static events at competition which include cost, business, and design. Cost and business are strongly related as students are expected to produce a cost effective design that could be marketable and profitable, a challenge many engineers miss during the undergraduate experience. The design portion is composed of an explanation of the decisions that drove the design of the racecar. All of these categories culminate to provide students with a real world application of what they learn in the classroom.
1.2 MIT Motorsports
The MIT FSAE team, MIT Motorsports, started making combustion cars in 2001. Starting from nothing, the team worked to create an infrastructure beginning with the implementation of management positions and leaning how the FSAE competition works. Many different machine shops and cars later, the team achieved a seventh place finish in the West competition in 2012, with their final combustion car.
The team has faced many challenges over the years, trying to develop a balance between learning and efficiency. For example, the team's steel tube space frame is now sent out to be profiled instead of ground down manually in house. Taking away from repetitive, time consuming tasks has provided the team a greater opportunity to refine other subsystems and apply greater focus on system dynamics.
Then, in 2012 the team made the decision to transition from combustion to electric racecars. After a lot of discussion, the team determined this direction would provide a new challenge while also merging with the newer developing technologies currently available. At this point, MIT Motorsports embarked on a two year build cycle, learning as much about electric cars as possible while also recruiting a larger electrical and computer engineering base. The team would then compete in the brand new FSAE Electric subdivision. Many changes had to be made to vehicle design in order to accommodate this new direction. During this transition, a large portion of the vehicle dynamics became heavily theoretical, as, due to unforeseen electrical issues, it was three years later, in 2015, that the team produced their first ever, running electric racecar.
2.0 Testing and Analysis
Having gone three years without a running vehicle created a new generation of the team without driving and tuning experience. A slight disconnect between design and performance formed, as individuals relied on past team knowledge and very limited testing that could be done with each subsystem. Getting Model Year 2015 (MY15) running was a pinnacle moment for the team. While working on MYl6 design, the team took time on weekends to test the MYl5 car. Many subsystems performed very well; however, minor issues occurred such as the delamination of a
rear airfoil and some overlooked considerations of driver ergonomics. These complications are issues one is unable to observe in the absence of testing.
Now that the FSAE team has the ability to do testing, the next task is determining what data should be taken. A MATLAB and a Carsim model were created for the initial design of the team's electric vehicle. A large quantity of information in these models is purely theoretical, which can only partially inform design decisions. In order to determine the best motor, in addition to battery capacity and other features, testing needs to be done to confirm or correct the theoretical model. As the MIT Motorsports has not had an opportunity to thoroughly test an electric car, test procedures have to be decided and planned.
2.1 Frictional Losses
A major contribution to energy loss is a result of the system's inefficiencies. These losses occur from sources such as bearing friction, belt inefficiencies, system deformations, and heat dissipation in addition to others. Typically described as rolling losses, these factors are difficult to quantify in a purely theoretical manner. However, such losses greatly impact vehicle performance for any car. As the FSAE Electric competition includes an endurance portion, where the vehicle is required to drive twenty-two kilometers on one battery charge, the effects of these losses are critical.
Since these losses are difficult to predict accurately, the team needs another way to quantify their magnitude. Currently, there are sensors that read throttle pedal position and transmit these signals into torque commands for the motor. The motor itself has a speed sensor. Therefore, rear wheel speed can easily be determined during testing. The front wheels are setup with hall-effect sensors, chosen because they are easy to package and work effectively for this application. Therefore, the actual speed of the car can be determined as the front wheel spin without slipping. From these sensors, we can run the car at a constant velocity, taking in how fast the motors are spinning and how fast the wheels actually spin as a result.
Without testing, the rolling resistance torque can still be roughly estimated. The loss coefficient for a car can range from 0.01 to 0.03; for this, 0.03 will be used to assume worse case scenarios
[l]. This coefficient is just multiplied by the normal force which relates to the weight of the car and the aerodynamic forces. This normal force is approximately 3 ,600N at a speed of about 30mph. Therefore frictional losses account for a 1 ON, translating into about twenty-eight newton meters loss of torque. This is very low and doesn't account for the inefficiencies of the drivetrain components that will be discussed later. Aerodynamic drag will have a larger impact than friction losses of the tires, or rolling resistance at higher speeds.
2.2 Aerodynamic Drag
As the MY15 and MY16 both have full aerodynamic packages, the impacts of aerodynamic
forces must also be considered. As every car our team builds is first designed in SolidW orks, an
initial prediction of the drag and downforce can be quantified. In addition, an analytical analysis
gives decent predictions.
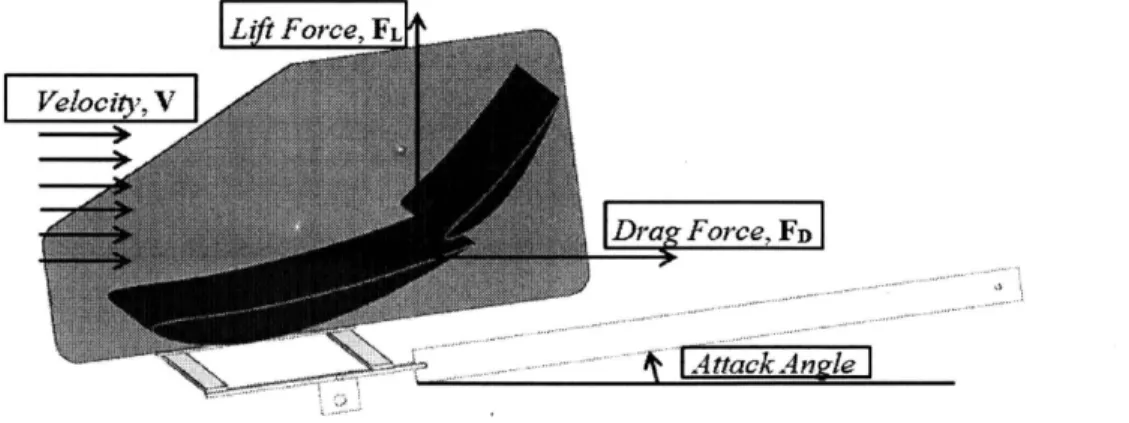
For example, looking at solely the rear wing, its influence on the system can be determined. Seen
below is a free body diagram simplification of the rear wing from MY 15. It was mounted to a
system that can be tested in a wind tunnel, and only focuses on the major forces.
d""' ., ... .
~) l
, ... : ... , .. ., ...•...•.
Figure 1: Free body diagram of the rear wing. The Angle of Attack can be varied during testing, but will
be mounted at approximately zero degrees on the MY15 race car. The velocity, v, is the speed the air travels; the lift force, FL, is the down force achieved; and the drag force, FL, is the resistance to movement that will be incurred.
For the simplified characterization of this system for drag, one can compute the force from a commonly used equation. A car will have less resistance while being driven if it has a lower drag
coefficient, CD. A lower drag coefficient leads to a lower drag force, FD, and, consequently, less power consumption. The calculation of the drag relates to the air density, p; the drag coefficient,
CD; the frontal area (perpendicular to the front of the car), A,; and the relative velocity, v, of the
test piece with wind speed.
(1) 1
FD = p -Ac -CD -v 2
2
By using Equation 1, one can find the drag force of the rear wing assembly as a function of the relative air velocity. One can group together the cross-sectional area and the coefficient of drag as both should be constant based on the vehicle design. This is a simplification that does not take into considerations the complications of boundary layers.
The coefficient of drag for this wing was estimated using Xfoil software. The values for these constants are located in Table 1 below.
Table 1: Known or Calculated Constants
Variable Value Units
Density of Air, p (at 5'C) 1. 269 kg/M3
Cross Sectional Area, A, 0.2144 m2
Drag Coefficient, CD 0. 97
-The greatest error for these numbers would likely be seen in the drag coefficients; their experimental determination is more difficult as it involves converting two dimensional results into three dimensions. Another influence is that the surface finish of the tested wing is carbon fiber, so rougher than the smooth surface Xfoil assumes.
The main observation from this analysis is how analytical calculation or flow simulations in SolidWorks compare to the actual physical results. Below is a bar graph that illustrates the difference in the drag force as determined analytically, through simulation, or experimentally.
The experimental data was gathered using force sensors in the MIT Wright Brother Wind Tunnel (WBWT) last spring.
Drag Force
120
i = Analytical Results
100 Solid Works Flow Simulation.
10 =Experimental Results 60 2 40i 20 20mph 30mph 40mph 50mph 60mph
Figure 2: Comparison of the drag force, FD, found analytically and by using Solid
Works Flow Simulation with experimental results found in the MIT WBWT.
The SolidWorks Simulation results tended to be pretty consistent with the analytical results. However, the experimental results could have as much as a 57% error compared to the theoretical data. In addition, though the results seemed more in sync as higher speeds, it is likely the experimental drag was decreasing due to the deflection of the mounting system. This is yet another example of how critical it is that the drag of the car is determined experimentally in the future. However, actual experimentation is not always achievable.
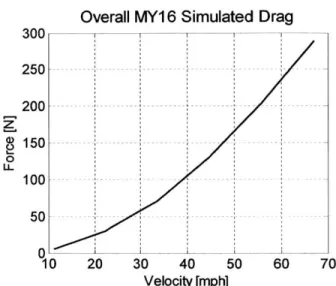
In order to temporarily quantify the aerodynamic drag of the entire vehicle, SolidWorks flow simulation was used. This is important as it tended to be closer to experimental values of the rear wing assembly, so should provide a better estimate of the aerodynamic drag MYl6 will experience. In order to get the results, the entire car assembly was run at different speeds, at standard atmospheric temperatures and pressure. Figure 3 below shows the results with a driver who is six foot, five inches tall; FSAE rules state that any car has to be capable of accommodating a driver of this size.
Overall MY1 6 Simulated Drag 300 250 200 150 0 UL-100 50 0 10 20 30 40 50 60 Velocity [mph]
Figure 3: Results of SolidWorks Simulation of the a
drag of the full MY16 car assembly
70
erodynamic
Figure 3 shows significant drag forces that can greatly influence the car's ability to complete endurance, and the torque output requirement to continue at the same speed. The problem with relying solely on simulation is that it doesn't encompass the pitching of the frame, which alters the angle of attack.
2.3 Quantifying System Losses
The losses of the system depend on both drag and aerodynamics. Determining one independent of the other becomes quite difficult. Typically, losses such as friction are independent of velocity; whereas aerodynamic losses are heavily dependent on velocity. Yet, as the speed increases the aerodynamic effects of the car, the fictional losses also increase due to the change in normal force.
So, in order to determine losses experimentally, one needs a pitot tube, or an idea of the wind speed for the direction the car will be driving. An idea of temperature and pressure in the area provides the ability to determine the density of air while testing. The main data during testing will be front wheel speeds, which provide knowledge of the velocity of the car. Shock position would also be helpfil, if one wished to quantify how the angle of attack was changing.
After the initial variables are able to be determined and the system that collects experimental data set up, the car should be sped up to a constant velocity. After coasting for a short distance, the driver can then remove his or her foot from the throttle, and let the car slow down naturally (avoid any driver inputs).
This should result in a parabolic graph of the car's speed that illustrates the decrease of velocity over time. The change in velocity is related to the superposition of the linear component of frictional losses and the exponential component of the aerodynamic losses. From these data, the force required to compensate for system losses can be calculated and used to better determine the requirements of the powertrain for future cars.
3.0 Powertrain Requirements
The characterization of the losses of the system should be merged with the general requirements of the system. Now that an approximation of the losses has be quantified, it is time to look at what the powertrain needs to be able to accomplish to be competitive at the FSAE Electric competition. From this analysis, a better idea of the motor and drivetrain can be determined, in order to optimally design the system for MYl 7.
3.1 FSAE Rules
The FSAE Electric division publishes a document of rules every year that is just under two-hundred pages long. The rules listed in this document drive a large portion of the design decisions for the team and help improve driver safety. Whatever motor and drivetrain system is designed will have to be rules compliant.
The motor can be water or oil cooled, but any other additives are strictly prohibited. Any type of electrical motor is allowed and the number is not limited. It must be outfitted with a structural casing, and if the casing rotates, that must be protected with a scatter shield. This means that two motors would then require two shields, which adds slightly to the total weight of the vehicle. Outboard wheel motors are also allowed, but require certain extra safety features [2].
The maximum power drawn from the battery cannot be greater than 80kW total, which is independent on the number of motors. "The maximum permitted voltage that may occur between any two electrical connections" is 300 VDC [2]. All of these rules and regulations need to be met for whichever motor is chosen.
3.2 Torque
There is a lower limit of the torque required in order to move the car. Ignoring system loss, the torque required by the rear wheels can be quantified from Equation 2a, where a is the acceleration of the car, M, is the mass of the car with a driver, and Rire is the radius of the tire. This is the torque for a high acceleration which tends to occur at lower speeds.
(2a)
T = a - Mc - Rtire
The mass of a 560 pound (254 kg) car and 220 pound (100 kg) person, to accommodate for a ninety-fifth percentile male, sum to a total mass of 770 pounds (355 kg) that will be split between two wheels. The radius of the tires is 10 inches (0.254 in). And the team wants the car to be capable of 1.5g (14.7m/s2) acceleration. This is at higher speeds where are aerodynamic downforce allows a no-slip assumption. Applying these numbers gives the below torque of the rear wheels.
(2b) m
Twheels = (14.7 -) -(355kg) - (0.254m) = 1326Nm
S
This means that each tire needs to be capable of exerting 663Nm of torque, if the car is solely rear wheel drive like the MIT Motorsports car and other losses are being ignored. This torque can be slightly altered with gear ratios. This torque would just be the initial maximum acceleration, and would typically sit at a lower level for minor adjustments while driving instead of maximum acceleration. Therefore, this only needs to correlate with the maximum torque of the motors, and not the continuous torque.
However, another note is that one can choose a lightweight driver for the events that need the larger acceleration. So if a 140 pound person was driving instead of a 220 pound person, the maximum torque requirement would be around 612Nm instead of 663Nm. For this type of vehicle, the overall characteristics can change very fluidly with the weight of the driver; this is because the weight of the driver is a significant portion of the weight of the car itself.
3.3 Speed
The FSAE competition is composed of a variety of dynamic events: acceleration, skid-pad, autocross, efficiency, and endurance. The average speed for autocross is intended to be from 25 to 30mph. The longest straightaway in these courses is 77m according to competition design and occurs during endurance [2]. Approximately half of this distance, would be spent accelerating, while the other portion would be spent slowing down before the next turn, which is how d is determined.
Therefore, if our car is at an initial speed of 7m/s from a prior turn, and the acceleration is assumed to be as described above, then the maximum velocity can be calculated. This velocity does not have to be the maximum velocity of the car in general, but instead describes what it needs to be capable of to do well at competition. Equation 3 shows this relationship.
(3a)
Vf = v + 2 -a - d
Adding in the values described above gives the maximum velocity experienced during competition. Torque is assumed relatively constant for these motors.
(3b)
S (7-)2 + 2 (14.7 - (38.5m) = 34.4m/s
S S
This value transitions to about 77 miles per hour, if acceleration stays nearly constant. This information can then be taken and compared to potential torque-speed curves of different
available motors to help determine the best motor for the car. This number is likely higher than necessary, as the power limits FSAE enforce and other obstacles would prevent maximum velocity, but it is still a good starting point.
A lot of the motor specifications describe rpm instead of vehicle velocity. So in order to determine the wheel rpm, one can use the below equation, where v is the velocity of the vehicle. RPM is an angular speed that stands for revolutions per minute.
(4)
60 -v 60 - 34.4m/s rev
RPMwheel = = = 1293
-2 -ir -Rtire 2 -7r -0.254m S
All of these calculations are ignoring system losses. However, with aerodynamic drag at 30m/s,
the car has an added negative force of approximately 290N, which requires approximately 77Nm extra torque for a total of 744Nm required per rear tire between the inefficiencies and the acceleration requirement.
3.4 IP Standards
Ingress Protection, or IP, is one way of rating the seal on certain electrical objects. The first number of an IP rating describes it's resistance to solid objects and the second describes its resistance to liquids, with a higher number corresponding to a better rating. An IP rating greater than IP44 is preferred for this case, with any higher numbers a great addition. This rating is important for both the lifetime of the motor and for passing the splash test at competition. The splash test is where judges have water rain over the car for 120 seconds then the car rests and still has to work afterwards [2].
4.0 Potential Motors
As the FSAE rules are not really strict for selecting motors, the main considerations when selecting the motor will be torque and speed requirements.
4.1 EMRAX 228
The MYl6 is currently driven by 2 EMRAX 228 motors. Each motor independently drives one rear wheel.
There is an option for an IP65 for a liquid cooled system, with a weight of 12.3kg each. Peak motor power is 100kW, with continuous power between twenty-eight and forty-two kilowatts. Maximum rotational speed is 5500RPM. The motor is 93-98 percent efficient. The continuous torque for this motor is 125Nm with a maximum torque of 240Nm [3].
120,00
IfAn An
EMRAX 228 High Voltage
LC
360 80,00 .. c Peak torque ~ 0,00 0. 4 0 1 0 0 0 0 0 0 3 0 0 4 0 0 5 0 0
r
0 Motor speed (rpm]Note 1: for determening peak or contireuous power (kW) you should choose motor speed and than read power from chosen power curve (in the left graph side)
Note 2: for determening peak or continuous torque (Nm) you should choose motor speed and than read torque from chosen torque curve (in the right graph side)
Figure 4: This plot shows the power, torque, and speed relationships for an EMRAX 228 motor [3].
Figure 4 shows that the EMRAX 228 stays at a relatively consistent continuous motor torque of 120Nm through the entire range of rpm, slightly dropping off when rpm is less than 1000 or greater than 4000. Power consumption logically increases with higher rpms. The fact that the torque remains relatively stable can be a good benefit of using these motors.
As a maximum torque of 744Nm is ideal, for this motor to have adequate torque, a gear ratio of 3.1:1 would be adequate. This ratio would result in a maximum wheel RPM of 1613 which is above the specification from Equation 4. This motor will have to be limited electronically to meet the power consumption FSAE rules.
4.2 EMRAX 207
The EMRAX 207 is a smaller version of the motors MIT FSAE is using currently. These motors weight 9.4kg, saving 2.9kg, or 6.4 lbs, each. This means the car would only require 725Nm per rear tire instead of 744Nm. There is the potential for greater weight savings down the line from this too, because all of the unsprung systems also have to support less weight.
It also has the IP65 rating, and 93-98 percent efficiency. The peak motor power is 80kW and continuous is 20-32kW. The maximum RPM is higher than the 228 with a 6000RPM rating. Continuous motor torque is 8ONm with 160Nm peak motor torque [3].
6 C -u -U 6 0 0. 70,00
.J LEM RAX 207 High Vodta ge
LC60,00 Peak powe& 50,00 - . Peak torqjue ^ 40,00 30,00 Cohnmt s power 20,00 ji 0 ADD0 2000 3000 4000 5000 600 160 140 120 100 0 0 40 20 z C Motor speed [rpm]
Note 1: for determenng peak or continuous power (kW) you shoud choose motor speed and than read power from chosen power curve
(i the left graph side,
Note 2: for determening peak or continuous torque (Nm) you should cheose motor speed and than read torque from chosen torque curve
On the right graph side)
Figure 5: This plot shows the power, torque, and speed relationships for an EMRAX 207 motor [3].
Figure 5 shows lower power consumption on average than the EMRAX 228, rising just above 30kW at RPMs greater than 4000. The torque characteristics behave similarly to the 228, staying relatively level throughout.
For this motor to have adequate torque for a lighter person, the car would need a gear ratio of
4.5:1. With this gear ratio, the maximum RPM of the wheel would be 1333, which is slightly
higher than that required for the car to travel at 34.4m/s.
4.3 YASA 400
The YASA 400 is a larger motor that would have to be used with a limited slip differential in order to have a similar weight. This motor weighs 24kg, has a continuous torque of 250Nm with a peak of 360Nm. It has a continuous power of 50 to 70kW with average efficiency greater than 95 percent. The coolant for this motor is oil and the maximum rpm is 7500 [4].
YASA-400
Max Torque/Power versus speed
400 100 z CV 350 300 - Tmax @200V --Tmax @ 250V1 250 Tmax @300V1 -Tmax@350V! 200 - Tmax @400V /I 150 - Pmax@200Vi - -Pmax @250V 100 Pmax @300V
Pmax @350V1 Motor temperature. 65 degC
so I 4
ma 00VjMax current:z 400 Arms~
0 1000 2000 3000 4000
Speed (rpm)
Figure 6: This plot shows the power, torque, and speed relationships for a YASA
75 50 25 0 5000 400 motor [4].
Figure 6 illustrates the torque, power, and speed curves of this motor. The maximum voltage according to FSAE rules is 300 volts so that is the curve that is important.
One of these motors is approximately the weight of two of the current, EMRAX 228, motors so torque requirements should be similar. In order to achieve the torque required for maximum acceleration, a gear ratio of at least 4.6:1 would be needed for a ninety-fifth percentile person. This does not allow an rpm that satisfies the prior requirements. One thing to note is that the maximum rpm would not occur at the same time as the maximum torque due to the standard torque-speed curves. This means that the 4500RPM can be used in combination with the gear ratio to determine the maximum RPM. Using a lighter person and optimizing along the curve, leads to a gear ratio of 3.3:1. This results in a maximum RPM of 1364, which is above that necessary to achieve the desired maximum speed.
4.4 One Motor Versus Two Motors
Each team can use however many motors they desire. If a team decides to use one motor, there will be additional weight from the limited slip differential, LSD, but then only one motor is required. The added benefit of having two motors is that one can optimize the system in ways having a LSD doesn't permit, such as with torque vectoring. Having this flexibility allows the car to be more agile, therefore increasing the potential of lower lap times. In the past electric cars, MIT Motorsports has used two motors due to the increased flexibility for optimizing the vehicle.
4.5 Which Motor
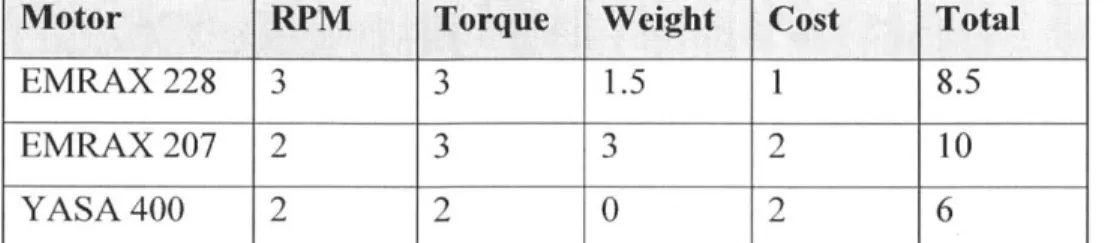
In order to do an analysis for determining the best motor, each option will be ranked on a scale from 0 to 3 with 3 being the best. This chart is assuming the use of two motors. RPM and torque are important parameters to consider as if the motor is incapable of meeting or surpassing the related requirements, then the car will not be as competitive as possible. Weight is an important parameter as lighter cars perform better. Finally, as this will take away from the team's budget so cost is also a priority.
The motor with the highest rpm is the EMRAX 228, after the necessary gear reductions to accommodate for torque. The two EMRAX motors have better torque characteristics, as the YASA's torque decays greatly with speed. The lightest system is the EMRAX 207, with the
YASA 400 exhibiting a weight double that of the EMRAX 228. These characteristics combine to form the chart below.
Motor RPNI Torque Weight Cost Total
EMRAX228 3 3 1.5 1 8.5
EMRAX 207 2 3 3 10
YASA 400 2 2 0 2 6
Table 2: Comparison chart to determine the best motor choice for the team, with three being the best
possible score.
From this chart, the EMRAX 207 would be the best choice for the next MIT Motorsports car if two motors are being used. However, if only one motor were to be used, the only motor that meets the necessary force requirements is the ENRAX 228 as achieving the necessary speed with the YASA would not work with the required gear ratio to accomplish a 1.5g acceleration at higher speeds. It can work, but would not be optimal. Another reason to not over build this system is to increase the competitiveness of the cost portion; each kW can add to the cost, so there needs to be a balance between that required for performance and increase the cost of our vehicle for the static cost event. Having experience with the EMRAX motors and controllers is an added benefit as well.
5.0 Drivetrain
There are three types of potential drivetrains to use: chain, planetary gears, or belts. In order to determine the best system for MY 17, each option should be analyzed. Our team's experience
leads chains to be preference over belts, so analysis of chains will take priority.
5.1 Chiain Versus Planetary Gears
The weight of the current chain and sprocket system is around 3.2kg. It's difficult to quantify the weight of a system that has yet to be designed and tested, which makes it a poor tactor for choosing between systems. However, the current system is lightweight enough to be a good baseline for future design.
The planetary gear system has the benefit of taking up less space. It therefore allows for fewer frame tubes, which lowers the weight and reduces the frame size. However, the planetary gear system would also be new to the team, and difficult to design. There would be added complexity from the small assembly and the availability of light weight components.
Efficiency of both systems tends to be similar. Each gear interface is expected to lower the efficiency by about two percent, so a planetary gear system would be expected to have efficiency around 92-94 percent. The efficiency of chains tends to be between 92-96 percent. These efficiencies are very similar, so will not impact the decision between planetary gears and chains drives.
Another note is that gear drives tend to be louder than chain, due to meshing and other such effects. With all of these considerations, the best system for the MIT Motorsports team to go with next semester would be a chain drive.
6.0 Conclusion
There are many factors that come together when determining the components for an FSAE powertrain. After determining the requirements of the system, and looking at the benefits and disadvantages of different motors, two EMRAX 207 motors would be a good solution for the MIT Motorsports team. This motor meets all of FSAE rules, is light-weight, and meets the performance goals of the team. These motors would be best independently driven by a chain drive, so added benefits of torque vectoring can be utilized. In the future, further testing of the car would be ideal to better characterize some minor aspects of the system.
7.0 Bibliography
[1] Kurtus, Ron. "Rolling Friction." School For Champions, 30 July 2015. Web. 06 Mar. 2016. [2] "2015 Formula SAE@ Rules." from
http://www.fsaeonline.com/content/2015-16%20FSAE%2ORules%20revision%2091714%2Okz.pdf.
[3] "EMRAX Motors." from http://www.enstroj.si/Electric-products/emrax-motors.html [4] "YASA-400." from http://www.yasamotors.com/products/yasa-400/


![Figure 4: This plot shows the power, torque, and speed relationships for an EMRAX 228 motor [3].](https://thumb-eu.123doks.com/thumbv2/123doknet/13947097.452070/17.918.132.742.428.821/figure-shows-power-torque-speed-relationships-emrax-motor.webp)
![Figure 5: This plot shows the power, torque, and speed relationships for an EMRAX 207 motor [3].](https://thumb-eu.123doks.com/thumbv2/123doknet/13947097.452070/18.918.147.737.606.972/figure-shows-power-torque-speed-relationships-emrax-motor.webp)