arXiv:0802.0050v2 [hep-ex] 5 Feb 2008
Dilepton mass spectra in p+p collisions at
√
s
= 200 GeV and the contribution from open
charm
A. Adare,
hS. Afanasiev,
vC. Aidala,
iN.N. Ajitanand,
avY. Akiba,
ap,aqH. Al-Bataineh,
akJ. Alexander,
avK. Aoki,
aa,apL. Aphecetche,
ayR. Armendariz,
akS.H. Aronson,
cJ. Asai,
aqE.T. Atomssa,
abR. Averbeck,
awT.C. Awes,
alB. Azmoun,
cV. Babintsev,
rG. Baksay,
nL. Baksay,
nA. Baldisseri,
kK.N. Barish,
dP.D. Barnes,
adB. Bassalleck,
ajS. Bathe,
dS. Batsouli,
alV. Baublis,
aoA. Bazilevsky,
cS. Belikov,
c 1R. Bennett,
awY. Berdnikov,
asA.A. Bickley,
hJ.G. Boissevain,
adH. Borel,
kK. Boyle,
awM.L. Brooks,
adH. Buesching,
cV. Bumazhnov,
rG. Bunce,
c,aqS. Butsyk,
ad,awS. Campbell,
awB.S. Chang,
bfJ.-L. Charvet,
kS. Chernichenko,
rJ. Chiba,
wC.Y. Chi,
iM. Chiu,
sI.J. Choi,
bfT. Chujo,
bcP. Chung,
avA. Churyn,
rV. Cianciolo,
alC.R. Cleven,
pB.A. Cole,
iM.P. Comets,
amP. Constantin,
adM. Csan´ad,
mT. Cs¨org˝o,
yT. Dahms,
awK. Das,
oG. David,
cM.B. Deaton,
aK. Dehmelt,
nH. Delagrange,
ayA. Denisov,
rD. d’Enterria,
iA. Deshpande,
aq,awE.J. Desmond,
cO. Dietzsch,
atA. Dion,
awM. Donadelli,
atO. Drapier,
abA. Drees,
awA.K. Dubey,
beA. Durum,
rV. Dzhordzhadze,
dY.V. Efremenko,
alJ. Egdemir,
awF. Ellinghaus,
hW.S. Emam,
dA. Enokizono,
acH. En’yo,
ap,aqS. Esumi,
bbK.O. Eyser,
dD.E. Fields,
aj,aqM. Finger,
e,vM. Finger, Jr.,
e,vF. Fleuret,
abS.L. Fokin,
zZ. Fraenkel,
beJ.E. Frantz,
awA. Franz,
cA.D. Frawley,
oK. Fujiwara,
apY. Fukao,
aa,apT. Fusayasu,
aiS. Gadrat,
aeI. Garishvili,
azA. Glenn,
hH. Gong,
awM. Gonin,
abJ. Gosset,
kY. Goto,
ap,aqR. Granier de Cassagnac,
abN. Grau,
uS.V. Greene,
bcM. Grosse Perdekamp,
s,aqT. Gunji,
gH.˚
A. Gustafsson,
afT. Hachiya,
qA. Hadj Henni,
ayC. Haegemann,
ajJ.S. Haggerty,
cH. Hamagaki,
gR. Han,
anH. Harada,
qE.P. Hartouni,
acK. Haruna,
qE. Haslum,
afR. Hayano,
gM. Heffner,
acT.K. Hemmick,
awT. Hester,
dX. He,
pH. Hiejima,
sJ.C. Hill,
uR. Hobbs,
ajM. Hohlmann,
nW. Holzmann,
avK. Homma,
qB. Hong,
yT. Horaguchi,
ap,baD. Hornback,
azT. Ichihara,
ap,aqK. Imai,
aa,apM. Inaba,
bbY. Inoue,
ar,apD. Isenhower,
aL. Isenhower,
aM. Ishihara,
apT. Isobe,
gM. Issah,
avA. Isupov,
vB.V. Jacak,
aw 2J. Jia,
iJ. Jin,
iO. Jinnouchi,
aqB.M. Johnson,
cK.S. Joo,
ahD. Jouan,
amF. Kajihara,
gS. Kametani,
g,bdN. Kamihara,
apJ. Kamin,
awM. Kaneta,
aqJ.H. Kang,
bfH. Kanou,
ap,baD. Kawall,
aqA.V. Kazantsev,
zA. Khanzadeev,
aoJ. Kikuchi,
bdD.H. Kim,
ahD.J. Kim,
bfE. Kim,
auE. Kinney,
hA. Kiss,
mE. Kistenev,
cA. Kiyomichi,
apJ. Klay,
acC. Klein-Boesing,
agL. Kochenda,
aoV. Kochetkov,
rB. Komkov,
aoM. Konno,
bbD. Kotchetkov,
dA. Kozlov,
beA. Kr´al,
jA. Kravitz,
iJ. Kubart,
e,tG.J. Kunde,
adN. Kurihara,
gK. Kurita,
ar,apM.J. Kweon,
yY. Kwon,
az,bfG.S. Kyle,
akR. Lacey,
avY.-S. Lai,
iJ.G. Lajoie,
uA. Lebedev,
uD.M. Lee,
adM.K. Lee,
bfT. Lee,
auM.J. Leitch,
adM.A.L. Leite,
atB. Lenzi,
atT. Liˇska,
jA. Litvinenko,
vM.X. Liu,
adX. Li,
fB. Love,
bcD. Lynch,
cC.F. Maguire,
bcY.I. Makdisi,
cA. Malakhov,
vM.D. Malik,
ajV.I. Manko,
zY. Mao,
an,apL. Maˇsek,
e,tH. Masui,
bbF. Matathias,
iM. McCumber,
awP.L. McGaughey,
adY. Miake,
bbP. Mikeˇs,
e,tK. Miki,
bbT.E. Miller,
bcA. Milov,
awS. Mioduszewski,
cM. Mishra,
bJ.T. Mitchell,
cM. Mitrovski,
avA. Morreale,
dD.P. Morrison,
cT.V. Moukhanova,
zD. Mukhopadhyay,
bcJ. Murata,
ar,apS. Nagamiya,
wY. Nagata,
bbJ.L. Nagle,
hM. Naglis,
beI. Nakagawa,
ap,aqY. Nakamiya,
qT. Nakamura,
qK. Nakano,
ap,baJ. Newby,
acM. Nguyen,
awB.E. Norman,
adA.S. Nyanin,
zE. O’Brien,
cS.X. Oda,
gC.A. Ogilvie,
uH. Ohnishi,
apH. Okada,
aa,apK. Okada,
aqM. Oka,
bbO.O. Omiwade,
aA. Oskarsson,
afM. Ouchida,
qK. Ozawa,
gR. Pak,
cD. Pal,
bcA.P.T. Palounek,
adV. Pantuev,
awV. Papavassiliou,
akJ. Park,
auW.J. Park,
yS.F. Pate,
akH. Pei,
uJ.-C. Peng,
sH. Pereira,
kV. Peresedov,
vD.Yu. Peressounko,
zC. Pinkenburg,
cM.L. Purschke,
cA.K. Purwar,
adH. Qu,
pJ. Rak,
ajA. Rakotozafindrabe,
abI. Ravinovich,
beK.F. Read,
al,azS. Rembeczki,
nM. Reuter,
awK. Reygers,
agV. Riabov,
aoY. Riabov,
aoG. Roche,
aeA. Romana,
ab 1M. Rosati,
uS.S.E. Rosendahl,
afP. Rosnet,
aeP. Rukoyatkin,
vV.L. Rykov,
apB. Sahlmueller,
agN. Saito,
aa,ap,aqT. Sakaguchi,
cS. Sakai,
bbH. Sakata,
qV. Samsonov,
aoS. Sato,
wS. Sawada,
wJ. Seele,
hR. Seidl,
sV. Semenov,
rR. Seto,
dD. Sharma,
beI. Shein,
rA. Shevel,
ao,avT.-A. Shibata,
ap,baK. Shigaki,
qM. Shimomura,
bbK. Shoji,
aa,apA. Sickles,
awC.L. Silva,
atD. Silvermyr,
alC. Silvestre,
kK.S. Sim,
yC.P. Singh,
bV. Singh,
bS. Skutnik,
uM. Sluneˇcka,
e,vA. Soldatov,
rR.A. Soltz,
acW.E. Sondheim,
adS.P. Sorensen,
azI.V. Sourikova,
cF. Staley,
kP.W. Stankus,
alE. Stenlund,
afM. Stepanov,
akA. Ster,
xS.P. Stoll,
cT. Sugitate,
qC. Suire,
amJ. Sziklai,
xT. Tabaru,
aqS. Takagi,
bbE.M. Takagui,
atA. Taketani,
ap,aqY. Tanaka,
aiK. Tanida,
ap,aqM.J. Tannenbaum,
cA. Taranenko,
avP. Tarj´an,
lT.L. Thomas,
ajM. Togawa,
aa,apA. Toia,
awJ. Tojo,
apL. Tom´aˇsek,
tH. Torii,
apR.S. Towell,
aV-N. Tram,
abI. Tserruya,
beY. Tsuchimoto,
qC. Vale,
uH. Valle,
bcH.W. van Hecke,
adJ. Velkoˇska,
bcR. Vertesi,
lA.A. Vinogradov,
zM. Virius,
jV. Vrba,
tE. Vznuzdaev,
aoM. Wagner,
aa,apD. Walker,
awX.R. Wang,
akY. Watanabe,
ap,aqJ. Wessels,
agS.N. White,
cD. Winter,
iC.L. Woody,
cM. Wysocki,
hW. Xie,
aqY.L. Yamaguchi,
bdA. Yanovich,
rZ. Yasin,
dJ. Ying,
pS. Yokkaichi,
ap,aqG.R. Young,
alI. Younus,
ajI.E. Yushmanov,
zW.A. Zajc,
iO. Zaudtke,
agC. Zhang,
alS. Zhou,
fJ. Zim´anyi,
x 1andL. Zolin
v(PHENIX Collaboration)
aAbilene Christian University, Abilene, TX 79699, USA
bDepartment of Physics, Banaras Hindu University, Varanasi 221005, India cBrookhaven National Laboratory, Upton, NY 11973-5000, USA dUniversity of California - Riverside, Riverside, CA 92521, USA eCharles University, Ovocn´y trh 5, Praha 1, 116 36, Prague, Czech Republic fChina Institute of Atomic Energy (CIAE), Beijing, People’s Republic of China gCenter for Nuclear Study, Graduate School of Science, University of Tokyo, 7-3-1
Hongo, Bunkyo, Tokyo 113-0033, Japan hUniversity of Colorado, Boulder, CO 80309, USA
iColumbia University, New York, NY 10027 and Nevis Laboratories, Irvington, NY 10533, USA
jCzech Technical University, Zikova 4, 166 36 Prague 6, Czech Republic kDapnia, CEA Saclay, F-91191, Gif-sur-Yvette, France
ℓDebrecen University, H-4010 Debrecen, Egyetem t´er 1, Hungary mELTE, E¨otv¨os Lor´and University, H - 1117 Budapest, P´azm´any P. s. 1/A,
Hungary
nFlorida Institute of Technology, Melbourne, FL 32901, USA oFlorida State University, Tallahassee, FL 32306, USA
pGeorgia State University, Atlanta, GA 30303, USA
qHiroshima University, Kagamiyama, Higashi-Hiroshima 739-8526, Japan rIHEP Protvino, State Research Center of Russian Federation, Institute for High
Energy Physics, Protvino, 142281, Russia
sUniversity of Illinois at Urbana-Champaign, Urbana, IL 61801, USA tInstitute of Physics, Academy of Sciences of the Czech Republic, Na Slovance 2,
182 21 Prague 8, Czech Republic uIowa State University, Ames, IA 50011, USA
vJoint Institute for Nuclear Research, 141980 Dubna, Moscow Region, Russia wKEK, High Energy Accelerator Research Organization, Tsukuba, Ibaraki
305-0801, Japan
xKFKI Research Institute for Particle and Nuclear Physics of the Hungarian Academy of Sciences (MTA KFKI RMKI), H-1525 Budapest 114, POBox 49,
Budapest, Hungary
yKorea University, Seoul, 136-701, Korea
zRussian Research Center “Kurchatov Institute”, Moscow, Russia aaKyoto University, Kyoto 606-8502, Japan
abLaboratoire Leprince-Ringuet, Ecole Polytechnique, CNRS-IN2P3, Route de Saclay, F-91128, Palaiseau, France
acLawrence Livermore National Laboratory, Livermore, CA 94550, USA adLos Alamos National Laboratory, Los Alamos, NM 87545, USA aeLPC, Universit´e Blaise Pascal, CNRS-IN2P3, Clermont-Fd, 63177 Aubiere
Cedex, France
afDepartment of Physics, Lund University, Box 118, SE-221 00 Lund, Sweden agInstitut f¨ur Kernphysik, University of Muenster, D-48149 Muenster, Germany
ahMyongji University, Yongin, Kyonggido 449-728, Korea
ajUniversity of New Mexico, Albuquerque, NM 87131, USA akNew Mexico State University, Las Cruces, NM 88003, USA aℓOak Ridge National Laboratory, Oak Ridge, TN 37831, USA
amIPN-Orsay, Universite Paris Sud, CNRS-IN2P3, BP1, F-91406, Orsay, France anPeking University, Beijing, People’s Republic of China
aoPNPI, Petersburg Nuclear Physics Institute, Gatchina, Leningrad region, 188300, Russia
apRIKEN, The Institute of Physical and Chemical Research, Wako, Saitama 351-0198, Japan
aqRIKEN BNL Research Center, Brookhaven National Laboratory, Upton, NY 11973-5000, USA
arPhysics Department, Rikkyo University, 3-34-1 Nishi-Ikebukuro, Toshima, Tokyo 171-8501, Japan
asSaint Petersburg State Polytechnic University, St. Petersburg, Russia atUniversidade de S˜ao Paulo, Instituto de F´ısica, Caixa Postal 66318, S˜ao Paulo
CEP05315-970, Brazil
auSystem Electronics Laboratory, Seoul National University, Seoul, Korea avChemistry Department, Stony Brook University, Stony Brook, SUNY, NY
11794-3400, USA
awDepartment of Physics and Astronomy, Stony Brook University, SUNY, Stony Brook, NY 11794, USA
aySUBATECH (Ecole des Mines de Nantes, CNRS-IN2P3, Universit´e de Nantes) BP 20722 - 44307, Nantes, France
azUniversity of Tennessee, Knoxville, TN 37996, USA
baDepartment of Physics, Tokyo Institute of Technology, Oh-okayama, Meguro, Tokyo 152-8551, Japan
bbInstitute of Physics, University of Tsukuba, Tsukuba, Ibaraki 305, Japan bcVanderbilt University, Nashville, TN 37235, USA
bdWaseda University, Advanced Research Institute for Science and Engineering, 17 Kikui-cho, Shinjuku-ku, Tokyo 162-0044, Japan
beWeizmann Institute, Rehovot 76100, Israel bfYonsei University, IPAP, Seoul 120-749, Korea
Abstract
PHENIX has measured the electron-positron pair mass spectrum from 0 to 8 GeV/c2 in p+p collisions at √s = 200 GeV. The contributions from light meson decays to e+e− pairs have been determined based on measurements of hadron production cross sections by PHENIX. They account for nearly all e+e− pairs in the mass
region below ∼1 GeV/c2. The e+e− pair yield remaining after subtracting these contributions is dominated by semileptonic decays of charmed hadrons correlated through flavor conservation. Using the spectral shape predicted by PYTHIA, we estimate the charm production cross section to be 544 ± 39(stat) ± 142(syst) ± 200(model) µb, which is consistent with QCD calculations and measurements of single leptons by PHENIX.
Because of the large mass of the charm quark, approximately 1.3 GeV/c2, it is
commonly expected that the charm production cross section can be calculated in quantum chromo dynamics (QCD) using perturbative methods (pQCD). Comparing such calculations with experimental data serves as a test of pQCD and helps to quantify the importance of higher order terms. Perturbative cal-culations suggest that charm production at RHIC energies results primarily from gluon fusion, so charm can probe gluonic interactions in the matter formed in heavy ion collisions at RHIC [1]. Medium modifications of heavy quark production and the suppression of bound charmonium states like the J/ψ have received considerable attention and are thought to be keys to bet-ter understanding properties of strongly inbet-teracting matbet-ter. Experiments at RHIC with polarized proton beams will allow the measurement of spin asym-metries in charm production, which gives access to the spin contribution of the gluons to the proton in a new channel [2].
To date, charm production has been calculated in next-to-leading-order (NLO) and fixed-order plus next-to-leading-log approximations (FONLL) [3]. These calculations are consistent with the measured D meson cross sections in 1.96
TeV p¯p collisions published by CDF [4] as well as with single lepton
measure-ments, electrons [5] and muons [6], in 200 GeV p+p collisions from PHENIX. However, the theoretical uncertainties are considerable, at least a factor of two [3] or even larger [7], and the data prefer larger cross sections within these
uncertainties3. In this Letter we present a different method to determine the
charm cross section using electron-positron pairs measured with PHENIX dur-ing the RHIC p+p run in 2005.
Electrons are measured in the two PHENIX central arm spectrometers [10], which each cover |η| ≤ 0.35 in pseudo-rapidity and ∆φ = π/2 in azimuth in a nearly back-to-back configuration. For charged particles drift chambers (DC) measure the deflection angles in a magnetic field to determine their momenta. Ring imaging Cerenkov counters (RICH) as well as electromagnetic calorimeters (EMCal) distinguish electrons from other particles. The electron
1 Deceased
2 PHENIX Spokesperson: jacak@skipper.physics.sunysb.edu
3 The STAR collaboration reports an even larger cross section [8,9], which is about a factor of 2-3 above of what can be accommodated in pQCD calculations.
analysis is described in detail in [5].
Two data sets are used in the analysis. A reference sample of events was selected with a minimum bias interaction trigger (MB) that was based on beam-beam counters (BBC). The BBC trigger cross section is 23.0±2.2 mb or 55% of the inelastic p+p cross section. Simulations, and data collected without requiring the BBC trigger, indicate that the triggered events include 79% of events with particles in the central arm acceptance. This number coincides with the fraction of non-diffractive events triggered by the BBC. The bulk of the data sample was recorded requiring a coincidence of the BBC trigger with a single electron trigger (ERT) that matches hits in the RICH to 2x2 trigger tiles in the EMCal with a minimum energy of 400 MeV/c. In the active area the ERT trigger has a very high efficiency for electrons; around 500 MeV/c it reaches approximately 50% and then saturates around 1 GeV/c close to 100%. After applying an interaction-vertex cut of ±30 cm the total
integrated luminosities were 43 nb−1 and 2.25 pb−1 for the MB and ERT
trigger, respectively.
All electrons and positrons with pT > 200 MeV/c are combined into like- and
unlike-sign pairs. For each pair we check that at least one of the tracks was registered by the ERT trigger. The event is rejected if the two tracks of the pair
overlap in any of the detectors; this cut removes 2% of the e+e−pairs. This cut
is necessary to assure that the combinatorial pair background is reproduced from mixed events. Pairs originating from photon conversions in the detector material are removed by a cut on the orientation of the pairs in the magnetic field [11]. Fig. 1 shows the raw yields as a function of pair mass for both like- and unlike-sign pairs. The unlike-sign spectrum measures the signal from hadron decays and open charm plus background, while the like-sign spectrum measures only the background. Due to the different acceptance for like- and unlike-sign pairs the shape of the background is different for the two charge combinations.
We have developed two independent methods to subtract the background. In the first method we decompose the background into two components: a combinatorial background made of uncorrelated pairs and a background of correlated pairs. The combinatorial background is determined from mixed events using the procedure described in more detail in [11,12]. Since our data sample required a single electron trigger the mixed events are generated from the MB sample, with the trigger condition applied to each pair, i.e. one of the tracks must have fired the ERT trigger. The like-sign mixed event background and the measured like-sign pairs do not have the same distribution, which is an indication of a correlated background in the data. However, in the region
roughly corresponding to a mass of 300 MeV/c2, p
T above 400 MeV/c and a
transverse mass mT =
q
m2+ (p
T/c)2 below 1.2 GeV/c2 the distributions are
0 0.5 1 1.5 2 2.5 3 3.5 4 /5 MeV) 2 (c evt counts/N -12 10 -11 10 -10 10 -9 10 -8 10 Like Sign
all like sign pairs combinatorial background correlated pairs
cross pairs (EXODUS) jet pairs (PYTHIA)
) 2 (GeV/c ee m 0 0.5 1 1.5 2 2.5 3 3.5 4 /5 MeV) 2 (c evt counts/N -12 10 -11 10 -10 10 -9 10 -8 10 -7 10 -6 10 Unlike Sign pairs -e + all e combinatorial background correlated pairs
cross pairs (EXODUS) jet pairs (PYTHIA)
Fig. 1. Raw dielectron spectra. The top panel shows like-sign pairs as measured in the experiment, the combinatorial background from mixed events, the correlated pair background obtained by subtracting the combinatorial background, and the individual contributions from cross and jet pairs to the correlated background (see text). The bottom panel shows the same distributions for unlike-sign pairs. The correlated background in both panels is normalized to the measured like-sign pairs remaining after subtracting the combinatorial background.
in this region4. This normalization has a statistical accuracy of 2.4%. After
normalization the data show relatively more yield both at low mass and large
pT as well as at low pT and large mass. By integrating the normalized like-sign
4 The exact region used for the normalization is given by the following four con-ditions m >300 MeV/c2, mT < 1.2 MeV/c2, pT/c − 1.5m ≤ 200 MeV/c2, and pT/c − 0.75m ≥ 150 MeV/c2.
mixed events we determine the number of like-sign background pairs N++and
N−−, which then give the normalization of the unlike-sign mixed events as
2√N++N−−.
The mixed event backgrounds as well as the distributions after subtraction are also shown in Fig. 1. The remaining pairs, like and unlike, are consid-ered correlated pairs, where the like-sign distribution only contains correlated background pairs while the unlike contains also the signal. The correlated background pairs stem from two sources. “Cross pairs” result from decays of
single π0 or η mesons with two electron pairs in the final state, such as double
Dalitz decays, Dalitz decays plus conversion of the accompanying photon, and γγ decays where both photons convert. These pairs have a mass lower than
the η mass of 548 MeV/c2. Cross pairs were simulated using our hadron
de-cay generator EXODUS including the PHENIX acceptance [13]. “Jet pairs” are produced by two independent hadron decays yielding electron pairs, ei-ther within the same jet or in the back-to-back jets. Jet pairs were simulated using minimum bias events generated with PYTHIA [14] with the branching
ratio of the π0 Dalitz decay set to 100% to enhance the sample of jet pairs
per event. The resulting e+e− pairs are filtered through the PHENIX
accep-tance. Pairs from mixed events are subtracted from the like- and unlike-sign pair distributions to find the correlated pair distributions. This procedure ex-cludes “signal” such as unlike-sign pairs from a single hadron decay. The mixed event background is normalized by the same method used in the data anal-ysis, described previously. It was found that correlated pairs from the same
jet typically have small mass and large pT while those from back-to-back jets
have large mass and smaller pT . Since the correlated background pairs
pop-ulate like- and unlike-sign combinations equally, their yield was determined by simultaneously fitting simulated cross and jet pair mass distributions to the measured correlated like-sign pair mass spectrum. The resulting two nor-malization factors, one for cross- the other for jet-pairs, are then applied to the unlike-sign correlated background. Contributions of both correlated back-ground sources are also shown in Fig. 1. The signal is extracted by subtracting the unlike-sign correlated backgrounds from the distribution of all correlated pairs.
In our second method we make no assumptions about the shape of the cor-related background nor about the decomposition of corcor-related and uncorre-lated background. The measured like-sign distribution is corrected for the acceptance difference between like- and unlike-sign pairs, i.e. the ratio of the
acceptance, binned in pT and mass, of unlike- to like-sign pairs. Since the
acceptance is a function of mass and pT, we have checked that for different
e+e− pair sources, which span reasonable variations in mass and p
T shapes of
the e+e− pairs, the relative acceptance is unchanged. The corrected like-sign
distribution is then subtracted from the unlike-sign pairs. Up to 3.5 GeV/c2
(GeV/c)
Tp
0
2
4
6
8
10
)
3c
-2(mbarn GeV
3/dp
σ
3E d
-810
-710
-610
-510
-410
-310
-210
-110
1
10
210
310
410
= 200 GeV
s
p + p at
50
×
π
10
×
η
10
×
±K
ω
1/3
×
φ
ψ
J/
γ
γ
→
0π
±π
γ
γ
→
η
-π
+π
0π
→
η
±K
-π
+π
0π
→
ω
0π
γ
→
ω
e
+e
→
ψ
J/
Fig. 2. Compilation of meson production cross sections in p+p collisions at √s =200 GeV. Shown are data for neutral [17] and charged pions [18], η [19], Kaons [18], ω [20], and J/ψ [22]. The data are compared to the parameterization based on mT scaling used in our hadron decay generator.
tion techniques agrees to better than ±10%. Above 3.5 GeV/c the difference becomes much larger, which may indicate additional correlated background. In this region we subtract the measured like-sign yield, the larger of our two background estimates, and include the difference of the two methods as asym-metric systematic uncertainty on the signal yield.
In the next step the signal is corrected for electron reconstruction efficiency and trigger efficiency. The electron reconstruction efficiency was determined with a Monte Carlo simulation of the PHENIX detector (similar to [12]). The
trigger efficiency for single electrons was measured using the MB sample. For each of the 8 calorimeter sectors we determine the ratio of electrons that
fired the ERT trigger to all electrons reconstructed as function of pT. Pairs
from hadron decays simulated with EXODUS are filtered by the acceptance and then folded with the ERT trigger efficiency to extract the pair trigger efficiency as function of mass. At high masses the trigger efficiency saturates
at 72%, limited by the active area of the trigger, from 1.5 to 0.5 GeV/c2 the
pair efficiency gradually drops to 32% and remains approximately constant at lower masses. In addition, the yield is corrected by 0.79/0.55 = 1.44 to account for the fraction of the inelastic p+p cross section missed by our interaction trigger. The systematic uncertainties on the fully corrected spectrum shown in Fig. 3 are summarized in Table 1.
Table 1
Systematic uncertainties of the dilepton yield due to different sources and for different mass ranges. The uncertainties vary with mass and the largest uncertainties are quoted for each mass range. The contribution quoted for the jet pair subtraction also accounts for the difference in the signal observed between our two background subtraction techniques.
<0.4 GeV/c2 0.4-1.1 GeV/c2 1.1-3.5 GeV/c2 >3.5 GeV/c2
minimum bias trigger 11.3% 11.3% 11.3% 11.3%
ERT trigger efficiency 5% 5% 5% 5%
conversion rejection 5% - -
-mixed event background 2% 8% 4%
-cross pair subtraction <1% - -
-jet pair subtraction 2% 3% 11% +70%
reconstruction efficiency 14.4% 14.4% 14.4% 14.4%
total 19.8% 20.8% 22.3% +73%,−19%
We model the e+e− pair contributions from hadron decays using the EXODUS
decay generator. We follow closely the approach given in [5,15], however, we have updated all input to match the most recent PHENIX data. We assume that all hadrons have a constant rapidity density in the range |∆η| ≤ 0.35 and a homogeneous distribution in azimuthal angle. Transverse momentum distri-butions are based on measurements in the same experiment where possible. The key input is the rapidity density dN/dy = 1.06 ± 0.11 of neutral pions, which we determine from a fit to PHENIX data on charged and neutral pions, as shown in Fig. 2. The functional form of the pion transverse momentum distribution is given by:
Ed
3σ
dp3 = A(e
) 2 (GeV/c ee m 0 1 2 3 4 5 6 7 8
/GeV) IN PHENIX ACCEPTANCE
2 (c ee dN/dm evt 1/N -11 10 -10 10 -9 10 -8 10 -7 10 -6 10 -5 10 -4 10 -3 10
p+p at
s
= 200 GeV
DATA |y| < 0.35 > 0.2 GeV/c T p ) 2 (GeV/c ee m 0 1 2 3 4 5 6 7 8/GeV) IN PHENIX ACCEPTANCE
2 (c ee dN/dm evt 1/N -11 10 -10 10 -9 10 -8 10 -7 10 -6 10 -5 10 -4 10 -3 10 ) 2 (GeV/c ee m 0 0.2 0.4 0.6 0.8 1
/GeV) IN PHENIX ACCEPTANCE
2 (c ee dN/dm evt 1/N -7 10 -6 10 -5 10 -4 10 -3 10 π0→γee ee γ → η ee γ → ’ η ee → ρ ee 0 π ee & → ω ee η ee & → φ ee → ψ J/ ee → ’ ψ ee (PYTHIA) → c c ee (PYTHIA) → b b ee (PYTHIA) → DY sum ) 2 (GeV/c ee m 0 0.2 0.4 0.6 0.8 1
/GeV) IN PHENIX ACCEPTANCE
2 (c ee dN/dm evt 1/N -7 10 -6 10 -5 10 -4 10 -3 10
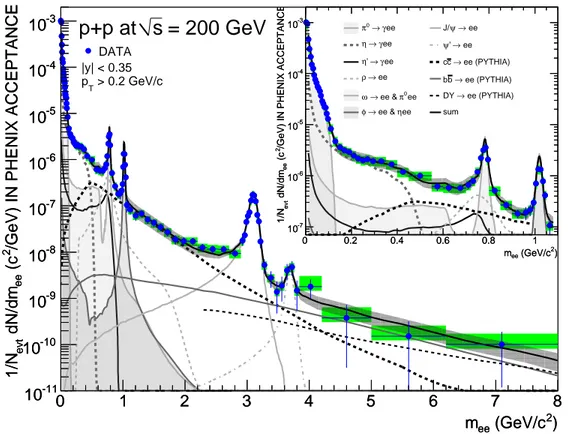
Fig. 3. Electron-positron pair yield per inelastic p+p collision as function of pair mass. Data show statistical (bars) and systematic (shades) errors separately. The yield per event can be converted to a cross section by multiplying with the inelastic p+p cross section of 42.2 mb. The data are compared to a cocktail of known sources. The contribution from hadron decays is independently normalized based on meson measurements in PHENIX, the systematic uncertainties are given by the error band. The contribution from open charm production is fitted to match the data. The inset shows the same data but focuses on the low mass region.
with A = 377±60 mb GeV−2c3, a = 0356±0.014 (GeV/c)−1, b = 0.068±0.019
(GeV/c)−2, p
0 = 0.7±0.02 GeV/c and the power n = 8.25±0.04. For all other
mesons we assume mT scaling, replacing pT by
q
m2− m2
π + (pT/c)2, where m
is the mass of the meson. For the η, ω, φ, and J/ψ we fit a normalization factor to PHENIX data. In Fig. 2 the results are compared to published PHENIX data; excellent agreement with the data is achieved. The η meson is measured
only at higher pT, however, the fit is in good agreement with the pT distribution
of Kaons, which have similar mass.
In order to extract the meson yield per inelastic p+p collision we integrate the
fits over all pT. Results, systematic uncertainties, and references to data are
given in Table. 2. For the ρ meson we assume σρ/σω = 1.15 ± 0.15, consistent
with values found in jet fragmentation [16]. The η′ yield is scaled to be
con-sistent with jet fragmentation ση′/ση = 0.15 ± 0.15 [16]. The ψ′ is adjusted to
the value of σψ′/σJ/ψ = 0.14 ± 0.03 [23]. For the η, ω, φ, and J/ψ the quoted
of the pT distributions to extrapolate to zero pT. Specifically we have fitted
the functional form given in equation 1 with all parameters free and also an
exponential distribution in mT . For the ρ, η′, and ψ′ the uncertainty is given
by the uncertainty we assumed for the cross section ratios. We note that the dilepton spectra from meson decays are rather insensitive to the exact shape
of the pT distribution.
Table 2
Hadron rapidity densities used in our hadron decay generator. For the ω and φ meson data from this analysis were used together with data from the quoted references.
dN
dy|y=0 relative err. data used
π0 1.065 ± 0.11 10% PHENIX [17],[18] η 0.11 ± 0.03 30% PHENIX [19] ρ 0.089 ± 0.025 28% jet fragmentation [16] ω 0.078 ± 0.018 23% PHENIX [20] φ 0.009 ± 0.002 24% PHENIX [21] η′ 0.016 ± 0.016 100% jet fragmentation [16] J/ψ (1.77 ± 0.27) × 10−5 15% PHENIX [22] ψ′ (2.5 ± 0.7) × 10−6 27% [23]
Once the meson yields and pT spectra are known the dilepton spectrum is
given by decay kinematics and branching ratios, which are implemented in our decay generator EXODUS following earlier work published in [5,15]. The branching ratios are taken from the compilation of particle properties in [16].
For the Dalitz decays π0, η, η′ → e+e−γ and the decay ω → e+e−π0 we use
the Kroll-Wada expression [24] with electromagnetic transition form factors measured by the Lepton-G collaboration [25,26]. For the decays of the vector
mesons ρ, ω, φ → e+e− we use the expression derived by Gounaris and Sakurai
[27], extending it to 2 GeV/c2, slightly beyond its validity range. For the J/ψ
and ψ′ → e+e− we use the same expression modified to include radiative
corrections as discussed in [22]. The resulting dilepton spectra are compared to our data in Fig. 3 with the systematic uncertainties shown as a band. They are calculated as a function of mass and are dominated by the uncertainties on the meson yield tabulated in Tab. 2. The uncertainty from the measured
electromagnetic transition form factors, in particular for the ω → e+e−π0
decay, is also included but contributes visibly only in the range around 500
to 600 MeV/c2. Also shown on Fig. 3 are the contributions from open charm
and bottom production, discussed in more detail below, as well as from the Drell-Yan process, which is negligible. The data agree very well with the sum of all known sources.
) 2 (GeV/c ee m 0 1 2 3 4 5 6 7 8
/GeV) IN PHENIX ACCEPTANCE
2 (c ee dN/dm evt 1/N -11 10 -10 10 -9 10 -8 10 -7 10 -6 10 -5 10
= 200 GeV
s
p+p at
DATA - COCKTAIL ee (PYTHIA) → c c ee (PYTHIA) → b b ee (PYTHIA) → DY sum |y| < 0.35 > 0.2 GeV/c T p ) 2 (GeV/c ee m 0 1 2 3 4 5 6 7 8/GeV) IN PHENIX ACCEPTANCE
2 (c ee dN/dm evt 1/N -11 10 -10 10 -9 10 -8 10 -7 10 -6 10 -5 10
Fig. 4. Electron-positron mass distributions from semileptonic decays of heavy flavor, obtained by subtracting the contribution from π0, η, ω, ρ, φ, J/ψ and ψ′ mesons from the inclusive e+e− pair yield. The arrows indicate upper limits (95% CL) in the mass regions where the charm contribution is smaller or comparable to the systematic uncertainties. For all data points statistical error bars and system-atic uncertainty boxes, including data and model contributions, are shown. Also shown are expected contributions from charm, scaled to data, and bottom as well as Drell-Yan.
1.1 GeV/c2 is dominated by semileptonic decays of D and B mesons correlated
through flavor conservation. To determine this contribution we subtract the meson decay cocktail from the dilepton data, the resulting mass spectrum is
shown in Fig. 4. In the PHENIX acceptance the integrated e+e− pair yield
per event from heavy flavor decays in the range from 1.1 to 2.5 GeV/c2 is
4.21 ± 0.28(stat) ± 1.02(syst) ×10−8. The systematic uncertainties are those
tabulated in Tab. 1 plus the uncertainty on the cocktail subtraction. Since the cocktail subtraction is dominated by the high mass end of the broad ρ reso-nance, which is not very well known, we assume 100% systematic uncertainty.
To estimate the rapidity density of c¯c pairs the measured e+e− pair yield is
corrected for the geometrical acceptance, i.e. corrected from requiring both electron and positron within the PHENIX central arm acceptance to having the electron pair within one unit of rapidity at mid-rapidity. It then is
ex-trapolated to zero e+e− pair mass and converted to c¯c using known branching
ratios of semileptonic decays [16]. This correction is model dependent; we used
in the PHENIX acceptance and in the mass range from 1.1 to 2.5 GeV/c2 to
the c¯c rapidity density.
For single tracks the acceptance is known to better than 5%. Neglecting cor-relations between the electron and positron this implies an uncertainty of less
than 10% for pairs. However, the fraction of e+e− pairs from correlated heavy
flavor decays at mid-rapidity depends on the dynamical correlations between the quarks. These are not very accurately known [29], in particular in the azimuthal direction. Therefore additional systematic uncertainties need to be
considered. In PYTHIA the intrinsic kT parameter modifies the azimuthal
correlation between c and ¯c. We have varied kT between 1 and 3 GeV/c2
and reevaluate the fraction of e+e− pairs at mid-rapidity. A ±20% variation
was found. Different choices of parton distribution functions (PDF’s) lead to modifications of the longitudinal correlation of the pair, often expressed as
the rapidity gap between the c and ¯c quarks. We used different parton
dis-tribution functions available in PYTHIA, specifically we have used CTEQ5L, CTEQ4L, GRV94LO, GRV98LO, and MRST(c-g). We find ±11% deviations
for the e+e−pair yield in the PHENIX acceptance. When converting the e+e−
pair yield to c¯c pairs there is also a ±21% uncertainty resulting from
uncer-tainies of relative abundance of charmed hadrons and of the branching ratios to semileptonic decays. We use an effective branching ratio for c → e of 9.5%±
1%, which was calculated from D+/D0 = 0.45 ± 0.1, D
s/D0 = 0.25 ± 0.1, and
Λc/D0 = 0.1±0.05 and the branching ratios from [16]. The overall uncertainty
on the extrapolation is approximately 33%.
We also subtract a 7% contribution from bottom decays and the Drell Yan mechanism for which we assign a 100% systematic uncertainty. For the bottom cross section we assume 3.7 µb [31], in agreement with our data above 4
GeV/c2. Though negligible, we have also included the contribution from the
Drell-Yan mechanism based on a cross section of 0.04 µb [30]. For the rapidity
density of c¯c pairs at mid-rapidity we find:
dσc¯c
dy |y=0 = 118.1 ± 8.4(stat) ± 30.7(syst) ± 39.5(model)µb (2)
The systematic uncertainties on the data analysis and on the model depen-dent extrapolation are quoted separately. Using the rapidity distribution from HVQMNR [32] with CTEQ5M [33] PDF as in [5], the total charm cross section
is σc¯c = 544 ± 39(stat) ± 142(syst) ± 200(model) µb. The extrapolation to 4π
adds another 15% systematic uncertainty, which is included in the last term. This result is compatible with our previous measurement of single electrons,
which gave σc¯c =567 ± 57(stat) ± 224(syst) µb [5], and with the FONLL
prediction of 256+400
−146 µb [3].
ap-proach. We take the shape of the bottom and charm e+e− pair distributions
from PYTHIA filtered into the PHENIX acceptance and then fit the charm and bottom contribution to the data. For the charm cross section we obtain
σc¯c =518 ± 47(stat) ± 135(syst) ± 190(model) µb, consistent with our
ear-lier analysis. The bottom cross section is σb¯b = 3.9 ± 2.5(stat)+3−2(syst) µb.
In addition to the model dependent systematic uncertainties, which are
sim-ilar to those on the charm extraction, the subtraction of e+e− pairs from the
Drell-Yan mechanism contributes an extra 10-20% [34]. We estimate that the combined systematic uncertainty is about 50% and thus similar to the statis-tical error. The value for the bottom cross section is consistent with our earlier
assumption of 3.7 µb as well as with the FONLL prediction of 1.87+0.99−0.67 µb [3].
In conclusion, we have measured e+e− pairs in the mass range from 0 to 8
GeV/c2 in p+p collisions at √s = 200 GeV. Within the systematic
uncer-tainties the data can be described by known contributions from light meson decays, mostly measured in the same experiment, as well as from semileptonic decays of mesons carrying heavy flavor. The required charm and bottom pro-duction cross sections are consistent with the upper FONLL predictions and with the PHENIX measurement of single electrons.
We thank the staff of the Collider-Accelerator and Physics Departments at BNL for their vital contributions. We acknowledge support from the Depart-ment of Energy and NSF (U.S.A.), MEXT and JSPS (Japan), CNPq and FAPESP (Brazil), NSFC (China), IN2P3/CNRS, and CEA (France), BMBF, DAAD, and AvH (Germany), OTKA (Hungary), 1 DAE (India), ISF (Israel), KRF and KOSEF (Korea), MES, RAS, and FAAE (Russia), VR and KAW (Sweden), U.S. CRDF for the FSU, US-Hungarian NSF-OTKA-MTA, and US-Israel BSF.
References
[1] K. Adcox et al., Nucl. Phys. A757, 184 (2005).
[2] C. Aidala et al., BNL-73798-2005 (2005); available at http://spin.riken.bnl.gov/rsc/report/masterspin.pdf
[3] M. Cacciari et al., Phys. Rev. Lett. 95, 122001 (2005). [4] D. Acosta et al. (CDF), Phys. Rev. Lett. 91, 241804 (2003). [5] A. Adare et al. (PHENIX), Phys. Rev. Lett. 97, 252002 (2006). [6] S.S. Adler et al. (PHENIX), Phys. Rev. D76, 092002 (2007). [7] R. Vogt, arXiv:0709.2531 [hep-ph].
[9] J. Adams et al. (STAR), Phys. Rev. Lett. 94, 062301 (2005). [10] K. Adcox et al. (PHENIX), Nucl. Instrum. Meth. 499, 469 (2003). [11] A. Toia et al. (PHENIX), arXiv:0711.2118 [nucl-ex].
[12] S. Afanasiev et al. (PHENIX), arXiv:0706.3034 [nucl-ex].
[13] The PHENIX acceptance is parameterized as function of the azimuthal angle φ of a track, its pT, and charge sign q by conditions for the DC and the RICH for each spectrometer arm separately: φmin < φ + qkDC/pT < φmax and φmin < φ + qkRICH/pT < φmax The parameters are kDC = 0.206 rad GeV/c, kRICH = 0.309 rad GeV/c, φmin = −3/16π to φmax = 5/16π, and φmin = 11/16π to φmax = 19/16π.
[14] We used PYTHIA 6.319 changing PYTHIA parameters as follows: MSEL=0 with the following processes switched on MSUB 11,12,13,28,53,68, PARP(91)=1.5 (kt), MSTP(32)=4 (Q2 scale), and CKIN(3)=2.0 (min. parton pT).
[15] G. Agakichiev et al. (CERES), Eur. Phy. J. C4, 231 (1998). [16] W.M. Yao et al., Journal of Physics, G 33, 1 (2006).
[17] A. Adare et al. (PHENIX) Phys. Rev. D76, 051106 (2007). [18] S.S. Adler et al. (PHENIX) Phys. Rev. C74, 024904 (2006). [19] S.S. Adler et al. (PHENIX) Phys. Rev. C75, 024909 (2007). [20] S.S. Adler et al. (PHENIX) Phys. Rev. C75, 051902 (2007). [21] Y. Riabov et al. (PHENIX) J. Phys G34, No.8, S925 (2007). [22] A. Adare et al. (PHENIX) Phys. Rev. Lett. 98, 232002 (2007). [23] R.Gavai et al., Int. J. Mod. Phys. A10, 3043 (1995)
[24] N.M. Kroll and W. Wada, Phys. Rev. 98, 1355 (1955). [25] R.I. Dzhelyadin et al., Phys. Lett. B102, 296 (1981). [26] L.G. Landsberg, Phys. Rep. 128, 301 (1985).
[27] G.J. Gounaris and J.J. Sakurai, Phys. Rev. Lett. 21 244 (1968).
[28] We used PYTHIA 6.205 with CTEQ5L parton distribution function [33]. We changed PYTHIA parameters as follows: PARP(91)=1.5 (kt), PARP(31)=3.5 (K factor), MSTP(33)=1, MSTP(32)=4 (Q2 scale) and in addition for charm production we use MSEL=11 and PMAS(4,1)=1.25 (mass), for bottom MSEL=5 and PMAS(5,1)=4.1 (mass), and for Drell Yan MSEL=11, PARP(31)=1.8, and CKIN(3)=2.0 (min. parton pT).
[29] E.M. Aitala et al. (E791), Eur. Phy. J. C1, 4 (1999). [30] S. Gavin et al., Int. J. Mod. Phys. A10, 2961 (1995).
[31] C.H. Jaroschek, Masters Thesis, Stony Brook University, (2001); the bottom cross section was obtained by tuning PYTHIA to experimental data and interpolating to√s = 200 GeV.
[32] M.L. Mangano, P. Nason, and G. Ridolfi, Nucl. Phys. B405, 507 (1993). [33] H.L. Lai et al., Eur. Phy. J. C12, 375 (2000).