HAL Id: hal-03030470
https://hal-enpc.archives-ouvertes.fr/hal-03030470
Submitted on 30 Nov 2020
HAL is a multi-disciplinary open access
archive for the deposit and dissemination of
sci-entific research documents, whether they are
pub-lished or not. The documents may come from
teaching and research institutions in France or
abroad, or from public or private research centers.
L’archive ouverte pluridisciplinaire HAL, est
destinée au dépôt et à la diffusion de documents
scientifiques de niveau recherche, publiés ou non,
émanant des établissements d’enseignement et de
recherche français ou étrangers, des laboratoires
publics ou privés.
Pathways for wintertime deposition of anthropogenic
light-absorbing particles on the Central Andes
cryosphere
Rémy Lapere, Sylvain Mailler, Laurent Menut, Nicolás Huneeus
To cite this version:
Rémy Lapere, Sylvain Mailler, Laurent Menut, Nicolás Huneeus. Pathways for wintertime deposition
of anthropogenic light-absorbing particles on the Central Andes cryosphere. Environmental Pollution,
Elsevier, 2020, pp.115901. �10.1016/j.envpol.2020.115901�. �hal-03030470�
Pathways for wintertime deposition of anthropogenic light-absorbing particles on the
Central Andes cryosphere
R´emy Laperea,∗, Sylvain Maillera,b, Laurent Menuta, Nicol´as Huneeusc
aLaboratoire de M´et´eorologie Dynamique, IPSL, ´Ecole Polytechnique, Institut Polytechnique de Paris, ENS, Universit´e PSL, Sorbonne Universit´e, CNRS,
Palaiseau, France
bEcole des Ponts, Universit´e Paris-Est, 77455 Champs-sur-Marne, France´
cDepartment of Geophysics, Universidad de Chile, Santiago, Chile
Abstract
Ice and snow in the Central Andes contain significant amounts of light-absorbing particles such as black carbon. The consequent accelerated melting of the cryosphere is not only a threat from a climate perspective but also for water resources and snow-dependent species and activities, worsened by the mega-drought affecting the region since the last decade. Given its proximity to the Andes, emissions from the Metropolitan Area of Santiago, Chile, are believed to be among the main contributors to deposition on glaciers. However, no evidence backs such an assertion, especially given the usually subsident and stable conditions in wintertime, when the snowpack is at its maximum extent. Based on high-resolution chemistry-transport modeling with WRF-CHIMERE, the present work shows that, for the month of June 2015, up to 40% of black carbon dry deposition on snow or ice covered areas in the Central Andes downwind from the Metropolitan area can be attributed to emissions from Santiago. Through the analysis of aerosol tracers we determine (i) that the areas of the Metropolitan Area where emissions matter most when it comes to export towards glaciers are located in Eastern Santiago near the foothills of the Andes, (ii) the crucial role of the network of Andean valleys that channels pollutants up to remote locations near glaciers, following gentle slopes. A direct corollary is that severe urban pollution, and deposition of impurities on the Andes, are anti-correlated phenomena. Finally, a two-variable meteorological index is developed that accounts for the dynamics of aerosol export towards the Andes, based on the zonal wind speed over the urban area, and the vertical diffusion coefficient in the valleys close to ice and snow covered terrain. Numerous large urban areas are found along the Andes so that the processes studied here can shed light on similar investigations for other glaciers-dependent Andean regions.
Keywords: Black Carbon, Chemistry-transport, Urban pollution, Cryosphere
1. Introduction
1
The chapter on High Mountain Areas, from the IPCC’s
Spe-2
cial Report on the Ocean and Cryosphere in a Changing
Cli-3
mate (SROCC) (Hock et al., 2019) highlights the threats posed
4
by the feedback associated with deposition of light absorbing
5
particles on snow and glaciers, that induce surface air warming
6
along with accelerated snow cover reduction. Recent studies
7
over the Tibetan Plateau show that light-absorbing particles are
8
responsible for about 20% of the albedo reduction of glaciers at
9
the end of winter, corresponding to a radiative forcing of up to
10
hundreds of W m-2, hence accelerating their melting during the
11
warmer season (Zhang et al., 2017; Kang et al., 2020). In
addi-12
tion to a positive radiative feedback on climate, local impacts on
13
water resources, population security, ecosystems, infrastructure
14
and tourism are also at stake.
15
Glaciers in Chile have been shrinking over the recent
16
decades, in particular in the Central Chilean Andes (32◦S to
17
36◦S) where large glaciers feed valleys rich in agriculture and
18
large populated centers such as Santiago, Chile’s capital
(Pel-19
licciotti et al., 2013). Although the role of anthropogenic black
20
∗remy.lapere@lmd.polytechnique.fr
carbon (BC) on the retreat of glaciers has not been established
21
for South American glaciers, previous studies suggest that
de-22
position of BC on snow can affect the length of the snow cover
23
season in the Northern hemisphere reducing its duration by up
24
to 10 days in boreal and temperate regions (M´en´egoz et al.,
25
2013) and up to 8 days in the Himalayas (M´en´egoz et al., 2014).
26
The current mega-drought in Central Chile exacerbates the
re-27
treat of the Central Andean glaciers and threatens the
sustain-28
ability of water resources in the region (Garreaud et al., 2017,
29
2019). The stakes are thus high for urban areas neighboring the
30
Andes cordillera. In this context, BC deposition on the Central
31
Andes glaciers represents an additional burden, and as the
man-32
agement of water resources becomes paramount in the region
33
for the coming years, a detailed knowledge of the processes and
34
sources leading to the presence of BC in glaciers is essential.
35
A likely contribution of anthropogenic pollution to the
ob-36
served retreat of glaciers in the Central Andes was found
37
(Molina et al., 2015; Rowe et al., 2019). In particular, the
sig-38
nificant amount of atmospheric pollutants emitted in Santiago,
39
Chile is hypothesized to influence ice composition in nearby
40
glaciers (Cereceda-Balic et al., 2011; Rowe et al., 2019).
In-41
deed, the city regularly faces high levels of fine particulate
mat-42
ter pollution, of which BC, in wintertime, mainly due to
sive emissions from wood burning for residential heating and
44
diesel-fueled vehicles (Barraza et al., 2017), but also to episodic
45
strong emissions from barbecue cooking (Lapere et al., 2020).
46
Nevertheless, no evidence was found so far to confirm that BC
47
emissions from Santiago are able to deposit on the Central
An-48
des glaciers, particularly given the subsident conditions
associ-49
ated with a shallow stable boundary layer and a persistent
in-50
version over the city observed during winter months (Garreaud,
51
2009), when most residential wood burning emissions occur
52
and snow extent is at its maximum. Furthermore, Santiago is
53
only 500 m above sea level, while nearby Andean mountains
54
reach altitudes as high as 5800 m, which represents a huge
ob-55
stacle to go over for these stable, non-convective air masses. In
56
particular, Cordova et al. (2015) found that at the beginning of
57
spring 2014, air masses reaching an Andean valley southeast of
58
Santiago barely interacted with urban air from the city. On the
59
other hand, Gramsch et al. (2020) has shown recently that for
60
the northern part of Santiago, emissions from the urban area can
61
contribute significantly to atmospheric concentrations observed
62
higher up in the cordillera, with limited export in wintertime
63
compared to summertime.
64
Studies over the Himalayas and the Alps show that an
ef-65
fective pathway for deposition of anthropogenic particles on
66
glaciers is channeling through valleys (Ming et al., 2012;
67
Di´emoz et al., 2019a). However, wintertime conditions lead to a
68
minimum intensity of this phenomenon (Di´emoz et al., 2019b).
69
Also, during fair weather convective days, vertical export of
70
air masses from the boundary layer into the free troposphere
71
can occur through topographic venting (Henne et al., 2004).
72
Again, this mechanism is less active under stable cold
condi-73
tions. Holmes et al. (2015) suggest enhanced vertical mixing
74
over complex terrain in wintertime under cloudy conditions, in
75
the western United States. Nonetheless, given the quite unique
76
configuration of the Andes cordillera, the processes at play for
77
a potential wintertime export of pollutants from Santiago basin
78
up to the Andean glaciers are not well known, and are
investi-79
gated in this study.
80
The objective of this work is to provide a first assessment of
81
the burden of Santiago’s emissions on BC deposition over the
82
Central Andean snowpack, and to understand why this
contri-83
bution can be significant while the mainly stable
meteorologi-84
cal conditions observed in wintertime would lead to think that
85
the export of pollutants is prevented. To do so, a combination
86
of observations and chemistry-transport modeling with
WRF-87
CHIMERE is used to determine the amount of BC deposition
88
on glaciers attributable to emissions from Santiago and the
as-89
sociated pathways.
90
2. Data and methods
91
The present work relies for a large part on
chemistry-92
transport modeling with WRF-CHIMERE. Atmospheric
com-93
position and meteorological measurements are also used, for
94
analysis purposes as well as for assessing the quality of the
sim-95
ulations. These two components are described hereafter.
96
2.1. Observational data
97
Time series of hourly surface measurements of meteorology
98
and air quality are extracted from the automated air quality
99
monitoring network of Santiago (SINCA - https://sinca.
100
mma.gob.cl/index.php/region/index/id/M, last access
101
28 April 2020). Climatological daily rainfall and
tempera-102
ture data at DMC is issued from the Chilean Weather Service
103
(DMC, from Spanish Direccion Meteorol´ogica de Chile) and
104
accessible from the Chilean Center for Climate Science and
105
Resilience through their online database Explorador Clim´atico
106
(CR2 - http://explorador.cr2.cl/, last access 28 April
107
2020). For the analysis of the model’s ability to reproduce a
108
specific transport event with complex topography, additional
109
data from a dedicated one-week campaign carried out in
Santi-110
ago and the adjacent Maipo canyon, including vertical profiles
111
of BC, have been used. This campaign was conducted from
112
Monday 20 until Sunday 26 July 2015. In each one of the
113
three sites defined during the campaign (locations DMC
down-114
town Santiago, VZC at the entrance of the Maipo canyon, and
115
GYC inside the meridional branch of the canyon - a map is
116
provided later on), hourly surface measurements of standard
117
meteorological parameters and PM10 concentration were
con-118
ducted. In addition, vertical profile measurements of BC (via a
119
mini-aethalometer) and standard meteorological parameters are
120
available up to 1 km above ground, from tethered balloon, every
121
3 hours.
122
2.2. Modeling setup
123
The chemistry-transport simulations use the Weather
Re-124
search and Forecasting (WRF) mesoscale numerical weather
125
model (Skamarock et al., 2008) to simulate the meteorological
126
fields, and CHIMERE to compute chemistry and transport.
An-127
thropogenic emissions are taken from the EDGAR-HTAP
in-128
ventory. Two simulation domains are considered and described
129
in Figure 1 and Table 1, with a coarse domain at a 5 km
spa-130
tial resolution including Central Chile (referred to as CC5
here-131
after), and a nested domain focusing on Santiago area at a 1 km
132
resolution (referred to as STG1 hereafter). The model
config-133
uration used in this study is presented in Table A.1. WRF is
134
applied to 46 vertical levels up to 50 hPa, in a two-way nested
135
fashion. Initial and boundary conditions used are from the
136
NCEP FNL analysis, with a 1◦ by 1◦ spatial resolution and
137
6-hour temporal resolution, from the Global Forecast System
138
(NCEP, 2000). Land-use and orography are based on the
modi-139
fied IGBP MODIS 20-category database with 30 sec resolution
140
(Friedl et al., 2010). CHIMERE is a Eulerian 3-dimensional
141
regional Chemistry-Transport Model, able to reproduce
gas-142
phase chemistry, aerosols formation, transport and deposition.
143
In this study the 2017 version of CHIMERE is used (Mailler
144
et al., 2017). The configuration is described in Table A.1. The
145
EDGAR HTAP V2 dataset provides the anthropogenic
emis-146
sions inventory, which consists of 0.1◦gridded maps of air
pol-147
lutant emissions for the year 2010 (Janssens-Maenhout et al.,
148
2015). A downscaling is applied to this inventory based on
149
land-use characteristics, and monthly emissions are split in time
150
down to daily/hourly rates following the methodology of Menut
151
et al. (2013).
Domain Horizontal resolution Purpose Key output
CC5 5km Scenario on BC Contribution of BC
(100x200 grid points) urban emissions from Santiago to deposition on glaciers STG1 1km High resolution Pathways of aerosols (100x100 grid points) transport of tracers from Santiago to
without chemistry the glaciers
Table 1: Description of CC5 and STG1 domains and their purposes. Both are centered on Santiago.
Figure 1: Left: coarse simulation domain at 5 km resolution - CC5. Right: nested domain at 1 km resolution - STG1. In both maps the white dot shows the location of downtown Santiago. Map background layer: Imagery World 2D,
c
2009 ESRI.
The simulated period is 16 June to 31 July 2015. The
pe-153
riod from 16 June to 30 June is used for spin-up and thus not
154
analyzed. The choice to simulate the month of July 2015 is
jus-155
tified by the availability of dedicated measurements evidencing
156
some of the processes studied here on the one hand, and on the
157
other hand this month of the year is interesting for its
combina-158
tion of a large snow cover and high pollutants emissions at the
159
same time. In June, pollution levels are similar but the extent of
160
the snow cover is lesser, while August shows a more developed
161
snowpack but less pollution in the city. In addition,
meteoro-162
logical conditions for July 2015 are climatologically typical of
163
July, with daily mean, maximum and minimum temperatures
164
in downtown Santiago of 9◦C, 12.6◦C and 5.5◦C, respectively,
165
to be compared with the 2000-2019 median values of 8.4◦C,
166
12.1◦C and 4.3◦C respectively (Fig. A.1a). Precipitation in
167
Santiago is also well in the range of the 21stcentury values with
168
a daily mean at 1.2 mm close to the recorded 1.1 mm median
169
over the last 20 years (Fig. A.1a). As for the wind regime, the
170
mountain-valley circulation induced dipole of south-westerlies
171
and easterlies in Santiago is consistent, with similar average
172
wind speeds along these two main directions for the
climatol-173
ogy and July 2015 (Fig. A.1b and A.1c, respectively).
Sim-174
ulation scores for meteorology and atmospheric composition,
175
against observations at stations of the urban area, can be found
176
in Tables A.2, A.3 and A.4. Surface wind and temperature, as
177
well as vertical profiles for these two variables decently
repro-178
duce observations for several locations in Santiago. Thermal
179
inversions are also successfully captured. Concentrations of
180
PM2.5 simulated in the CC5 case are in reasonable agreement
181
with surface observations in the Metropolitan Area of Santiago.
182
For the CC5 domain, two simulations are performed. One
183
with a full emissions inventory - referred to as baseline case or
184
BS in the continuation - and one with an inventory setting
emis-185
sions from Santiago area to zero - contribution case or CS. The
186
comparison of these two simulations yields the share of
emis-187
sions from Santiago in the atmospheric composition and
depo-188
sition of pollutants in the region. As an example, the emission
189
inventory extracted from EDGAR HTAP used for BC is
pro-190
vided in Figure 2a. The black rectangle on the inventory map
191
defines the limit of the grid points belonging to the
Metropoli-192
tan area of Santiago. The model points inside this zone see their
193
emission rates of BC set to zero in the CS simulation so as to
194
perform the sensitivity analysis. The nested STG1 domain is
195
designed for the finer study of pollution export processes and
196
corresponds to the black square in Fig. 2b (which is a slightly
197
different area than the black rectangle in Fig. 2a). Chemistry
198
is not activated in this domain since the studied compounds
199
are reduced to passive aerosol tracers (fine mode, density of
200
1.7 g cm−3), distributed over the Santiago Metropolitan Area
ac-201
cording to Figure 2b. Tracers emission rates are the same for
202
every location, and can be found in Figure 2c. Emission rates
203
are adapted from HTAP data so as to emit the same total mass
204
of BC as a typical 1 km2 grid point of the urban area. A daily
205
cycle is then applied on these emission rates to be as close to
206
actual emissions dynamics as possible. Such a configuration
207
allows for the study of the pathways of pollution depending
208
on their origin in the basin, and assess the preferred origin of
209
polluted air masses reaching elevated, snow-covered sites. The
210
nesting between STG1 and CC5 is only used for
meteorologi-211
cal conditions simulation purposes in WRF but deactivated for
212
CHIMERE, as the targets in terms of atmospheric composition
213
study differ between the two domains.
214
3. Contribution of emissions from Santiago to BC
deposi-215
tion
216
The following analysis estimates the contribution of
emis-217
sions from Santiago to BC deposition on the nearby Andean
218
snow or ice-covered areas in wintertime. The influence and
219
reach of pollutants emitted in different districts within Santiago
220
is also studied.
221
3.1. Contribution of the Metropolitan Area
222
The following analysis is based on the 5 km CC5 CHIMERE
223
simulations. Details of their configuration and validation can
224
be found in Section 2 and Appendix A. Two simulations are
225
compared, one with a full emissions inventory (BS), one where
226
emissions from Santiago area are set to zero (CS). The di
ffer-227
ence yields an estimate of the share of Santiago’s emissions
228
in the atmospheric composition of the region. Snow
measure-229
ments from Rowe et al. (2019) estimate the surface
deposi-230
tion rate of BC at the Yerba Loca site near Santiago (33.33◦S,
231
70.33◦W - see YBL in Figure 2b) in July 2016 to around
232
5.2 mg m−2 for the month. For the same location, the
base-233
line simulation (BS) yields 8.7 mg m−2for July 2015, which is
234
comparable in terms of magnitude although these numbers are
Figure 2: (a) Surface emissions of BC for the CC5 simulation. The black box represents the area where emissions are set to zero for the contribution case. Map background layer: World Shaded Relief, c 2009 ESRI (b) Location of passive aerosol tracers used in the SGT1 simulation (circles) and topography of the basin (colormap). Crosses indicate other relevant locations mentioned in the study. GYC is for Guyacan, YBL for Yerba Loca, SGA for San Gabriel (c) Daily cycle of emission for each tracer.
not for the same years, and despite the relatively coarse
resolu-236
tion of the simulation. We also acknowledge the absence in the
237
EDGAR HTAP emission inventory, of the significant BC source
238
linked to the nearby mining activity at Los Bronces (33.15◦S,
239
70.28◦W), which may be a source of discrepancy between
mea-240
surements and modeling, although there is no evidence these
241
emissions reach the site of Yerba Loca. Nevertheless, in
addi-242
tion to the good reproduction of meteorology and atmospheric
243
composition observed in Santiago, and despite several sources
244
of uncertainty, having the proper order of magnitude for
depo-245
sition at this location gives confidence in the behavior of the
246
simulation.
247
Figure 3 shows the amount (a and b) and proportion (c and
248
d) of the total BC deposition attributable to Santiago
emis-249
sions for July 2015. This is achieved by representing the
dif-250
ference between the total deposition in the BS case and in the
251
CS case (BS-CS), and the ratio (BS-CS)/BS. Clearly, BC
emis-252
sions from Santiago mainly affect low elevation areas nearby,
253
particularly regarding dry deposition, with a contribution to BC
254
deposition of 60% to 100%. A significant amount of BC also
255
reaches much higher summits, where it can contribute to up to
256
40% of the deposition for the period, especially in the
south-257
east of Santiago. Wet deposition is more scarce at this time
258
of the year, and in our case seems driven by orographic
pre-259
cipitation. According to Figure 3b a plausible pattern could be
260
that pollutants from Santiago are blown towards the southeast
261
cordillera consistently with the afternoon westerlies induced by
262
mountain-valley circulation, and are precipitated when moist
263
air masses encounter the foothills and cloud droplets scavenge
264
Figure 3: (a) BC dry deposition originating from Santiago’s emissions, (b) same as (a) for wet deposition, (c) proportion of BC dry deposition originating from Santiago’s emissions, (d) same as (c) for wet deposition. Total over July 2015 - CC5 simulation. The black box corresponds to the area where emissions are set to zero in the CS case. Grey contour levels are every 500 m starting from 1000 m a.s.l. White stars in (c) and (d) show the snow or ice-covered grid points considered in the continuation.
the air below.
265
Based on Figure 3, the Andean area most affected by
San-266
tiago’s emissions during the month of July 2015 is located at
267
the southeast of the city. Accordingly, a focus is made on the
268
terrain in this zone that is permanently snow or ice-covered
dur-269
ing the whole month of simulation (grid points shown in white
270
stars in Figures 3c and 3d), to study the temporal evolution of
deposition. From now on, this area is referred to as the target
272
area. The simulated time series of BC dry and wet deposition
273
averaged over the target area is shown in Figures 4a (2-hour
274
deposition) and 4b (accumulated deposition). Dry deposition
275
occurs continuously over the target area during the simulated
276
month, with a marked diurnal cycle but maintaining non-zero
277
values throughout the whole 24-hour cycle, the minimum
2-278
hour value being 0.2 µg m−2. When the rate of dry deposition is
279
near its minimum, the contribution of emissions from Santiago
280
is very small (solid and dashed line cannot be distinguished),
281
pointing to a domination of local and less intensive sources of
282
BC such as road traffic, mining or wood burning for residential
283
heating in the valley villages. On the other hand, when
depo-284
sition rates are higher (19 July and 27 July for instance) the
285
contribution of emissions from Santiago becomes more
signif-286
icant reaching up to 50%. BC emissions from Santiago thus
287
seem to play a role mainly during stronger deposition episodes.
288
On the whole, the emissions from the city lead to an
accumu-289
lated additional dry deposition of 126 µg m−2 (33%) over the
290
target area (Figure 4b). Contrarily to dry deposition which
oc-291
curs on a continuous basis, only a few precipitation episodes,
292
concentrated between 12 July and 15 July, account for all wet
293
deposition during the month of July 2015. Given the spatial
pat-294
tern of wet deposition seen in Figure 3b and also the increase in
295
dry deposition right before the precipitation events, this episode
296
likely corresponds to convective moist air masses coming from
297
the northwest, importing BC, and leading to orographic
precip-298
itation which in turn scavenges pollutants to the ground.
Al-299
though slightly weaker than dry deposition, wet deposition of
300
BC from Santiago still accounts for 75 µg m−2 (26%) of total
301
deposition (Figure 4b) and is much more concentrated in time
302
(Figure 4a). As a result, precipitation in wintertime, which have
303
a positive influence on air quality in Santiago because of the
304
associated scavenging of particles, lead at the same time to a
305
higher deposition of light-absorbing particles on snow via wet
306
deposition. Local effects - air quality in Santiago - and global
307
consequences - radiative forcing leading to accelerated melting
308
of glaciers and snow - compete in this regard.
309
Figure 4: (a) Simulated time series of BC deposition over the target area in the BS case (solid line) and CS case (dashed line), (b) same as (a) but accumulated.
In Figure 4a, the period between 21 to 25 July shows a clear
310
minimum in deposition rate compared to the rest of the time
311
series. In connection, the onset of a coastal low along the
sub-312
tropical west coast of South America is observed around that
313
period. Figure 5 shows the evolution of the mean sea-level
pres-314
sure and 925 hPa wind fields between 22 July to 25 July. The
315
patterns correspond well to d-2, d-1, d0 and d+1 of a coastal
316
low event as described in Garreaud et al. (2002). One of the
317
effects of this shallow, warm-core low pressure cell disrupting
318
the synoptic circulation is a strengthening of the easterlies
flow-319
ing above the Andes (not visible in this large-scale figure) and
320
a strengthening of the persistent inversion layer above Santiago
321
for a few days (Rutllant and Garreaud, 1995; Garreaud et al.,
322
2002). These coastal lows can also affect surface winds through
323
the formation of strong easterly katabatic winds locally known
324
as raco (Mu˜noz et al., 2020, e.g.). As an example, raco events
325
were observed on 21 and 24 July (not shown here), during the
326
coastal low development and extinction, and resulted in no
de-327
position coming from Santiago on the Andes, as can be seen in
328
Figure 4a. As a consequence of both phenomena - strong
east-329
erlies above the Andes and raco - air masses from Santiago are
330
blown in the opposite direction of the Andes when above the
331
mixing layer, and hence do not affect the target area during that
332
period. In parallel, stagnation is favored in the basin, above the
333
urban area. Most wintertime pollution events in the city occur
334
under such synoptic-scale conditions (Rutllant and Garreaud,
335
1995). Again, conditions favoring urban pollution in Santiago
336
imply minimal export of BC towards the cryosphere.
337
Figure 5: Mean sea-level pressure (contours every 2 hPa) and 925 hPa winds (arrows) at 06:00 UTC from 22 July to 25 July. Data is from the NCEP FNL analysis used as boundary conditions for the CHIMERE simulations. Black area indicates terrain elevation exceeding 2500 m. H and L indicate high and low centers, respectively.
It is clear in these simulations that urban emissions from the
338
capital city of Chile have a significant influence on deposition
339
of light-absorbing particles on Central Andean snow and ice,
340
with an average total deposition of around 200 µg m−2
(corre-341
sponding to 30% of the total) on the snow or ice-covered areas
342
southeast of Santiago for the month of July 2015 (Fig. 4). The
343
effect on ice and snow albedo, and thus the associated radiative
344
forcing are not straightforward to estimate. However, the field
345
measurement campaign conducted in the snowpack of the
Cen-346
tral Andes by Rowe et al. (2019) found that the regional average
347
vertically-integrated load of BC in snow samples near Santiago
348
was 780 µg m−2, corresponding to a mean radiative forcing of
349
1.4 W m−2during winter. We find that around 30% of this BC is
likely to have been emitted in Santiago (Fig. 4). Hence, a
signif-351
icant fraction of the excess radiative forcing measured in snow
352
samples is attributable to emissions from Santiago, although it
353
is not quantifiable here.
354
In the above analyses, the metropolitan area of Santiago was
355
considered as a unit block of BC emissions, but this urban area
356
is wide (640 km2), with large gradients in the spatial
distribu-357
tion of emissions. In addition, the surrounding topography of
358
the Andes makes air masses circulation complex. In this
re-359
spect, the locations within the Santiago area that have the most
360
impact when it comes to deposition on the Andes, i.e. where
361
pollutants are more likely to reach the glaciers once emitted,
362
are not straightforward. The continuation looks at the locations
363
within Santiago where emissions reductions would imply a
sig-364
nificant decrease in BC deposition on the cryosphere.
365
3.2. Contribution of different districts of Santiago
366
Using the 1 km resolution STG1 simulation with passive fine
367
mode aerosol tracers, and integrating over the target area (snow
368
or ice-covered - red stars in Figure 6a), the contribution of
369
air masses from different districts of the Santiago
Metropoli-370
tan Area to atmospheric composition and pollutants deposition
371
on the Andean cryosphere can be studied.
372
Figure 6: (a) Locations of considered passive tracers (white dots), and target area (red stars) influenced by emissions from Santiago (white box). Map back-ground layer: Imagery World 2D, c 2009 ESRI (b) relative share of each tracer to dry and wet total deposition on the target area for July 2015.
Dry deposition mainly originates from emissions at VZC
lo-373
cation (47% of accumulated dry deposition over the month of
374
July), at the entrance of the Maipo canyon (Fig. 6b). Less
in-375
tuitively, emissions from the northeast (CND - 17%) weigh
al-376
most as much as the ones from a site much closer to the
tar-377
get area (PTA - 19%). The other parts of the city considered
378
here, especially downtown, have a lesser role in dry deposition
379
(2% to 8%). Regarding wet deposition, locations of origin are
380
slightly more evenly distributed, indicating a probable role of
381
large-scale convection over the city mixing pollutants and
gen-382
erating clouds. However, only a few precipitation events are
383
simulated over the period, so that concluding on it is not
rele-384
vant. Generally speaking, Figure 6 shows that the closer the
lo-385
cation is to the Andes, regardless of the latitude, the more likely
386
its emitted particles will deposit on the target area. More than
387
proximity to the target area, the interaction of air masses and the
388
foothills and valleys of the cordillera is then of major relevance.
389
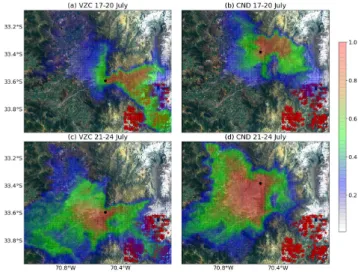
Figure 7 shows the pathways of tracers VZC and CND during
390
the periods 17-20 July and 21-24 July. The former episode
fea-391
tures significant deposition on the Andes while the latter shows
392
very little (Fig. 4a). For VZC, an efficient pathway is through
393
the Maipo canyon, southeast of Santiago, that acts as a funnel
394
guiding particles towards the summits during the 17-20 July
395
period (Fig. 7a). The 21-24 July period (Fig. 7c) shows a less
396
marked intrusion in this valley, and the tracer barely reaches
397
high elevation. For CND (Fig. 7b and d) the Mapocho canyon,
398
northeast of Santiago plays a similar role, enabling polluted air
399
masses to enter the network of valleys and eventually access
400
high elevation sites during the 17-20 July period, which occurs
401
much less during the 21-24 July period.
402
Figure 7: Frequency of tracer surface concentration above 0.2h of the maxi-mum concentration at the source for two periods with distinct synoptic circula-tion (a) VZC for 17-20 July, (c) VZC for 21-24 July, (b) CND for 17-20 July, (d) CND for 21-24 July. Red stars show the target area, black dots the emission site. Map background layer: Imagery World 2D, c 2009 ESRI.
It is important to keep in mind that the results in Figure 6b are
403
based on equal emission rates at every tracer locations.
How-404
ever, actual measurements from the air quality network of
San-405
tiago show that the CND location emits much less particulate
406
matter than PTA for instance. The circulation dynamics
im-407
ply that for each emitted particle at both locations, they have
408
approximately the same likelihood to end up deposited on the
409
cryosphere, but in actual conditions, regulating emissions at
410
PTA would have a much more dramatic impact on deposition
411
given the higher emission rate. Similarly, VZC is found to be
412
at the optimal location, but is also less densely populated and
413
emits less, in total amount, than PTA.
414
Given the usually stable and subsident conditions in
winter-415
time, and the elevated height of the mountains that are within
416
reach of air masses coming from Santiago (the urban area is
417
only 500 m a.s.l while summits in the southeast, where
deposi-418
tion is observed, can reach up to 4000 m), the processes
lead-419
ing to such a high elevation deposition are not straightforward.
420
Given the previous analysis, a first natural explanation would
421
involve mountain-valley circulation and the so-called mountain
422
venting phenomenon. The latter corresponds to the horizontal
423
advection of air masses from elevated areas towards flat terrain
that, when encountering a shallow mixing layer, leads to the
ex-425
port of boundary layer air into the free troposphere (Kossmann
426
et al., 1999; Henne et al., 2004).
427
4. Role of the mountain-valley circulation
428
4.1. Injection of BC into the free troposphere
429
Circulation and interaction between Santiago and the Maipo
430
canyon, south of Santiago, is studied here. Mountain-valley
431
circulation patterns are clear at this location, with a first part
432
of the canyon being almost zonally oriented (Fig. 6 eastward
433
of VZC), and the second part almost along a meridional axis.
434
Schematically, under usual wintertime conditions, the di
ffer-435
ential heating of air masses by sunlight between the Santiago
436
basin and the Andean slopes generates an ascending motion of
437
air from the city into the valley during the afternoon, and a
re-438
versal of this motion, from the valley towards the city, during
439
nighttime (Fig. 8 and Whiteman (2000)). Since the boundary
440
layer above the city is even shallower at night than during the
441
day, a direct consequence of this circulation pattern is that
pol-442
luted air masses coming back towards the urban area, if given
443
enough momentum, will likely be injected into the free
tropo-444
sphere (Fig. 8). As a result, pollutants found in this secondary
445
layer above the boundary layer can be exported much farther,
446
and become available on the next day to be transported higher
447
up when the daytime circulation resumes.
448
Figure 8: Schematic of the usual mountain-valley circulation along the zonal part of the Maipo canyon and associated venting mechanism.
Such a mechanism was clearly recorded during the 2015
449
campaign described in Section 2.1, on 22 July at the entrance
450
(VZC) and farther (GYC) in the Maipo canyon (Fig. 2). The
451
combination of a positive zonal wind at VZC and a negative
452
meridional wind at GYC allows for the intrusion of polluted air
453
masses deep into the valley during the afternoon (Fig. 9a). At
454
night, these air masses come back down into the basin
(posi-455
tive meridional wind at GYC and neutral zonal wind at VZC).
456
At 18:00 local time (LT), pollutants at VZC are still contained
457
and well mixed within the boundary layer, while at 21:00 a
sec-458
ondary layer of BC can be observed above the boundary layer
459
(Fig. 9b). The fate of this secondary layer was not observed
460
though, so that validating the hypothesis of injection of the BC
461
higher up as the origin of its transport towards the mountains
462
is not possible with observation only. Our STG1 simulation
463
bridges this gap. It is worth noting that the model (solid lines)
464
agrees reasonably with the observations (dashed lines), both for
465
surface winds at the two locations, and for the shape of the
466
aerosol profile at night, especially regarding the formation of
467
a secondary layer in the free troposphere (Fig. 9). The model
468
generates a shallower mixing layer than observed, but the
pat-469
tern is consistent.
470
Figure 9: Observed (dashed lines) and modeled (solid lines - STG1 simulation) intrusion episode of 22 July. (a) Observed and modeled zonal wind at VZC and meridional wind at GYC. (b) Boundary layer height and vertical profiles of BC (observed) and VZC tracer (simulated). For the sake of comparability, only the free troposphere profiles are shown for the model. Boundary layer heights from the campaign are derived from vertical profiles based on the methodology described in Stull (1988)
This event can be further described with the STG1
simula-471
tion, following along-valley transects of tracers concentrations
472
and wind profiles. At 16:00 LT, particle pollutants, mainly
473
originating from the VZC location, have penetrated deeply into
474
both branches of the Maipo canyon, mostly within the
bound-475
ary layer (Fig. A.2). This intrusion is mainly driven by
low-476
level winds in both valleys, while a wind shear at the end of the
477
southern valley disconnects the polluted air masses from the
478
surface. 5 hours later (Fig. A.3) low-level winds have reversed,
479
consistently with mountain-valley circulation, and blow
tracer-480
containing air masses back towards the Santiago basin.
How-481
ever, while the intrusion was governed mostly by surface winds,
482
winds above the boundary layer now dominate the advection.
483
As a result, particles are injected into the free troposphere over
484
Santiago, as already evidenced in Figure 9. Thus, despite stable
485
conditions and a shallow boundary layer, the mountain valley
486
circulation allows for the export of pollutants higher up.
487
However, when tracking the secondary layer of BC injected
488
into the free troposphere, it does not appear to go back into the
489
direction of the Andes, but rather continue its path towards the
490
west of Santiago, and eventually be diluted without being
re-491
covered higher up despite winds above 2000 m blowing in the
492
favorable direction (Fig. A.4). This result is consistent with the
493
time series in Figure 4a, where almost no deposition occurs on
494
the target area in the few hours following the 22 July venting
495
episode. In fact, the whole period between 22 July and 25 July
496
in Figure 4a features very little deposition. This can be traced
497
back to the onset of the coastal low, as discussed in Section 3.1.
498
The hypothesis of the observed secondary layer of pollution in
499
the free troposphere as a source of export and deposition of BC,
500
does not apply in this case. Nevertheless, while the nighttime
501
venting may not be relevant, the daytime mechanism of
injec-502
tion of pollutants into the Andean valleys is critical.
Figure 10: Schematic of the 3 export situations from a latitude/longitude (left) altitude/longitude (right) perspective. The transect followed in the right-hand panel is shown in white dashed line in the left-hand panel.
4.2. Valley intrusion of air masses and vertical export
504
When comparing the two contrasted periods mentioned in
505
Section 3.2, although the total deposition over the whole
do-506
main remains similar (7% difference on the accumulated
depo-507
sition of tracers), the spatial patterns greatly differ. As seen in
508
Figure 7, during the 21-24 July period, pollutants are advected
509
towards the city and the southwest region mainly, while during
510
the 17-20 July period they are found in the northwest, the east
511
of Santiago adjacent to the cordillera, and over the Andes.
Sec-512
tion 4.1 points towards two key meteorological components of
513
the mountain-valley circulation driving the fate of polluted air
514
masses: the low-level zonal wind above the city, and the
ver-515
tical motions at the end of the southern valley. Schematically,
516
the weak vertical mixing associated with wintertime conditions
517
forces the pollutants to follow a pathway along gentle slopes
518
near the ground to reach or get closer to the snow or ice-covered
519
areas. Furthermore, even though events of polluted air intrusion
520
into the Maipo canyon occur, these air masses do not
necessar-521
ily reach the snow or ice-covered areas of the Andes. Based
522
on the above, we identify three possible transport alternatives
523
which are schematically represented in Figure 10: (1) easterly
524
winds dominate and urban polluted air masses are transported
525
away from the Andes, (2) westerlies enable intrusion into the
526
canyon but pollutants cannot reach the Andean cryosphere and
527
(3) deep intrusion occurs and air masses are successfully
trans-528
ported to the Andean summits. The latter is the case where we
529
expect large deposition.
530
We derive now a parameterization indicating the likelihood
531
that one of the aforementioned alternatives occur and we use
532
the simulated daily deposition of tracers in July 2015 to
ex-533
amine its validity. Given the fact that the chance of an air mass
534
reaching the Andean cryosphere is linked first to the occurrence
535
of a zonal wind transporting the air parcels into the canyon and
536
then lifting it to the Andean summits, we choose the simulated
537
near-surface zonal wind (u) over the Santiago basin in the
after-538
noon to represent the former and the simulated vertical diffusion
539
coefficient (Kz) near the surface in the valley, close to the
sum-540
mits, at the same time of day to express the magnitude of
ver-541
tical motion. The combination of these parameters evidences
542
that large deposition occurs for significant zonal winds and
ver-543
tical diffusion (large circles in Fig. 11a). For strong zonal winds
544
only or strong updrafts only, deposition is moderate. For
situ-545
ations with both weak winds and vertical diffusion, almost no
546
deposition occurs.
547
Figure 11: (a) Tracers dry deposition on the target area dependency on KS GA
and US T GO. Circles areas are proportional to deposition. (b)
Relation-ship between the normalized daily dry deposition and the normalized index KU/max(KU). The correlation is given with a 95% confidence interval.
The parameterization combining these two variables,
repre-548
senting the above and thus expressing the likelihood of
occur-549
rence of deposition is defined in Eq. 1. For the Kz term we
550
choose the vertical diffusion coefficient at 40 m above ground
551
level at the location of San Gabriel (KS GA- see SGA in Figures
552
2 and 10) averaged between 14:00 and 20:00 LT. San Gabriel is
considered because of its location at the end of the main
south-554
ern valley where the pollutants are lifted from the ground to
555
the Andean summits (Fig. A.2b). For the zonal wind
compo-556
nent (u) we choose the zonal wind at 40 m above ground level,
557
squared and averaged over the urban area of Santiago and
be-558
tween 14:00 and 20:00 LT (hereafter US T GO). The zonal wind
559
is squared so as to be homogeneous to a kinetic energy per unit
560
mass of air, which is what physically provides momentum for
561
the intrusion of air masses. Both US T GOand KS GAare capped,
562
related to the fact that above a certain threshold, increasing
563
wind speed or vertical motion does not bring any more
depo-564
sition if the other parameter is too small, as evidenced in
Fig-565
ure 11a. The thresholds are empirically set to 1 m s−1for u and
566
3 m2s−2for Kz. The correlation of this index with dry
deposi-567
tion is illustrated in Figure 11b. The deposition term considered
568
here is limited to the target area summed for all tracers between
569
14:00 and 04:00 LT, and normalized by the maximum
deposi-570
tion over the period. The resulting correlation is not very
sen-571
sitive to the choice of the threshold values for US T GOand KS GA
572
as long as they are not taken too small, and such thresholds are
573
necessary to have a consistent result. This index accounts for
574
(i) intrusion of urban BC into the Maipo canyon via significant
575
zonal winds over the city in the afternoon (ii) the possibility for
576
air masses to be exported from the bottom of the valley up to
577
the summits at the same time, before being distributed and
di-578
luted into several smaller valleys. Combining (i) and (ii) leads
579
to large deposition a few hours later (hence the consideration
580
for the total deposition between 14:00 and 04:00 LT). Having
581
only one of the two induces moderate deposition, having none
582
leads to limited to no deposition. This justifies the choice of
583
multiplying the two variables, accounting for a logical and
re-584
lationship, although the meteorological meaning of the
result-585
ing index is not obvious. The correlation between the
normal-586
ized deposition and normalized KU is 0.84 [0.71;0.91] at the
587
95% confidence level, showing that the combination of positive
588
zonal winds in the basin and vertical diffusion in the deep valley
589
accounts for most dry deposition episodes (top right corner box
590
in Figure 11b). It is worth noting that the contribution of each
591
tracer source in high deposition days follows the average
dis-592
tribution found in Figure 6b, with dominance from VZC, and
593
CND and PTA playing similar roles at round 20%. Conversely,
594
when both wind and Kzare low, almost no deposition occurs
595
(bottom left corner box in Figure 11b). For intermediate values
596
of the two variables, deposition is more scattered but remains
597
within median values. A corollary of this strong correlation is
598
that the detachment of pollutants from the surface is driven by
599
mixing and turbulence processes deep in the valleys network,
600
rather than by organized circulation patterns.
601 KU= KS GA× US T GO = min(< KzS GA>14−20; 3) × min(< u2S T GO>14−20; 1) (1) 5. Discussion 602
Although this study looks into one particular month, there are
603
reasons to believe that the results are more general. Indeed,
Fig-604
ure A.1 shows that July 2015 is climatologically relevant given
605
the usual character of its meteorological conditions for winter
606
months. Besides, although a quantitative analysis is performed
607
specifically for July 2015, the qualitative results determining
608
the critical meteorological variables and the pathways
associ-609
ated with export and deposition of pollutants on the cordillera
610
can be generalized to all winter months. In addition, the
year-611
to-year variability in BC emissions is not significant for
Santi-612
ago at the monthly level, except for particular peak events such
613
as the ones described in Lapere et al. (2020). However those
614
peak events occur at night so that air masses cannot be exported
615
into the Andean canyons. Traffic and residential heating
pro-616
vide most of the BC. The former does not change much from
617
year-to-year and the latter is mainly connected to outside
tem-618
peratures, for which July 2015 is not an outlier. Thus, the
mag-619
nitude of exported and deposited BC on the cryosphere every
620
year is likely around the estimate given in Section 3.1 for dry
621
deposition. Wet deposition might be more variable from one
622
year to another. The pathways identified here for a particular
623
valley likely apply for other valleys in the area, although this
624
calls for further research.
625
The present work focuses on wintertime conditions because
626
they combine high BC emissions due to residential heating
627
with wood burning, and a large extent of snow covered areas.
628
However, it is worth briefly discussing what could be expected
629
for other seasons in terms of export pathways and deposition.
630
May/June/July/August concentrate most of the annual
precipi-631
tation in Central Chile with an average 59 mm month−1while
632
November/December/January/February only see precipitation
633
of 3.5 mm month−1on average in downtown Santiago (data for
634
the period 1950-2019 from the CR2 database for station Quinta
635
Normal- see Section 2.1 for the data source). As a result, wet
636
deposition is not expected to be a recurring process of export
637
and removal of BC from the atmosphere in spring and
sum-638
mer seasons. Regarding atmospheric export and dry
deposi-639
tion, the warmer periods of the year feature a more turbulent
640
atmosphere, with a much deeper mixing layer. A consequence
641
is the greater ability for BC particles to be exported higher up
642
and reach more elevated areas so far as to travel over the
An-643
des towards Argentina more easily. On the other hand, more
644
turbulence means that a larger fraction of BC is also brought
645
back to the ground by downdrafts, and that the mountain-valley
646
circulation might be overcome by these turbulent motions
mak-647
ing deposition on the Andes less periodic. Again this is just a
648
glimpse at what we expect since other seasons are not within
649
the scope of this work, but these are the features that should be
650
investigated.
651
To obtain the deposition rate estimate, a 5 km resolution
652
chemistry-transport simulation is performed. Such a
resolu-653
tion is relatively coarse given the sharp orography of the studied
654
area. Valleys are not necessarily well reproduced, and mountain
655
ranges are flattened, appearing lower than they are because of
656
sub-grid averaging. Nevertheless, Section 2.2 showed that the
performance of the model is still good, and in particular it has
658
the ability to capture well the deposition rate of BC on snow
659
measured at an Andean site. Still, the quantitative results from
660
simulation CC5 are not to be taken as definitive, but we have
661
good confidence that the order of magnitude is realistic. This
662
is only a first step and more work needs to be done, but the
re-663
sults obtained so far show that the model reproduces deposition
664
fluxes and that the approach is promising to extend them and to
665
examine other valleys and periods of the year.
666
Throughout the study, the idea emerged that the conditions
667
preventing BC deposition on the Andes are the ones that lead to
668
high urban pollution in the city and vice versa (coastal lows
669
strengthening inversions versus enhanced zonal winds).
Al-670
though a qualitative explanation was given, it is also possible to
671
quantify this relationship with the CHIMERE simulation data.
672
In the model outputs, the correlation between the daily
aver-673
age BC concentration at IND location (downtown Santiago
-674
see Figure 2), and the daily average deposition of BC on the
675
target area is -0.58 [-0.63;-0.51] at the 95% level. This
num-676
ber illustrates the idea that urban pollution and deposition on
677
the cryosphere are anti-correlated despite their sharing the same
678
sources. This phenomenon is explained by the fact that if the
679
meteorological conditions do not allow for the export of
pollu-680
tants (i.e. no wind and/or presence of a coastal low) then
partic-681
ulate matter accumulates over Santiago without the possibility
682
of export. A result of such conditions is (i) high concentrations
683
of pollutants in Santiago due to accumulation (ii) no
deposi-684
tion on the glaciers for the period that follows because
pollu-685
tants are not able to export and remain above the urban area and
686
hence cannot reach the Andes. More favorable export
condi-687
tions result in the exact opposite with a renewal of air masses in
688
Santiago when polluted ones are exported, thus explaining the
689
observed anti-correlation.
690
6. Conclusions
691
In wintertime, light-absorbing particles such as BC are
mas-692
sively emitted in the metropolitan area of Santiago.
Measure-693
ments in the literature show significant amounts of BC in snow
694
in the Andes near Santiago, but the contribution of the city was
695
never estimated. Based on chemistry-transport simulations, we
696
show that urban emissions can contribute to up to 40% of BC
697
deposition on southeastern snow or ice-covered areas of the
698
Central Andes, corresponding to 200 µg m−2 for the month of
699
July 2015, with a potential dramatic radiative impact. Despite
700
rather stable conditions in wintertime, we show that an essential
701
role is played by up-slope winds, i.e. mostly zonal winds, in the
702
afternoon, that carry polluted air masses deep inside the Maipo
703
and Mapocho canyons. If the vertical motions in the valley
al-704
low for the export of these polluted masses, they can then access
705
higher elevations and deposit on the snowpack and glaciers.
706
Quantitatively speaking, as soon as zonal winds over
Santi-707
ago exceed 1 m s−1 on average in the afternoon, and the
ver-708
tical diffusion coefficient at the tip of the Maipo valley is higher
709
than 3 m2s−2, large amounts of BC are expected to deposit on
710
snow or ice-covered areas. Contrarily, large scale strengthening
711
of easterlies over the Andes, as generated during coastal lows
712
and associated with enhanced subsidence, are linked with
de-713
creased export and deposition of pollution towards the
moun-714
tains. All districts of the Metropolitan Area do not have the
715
same influence on air masses reaching the Andes. As a result,
716
great attention must be paid to emission control policies in this
717
respect. Finally, we show that urban pollution and deposition
718
on the cryosphere are anti-correlated: large BC concentrations
719
at downtown Santiago coincide in general with weak
deposi-720
tion fluxes on the target area and vice versa. These results
721
provide additional information to enrich mitigation policies
al-722
lowing them not only design measures improving air quality in
723
Santiago but also to mitigate the urban impact on the nearby
724
cryosphere. Although the present study focuses on the area
725
of Santiago, such a configuration involving large urban basins
726
close to the Andean slopes can be found at numerous latitudes
727
along the cordillera. As a result, our conclusions provide a basis
728
to guide further investigation, over a broader area, particularly
729
in the context of the critical need for a thoroughly-informed
730
management of water resources in all Andean countries.
731
Declaration of competing interests
The authors declare that they have no known competing fi-nancial interests or personal relationships that could have ap-peared to influence the work reported in this paper.
Acknowledgments
The chemistry-transport simulations used in this work were performed using the high-performance computing resources of TGCC (Tr`es Grand Centre de Calcul du CEA) under the
allo-cation GEN10274 provided by GENCI (Grand ´Equipement
Na-tional de Calcul Intensif). NH was partially funded by FONDE-CYT Regular project 1181139 and Research and Innovation programs under grant agreement no 870301 (AQ-WATCH). NH acknowledges the support of project ANID-PIA-Anillo INACH ACT192057 and MAP-AQ which is an IGAC and WMO spon-sored activity. The research leading to these results has received funding from the European Union H2020 program PAPILA (GA 777544). Measurements at VZC were possible with the collaboration of Colegio Almenar del Maipo. The authors ac-knowledge the precious comments and suggestions of the two anonymous reviewers and the editor.
Authors contributions
NH provided the 2015 campaign data and analysis. As de-velopers of CHIMERE, LM and SM supervised the chemistry transport simulations and analyses of the results. RL performed the conceptualization, data analysis and model simulations, and coordinated the writing of the paper with LM, SM and NH.
Code availability
The CHIMERE model used can be found at http://www. lmd.polytechnique.fr/chimere/CW-download.php (last
access 28 April 2020). The WRF model used can be found at http://www2.mmm.ucar.edu/wrf/users/download/get_ source.html (last access 28 April 2020).
Data availability
Surface observation data used in this study are avail-able at https://sinca.mma.gob.cl/index.php/region/ index/id/M (last access 28 April 2020). HTAP raw emis-sion inventory can be downloaded at http://edgar.jrc.ec. europa.eu/htap_v2/ (last access 28 April 2020). Other data can be made available from the corresponding author upon rea-sonable request.
References
F. Barraza, F. Lambert, H. Jorquera, A. M. Villalobos, and L. Gallardo. Temporal evolution of main ambient PM2.5 sources in Santiago, Chile,
from 1998 to 2012. Atmos. Chem. Phys., 17:10093–10107, 2017. doi: 10.5194/acp-17-10093-2017.
F. Cereceda-Balic, M. R. Palomo-Mar´ın, E. Bernalte, V. Vidal, J. Christie, X. Fadic, J. L. Guevara, C. Miro, and E. Pinilla Gil. Impact of Santiago de Chile urban atmospheric pollution on anthropogenic trace elements en-richment in snow precipitation at Cerro Colorado, Central Andes. Atmos. Environ., 47:51–57, 2011. doi: 10.1016/j.atmosenv.2011.11.045.
A. M. Cordova, J. Ar´evalo, J. C. Mar´ın, D. Baumgardner, G. B. Raga, D. Pozo, C. A. Ochoa, and R. Rondanelli. On the Transport of Urban Pollution in an Andean Mountain Valley. Aerosol Air Qual. Res., 16:593–605, 2015. doi: 10.4209/aaqr.2015.05.0371.
H. Di´emoz, F. Barnaba, T. Magri, G. Pession, D. Dionisi, S. Pittavino, I. K. F. Tombolato, M. Campanelli, L. S. Della Ceca, M. Hervo, L. Di Liberto, L. Ferrero, and G. P. Gobbi. Transport of Po Valley aerosol pollution to the northwestern Alps - Part 1: Phenomenology. Atmos. Chem. Phys., 19: 3065–3095, 2019a. doi: 10.5194/acp-19-3065-2019.
H. Di´emoz, G. P. Gobbi, T. Magri, G. Pession, S. Pittavino, I. K. F. Tombolato, M. Campanelli, and F. Barnaba. Transport of Po Valley aerosol pollution to the northwestern Alps - Part 2: Long-term impact on air quality. Atmos. Chem. Phys. Discuss, submitted, 2019b. doi: 10.5194/acp-19-10129-2019. M. A. Friedl, D. Sulla-Menashe, B. Tan, A. Schneider, N. Ramankutty, A. Sib-ley, and X. Huang. MODIS Collection 5 global land cover: Algorithm re-finements and characterization of new datasets, 2001-2012, Collection 5.1 IGBP Land Cover, 2010. URL http://lpdaac.usgs.gov.
R. D. Garreaud. The Andes climate and weather. Adv. Geosci., 22:3–11, 2009. doi: 10.5194/adgeo-22-3-2009.
R. D. Garreaud, J. A. Ruttlant, and H. Fuenzalida. Coastal Lows along the Sub-tropical West Coast of South America: Mean Structure and Evolution. Mon. Weather Rev., 130:75–88, 2002. doi: 10.1175/1520-0493(2002)130h0075: CLATSWi2.0.CO;2.
R. D. Garreaud, C. Alvarez-Garreton, J. Barichivich, J. P. Boisier, D. Christie, M. Galleguillos, C. LeQuesne, J. McPhee, and M. Zambrano-Bigiarini. The 2010-2015 megadrought in central Chile: impacts on regional hydroclimate and vegetation. Hydrol. Earth Syst. Sci., 21:6307–6327, 2017. doi: 10.5194/ hess-21-6307-2017.
R. D. Garreaud, J. P. Boisier, R. Rondanelli, A. Montecinos, H. H. Sep´ulveda, and D. Veloso-Aguila. The Central Chile Mega Drought (2010-2018): A climate dynamics perspective. Int. J. Climatol., 40:421–439, 2019. doi: 10.1002/joc.6219.
E. Gramsch, A. Mu˜noz, J. Langner, L. Morales, C. Soto, P. P´erez, and M. A. Rubio. Black carbon transport between Santiago de Chile and glaciers in the Andes Mountains. Atmos. Environ., 232:117546, 2020. doi: 10.1016/j. atmosenv.2020.117546.
S. Henne, M. Furger, S. Nyeki, M. Steinbacher, B. Neininger, S. F. J. de Wekker, J. Dommen, N. Spichtinger, A. Stohl, and A. S. H. Pr´evˆot. Quantification of topographic venting of boundary layer air to the free troposphere. Atmos. Chem. Phys., 4:497–509, 2004. doi: 10.5194/acp-4-497-2004.
R. Hock, G. Rasul, C. Adler, B. C´aceres, S. Gruber, Y. Hirabayashi, M. Jackson, A. K¨a¨ab, S. Kang, S. Kutuzov, A. Milner, U. Molau, S. Morin, B. Orlove, and H. Steltzer. High Mountain Areas. In: IPCC Special Report on the Ocean and Cryosphere in a Changing Climate [H.-O. P¨ortner, D. C. Roberts, V. Masson-Delmotte, P. Zhai, M. Tignor, E. Poloczanska, K. Mintenbeck, A. Alegr´ıa, M. Nicolai, A. Okem, J. Petzold, B. Rama, N. M. Weyer (eds.)]. In press., 2019.
H. A. Holmes, J. K. Sriramasamudram, E. R. Pardyjak, and C. D. White-man. Turbulent Fluxes and Pollutant Mixing during Wintertime Air Pollu-tion Episodes in Complex Terrain. Environ. Sci. Technol., 49:13206–13214, 2015. doi: 10.1021/acs.est.5b02616.
G. Janssens-Maenhout, M. Crippa, D. Guizzardi, F. Dentener, M. Muntean, G. Pouliot, T. Keating, Q. Zhang, J. Kurokawa, R. Wankm¨uller, H. Denier van der Gon, J. J. P. Kuenen, Z. Klimont, G. Frost, S. Darras, B. Koffi, and M. Li. HTAPv2.2: a mosaic of regional and global emission grid maps for 2008 and 2010 to study hemispheric transport of air pollution. Atmos. Chem. Phys., 15:11411–11432, 2015. doi: 10.5194/acp-15-11411-2015. S. Kang, Y. Zhang, Y. Qian, and H. Wang. A review of black carbon in snow
and ice and its impact on the cryosphere. Earth-Sci. Rev., page In press, 2020. doi: 10.1016/j.earscirev.2020.103346.
M. Kossmann, U. Corsmeier, S. F. J. De Wekker, F. Fiedler, R. V¨ogtlin, N. Kalthoff, H. G¨usten, and B. Neininger. Observations of handover pro-cesses between the atmospheric boundary layer and the free troposphere over mountainous terrain. Contributions to Atmospheric Physics, 72:329– 350, 1999.
R. Lapere, L. Menut, S. Mailler, and N. Huneeus. Soccer games and record breaking PM2.5pollution events in Santiago, Chile. Atmos. Chem. Phys.,
20:4681–4694, 2020. doi: 10.5194/acp-20-4681-2020.
S. Mailler, L. Menut, D. Khvorostyanov, M. Valari, F. Couvidat, G. Siour, S. Turquety, R. Briant, P. Tuccella, B. Bessagnet, A. Colette, L. L´etinois, K. Markakis, and F. Meleux. CHIMERE-2017: from urban to hemispheric chemistry-transport modeling. Geosci. Model Dev., 10:2397–2423, 2017. doi: 10.5194/gmd-10-2397-2017.
M. M´en´egoz, G. Krinner, Y. Balkanski, A. Cozic, O. Boucher, and P. Ciais. Bo-real and temperate snow cover variations induced by black carbon emissions in the middle of the 21st century. The Cryosphere, 7:537–554, 2013. doi: 10.5194/tc-7-537-2013.
M. M´en´egoz, G. Krinner, Y. Balkanski, O. Boucher, A. Cozic, S. Lim, P. Ginot, P. Laj, H. Gall´ee, P. Wagnon, A. Marinoni, and H. W. Jacobi. Snow cover sensitivity to black carbon deposition in the Himalayas: from atmospheric and ice core measurements to regional climate simulations. Atmos. Chem. Phys., 14:4237–4249, 2014. doi: 10.5194/acp-14-4237-2014.
L. Menut, B. Bessagnet, D. Khvorostyanov, M. Beekmann, N. Blond, A. Co-lette, I. Coll, G. Curci, G. Foret, A. Hodzic, S. Mailler, F. Meleux, J.-L. Monge, I. Pison, G. Siour, S. Turquety, M. Valari, R. Vautard, and M. G. Vivanco. CHIMERE 2013: a model for regional atmospheric composition modelling. Geosci. Model Dev., 6:981–1028, 2013. doi: 10.5194/gmd-6-981-2013.
J. Ming, C. Xiao, Z. Du, and X. Yang. An overview of black carbon deposition in High Asia glaciers and its impacts on radiation balance. Advances in Water Resources, 55:80–87, 2012. doi: 10.1016/j.advwatres.2012.05.015. L. T. Molina, L. Gallardo, M. Andrade, D. Baumgardner, M. Borbor-C´ordova,
R. B´orquez, G. Casassa, F. Cereceda-Balic, L. Dawidowski, R. Garreaud, N. Huneeus, F. Lambert, J. L. McCarty, J. Mc Phee, M. Mena-Carrasco, G. B. Raga, C. Schmitt, and J. P. Schwarz. Pollution and its impacts on the South American Cryosphere (PISAC). Earth’s Future, 3:345–369, 2015. doi: 10.1002/2015EF000311.
R. C. Mu˜noz, L. Armi, J. A. Rutllant, M. Falvey, C. D. Whiteman, R. D. Gar-reaud, A. Arriagada, F. Flores, and N. Donoso. Raco Wind at the Exit of the Maipo Canyon in Central Chile: Climatology, Special Observations, and Possible Mechanisms. J. Appl. Meteor. Climatol., 59:725–749, 2020. doi: 10.1175/JAMC-D-19-0188.1.
NCEP. NCEP FNL Operational Model Global Tropospheric Analyses, continu-ing from July 1999, 2000. URL https://doi.org/10.5065/D6M043C6. F. Pellicciotti, S. Ragettli, M. Carenzo, and J. McPhee. Changes of glaciers in the Andes of Chile and priorities for future work. Sci. Tot. Environ., 493: 1197–1210, 2013. doi: 10.1016/j.scitotenv.2013.10.055.
P. M. Rowe, R. R. Cordero, S. G. Warren, E. Stewart, S. J. Doherty, A. Pankow, M. Schrempf, G. Casassa, J. Carrasco, J. Pizarro, S. MacDonell, A. Dami-ani, F. Lambert, R. Rondanelli, N. Huneeus, F. Fernandoy, and S. Neshyba. Black carbon and other light-absorbing impurities in snow in the Chilean