HAL Id: hal-00295975
https://hal.archives-ouvertes.fr/hal-00295975
Submitted on 10 Jul 2006
HAL is a multi-disciplinary open access
archive for the deposit and dissemination of
sci-entific research documents, whether they are
pub-lished or not. The documents may come from
teaching and research institutions in France or
abroad, or from public or private research centers.
L’archive ouverte pluridisciplinaire HAL, est
destinée au dépôt et à la diffusion de documents
scientifiques de niveau recherche, publiés ou non,
émanant des établissements d’enseignement et de
recherche français ou étrangers, des laboratoires
publics ou privés.
two measurement sites in Northern Finland
M. Komppula, S.-L. Sihto, H. Korhonen, H. Lihavainen, V.-M. Kerminen, M.
Kulmala, Y. Viisanen
To cite this version:
M. Komppula, S.-L. Sihto, H. Korhonen, H. Lihavainen, V.-M. Kerminen, et al.. New particle
for-mation in air mass transported between two measurement sites in Northern Finland. Atmospheric
Chemistry and Physics, European Geosciences Union, 2006, 6 (10), pp.2811-2824. �hal-00295975�
www.atmos-chem-phys.net/6/2811/2006/ © Author(s) 2006. This work is licensed under a Creative Commons License.
Chemistry
and Physics
New particle formation in air mass transported between two
measurement sites in Northern Finland
M. Komppula1, S.-L. Sihto2, H. Korhonen1, H. Lihavainen1, V.-M. Kerminen1, M. Kulmala2, and Y. Viisanen1 1Finnish Meteorological Institute, Research and Development, P. O. Box 503, 00101 Helsinki, Finland
2University of Helsinki, Dept. Physical Sciences, P. O. Box 64, 00014 Univ. of Helsinki, Finland
Received: 5 October 2005 – Published in Atmos. Chem. Phys. Discuss.: 22 November 2005 Revised: 9 March 2006 – Accepted: 15 June 2006 – Published: 10 July 2006
Abstract. This study covers four years of aerosol number
size distribution data from Pallas and V¨arri¨o sites 250 km apart from each other in Northern Finland and compares new particle formation events between these sites. In air masses of eastern origin almost all events were observed to start ear-lier at the eastern station V¨arri¨o, whereas in air masses of western origin most of the events were observed to start ear-lier at the western station Pallas. This demonstrates that par-ticle formation in a certain air mass type depends not only on the diurnal variation of the parameters causing the phe-nomenon (such as photochemistry) but also on some proper-ties carried by the air mass itself. The correlation in growth rates between the two sites was relatively good, which sug-gests that the amount of condensable vapour causing the growth must have been at about the same level in both sites. The condensation sink was frequently much higher at the downwind station. It seems that secondary particle forma-tion related to biogenic sources dominate in many cases over the particle sinks during the air mass transport between the sites. Two cases of transport from Pallas to V¨arri¨o were fur-ther analysed with an aerosol dynamics model. The model was able to reproduce the observed nucleation events 250 km down-wind at V¨arri¨o but revealed some differences between the two cases. The simulated nucleation rates were in both cases similar but the organic concentration profiles that best reproduced the observations were different in the two cases indicating that divergent formation reactions may dominate under different conditions. The simulations also suggested that organic compounds were the main contributor to new particle growth, which offers a tentative hypothesis to the dis-tinct features of new particles at the two sites: Air masses ar-riving from the Atlantic Ocean typically spent approximately only ten hours over land before arriving at Pallas, and thus the time for the organic vapours to accumulate in the air and Correspondence to: M. Komppula
(mika.komppula@fmi.fi)
to interact with the particles is relatively short. This can lead to low nucleation mode growth rates and even to suppression of detectable particle formation event due to efficient scav-enging of newly formed clusters, as was observed in the case studies.
1 Introduction
Atmospheric aerosol particles have large impacts on the global cloud albedo, radiative forcing, ozone layer, acid rain and visibility (Seinfeld and Pandis, 1998; Jacobson, 2001; Lohmann and Feichter, 2005). Uncertainties in the estima-tion of direct and indirect aerosol effects on the global cli-mate are large. These uncertainties are greatly due to the lack of information on the spatial and temporal distribution and optical properties of aerosol particles, as well as due to our poor understanding on how aerosol particles interact with clouds (Adams and Seinfeld, 2002; Kaufman et al., 2002).
New particle formation is a major research issue in atmo-spheric sciences. Particle formation increases the total num-ber concentration of ambient submicron particles and may contribute to the climate forcing. Earlier measurements in Northern Finland have shown that atmospheric new particle formation can be a significant source of ultrafine (<100 nm) particles (Lihavainen et al., 2003; Vehkam¨aki et al., 2004; Kerminen et al., 2005). It has also been observed that ul-trafine particles have a significant influence on cloud droplet activation under clean and moderately polluted conditions, being therefore important when estimating the indirect cli-matic effects by aerosols (Komppula et al., 2005). Since at-mospheric new particle formation is observed in most atmo-spheric environments (Kulmala et al., 2004a), it is important to find out its global contribution to indirect climatic effects. Formation and growth mechanisms of aerosol particles are still not fully understood. The geographical extent of particle formation events and conditions affecting these events are
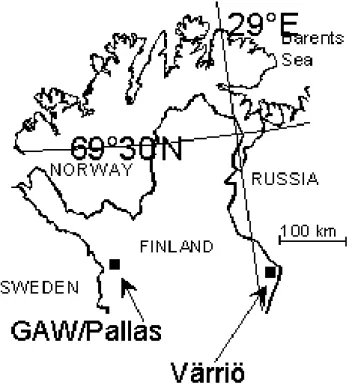
Figure 1. Location of the measurement sites, Pallas and Värriö.
23
Fig. 1. Location of the measurement sites, Pallas and V¨arri¨o.
not well known, though some progress has been made (Kul-mala et al., 2004a). In Northern Finland, there are two sta-tions, Pallas and V¨arri¨o, which are separated from each other by 250 km and have a similar kind of instrumentation for aerosol particle measurements. This gives us a good oppor-tunity to investigate the similarities and difference in parti-cle formation events between the two sites, the geographical extent of this phenomenon and the influence of atmospheric conditions on it. The effect of particle sources and sinks be-tween the two sites can be investigated.
This study covers four years of data from Pallas and V¨arri¨o and compares new particle formation events between these sites. A seasonal variation of some parameters related to new particle formation is presented. The effects of the air mass origin and transport direction on particle formation and its intensity are studied. Main parameters related to parti-cle formation are compared between the two sites. An ef-fort is made to model new particle formation in the V¨arri¨o site based on size distributions measured in the Pallas site. Modelling results are presented as two case studies. Our in-vestigations were related to the LAPBIAT-project, particu-larly the campaign performed in V¨arri¨o SMEAR I station in April–May, 2003.
2 Materials and methods
2.1 Site description
Both stations, Pallas and V¨arri¨o, are located in a subarctic re-gion in Northern Finland (Fig. 1). There are practically no lo-cal sources of pollutants close to the stations. The closest ma-jor pollutant sources are the smelters in Nikel and Montshe-gorsk in Kola Peninsula, Russia, located 200 km to the north and 140 km to the east of the V¨arri¨o station, respectively.
The main measuring site at Pallas GAW (Global Atmo-sphere Watch) station, Sammaltunturi (67◦580N, 24◦070E, WMO index number 05821), lies on a top of a fjeld (arc-tic round-topped hill) at the height of 565 m above the sea level (a.s.l.), and ca 300 m above the surrounding area. The tree line is some 100 m below the station. The surround-ing forest is mixed pine, spruce and birch. The vegetation on the top of the fjeld is sparse, consisting mainly of low vascular plants, moss and lichen. The station is within the Pallas-Ounastunturi National Park (total area 501 km2)near the northern limit of the boreal forest zone. A detailed de-scription on the site is given in Hatakka et al. (2003).
The V¨arri¨o environmental measurement station SMEAR I (67◦460N, 29◦350E) (Hari et al., 1994; Ahonen et al., 1997)
is located 250 kilometres away and almost directly to the east of Pallas. The station is ten kilometres away from the Rus-sian border at the height of 390 m a.s.l. The station is located just below the alpine timber line, which is about 400 m a.s.l. The main tree species in the area is Scots pine. The station area belongs to the V¨arri¨o National Park.
2.2 Measurements
Similar DMPS (Differential Mobility Particle Sizer) systems were used at both measuring sites for nanometre particle siz-ing. The DMPS systems consist of a 28-cm long Hauke-type differential mobility analyzer (DMA) (Winklmayr et al., 1991) with a closed loop sheath flow arrangement (Joki-nen and M¨akel¨a, 1997) and a condensation particle counter (CPC), TSI model 3010. The closed loop sheath air is dried with a silica gel dryer and the relative humidity is kept be-low 20%. This sheath air setup keeps also the temperature more constant. Before sizing, the aerosol is neutralized with a radioactive source. The used sheath air flow rate is about 11 l min−1and the sample aerosol flow rate is 1 l min−1. The
measured particle size range is from 7 to 500 nm, which is divided into 30 discrete bins at Pallas and 20 bins at V¨arri¨o. Size distribution measurements at V¨arri¨o were extended to cover a size range from 3 nm to 500 nm, using 24 size bins on 26 April 2003. This was done by using a Twin-DMPS system (e.g. Kulmala et al., 2001).
Basic weather parameters and a number of trace gases were measured. Temperature, pressure, relative humidity, wind speed and global radiation were measured at both sta-tions. At Pallas there was a rain intensity sensor and at V¨arri¨o
an on/off-type rain sensor. Visibility measurements at Pallas have revealed the occasional presence of fog or low clouds at the station (Komppula et al., 2003a; Komppula et al., 2005). NOxand SO2concentrations were measured at both stations.
One-hour averages of these gas concentrations were used in the analyses.
The new DMPS data analysed in this article covered a pe-riod of 24 months, years 2002 and 2003. In the analysis of different air masses also data from previously analysed years 2000–2001 was used. Various parameters describing the new particle formation events, including trace gas concentrations and weather-related parameters were compared. 120-h back-ward trajectories were calculated by FLEXTRA (Stohl et al., 1995) and Hysplit 4 (Draxler and Rolph, 2003) to find the origin and the path of the air masses. FLEXTRA trajectories were calculated for every three hours for both sites.
2.3 Identification of particle formation events
A new particle formation event can be visualized with a sur-face plot, in which the submicron particle size distribution is presented as a function of time (M¨akel¨a et al., 1997; Kulmala et al., 1998). An event is seen as increasing particle concen-trations in smallest size channels of the DMPS system. On a typical particle formation day, newly-formed particles en-ter the measurement range at around midday at initial sizes below 15 nm. During the rest of the day subsequent growth of these particles is seen at a rate of a few nanometres per hour. Events are classified according to their intensity into three classes. Class 1 events have intense formation of new particles and distinct particle growth for hours during the rest of the day. Class 2 events are not that intense or the subse-quent growth is not as clear but still these main features can be recognized. Class 3 events lack the clear growth or only few new particles are formed. Classifying between a parti-cle formation event and non-event is sometimes difficult and somewhat subjective. The classification method applied here has been explained in more detail by M¨akel¨a et al. (2000).
Particle formation events were observed from daily sur-face plots by visually searching for sudden increases in the number of smallest particles and subsequent growth. The event-specific averages over each event were estimated from the size distributions for the particle formation rate (parti-cles cm−3s−1)and particle growth rate (nm h−1). Particle formation days were mainly examined with a program made for this purpose at the University of Helsinki (M¨akel¨a et al., 2000). The starting and ending times of the events and the number of new particles formed during the event were anal-ysed. Defining the starting and ending times for an event is sometimes difficult due to fluctuations in the smallest size classes of the measurement system and due to measurement uncertainties. The presence of pre-existing particles affect-ing the condensation sink (CS) just before the formation event was also a point of interest. The condensation sink de-termines how rapidly molecules condense onto pre-existing
aerosols and depends strongly on the shape of the particle size distribution (Pirjola et al., 1999). A detailed calculation procedure for the condensation sink has been presented by Kulmala et al. (2001). The condensable vapour concentration required for the observed average particle growth rate during each particle formation event was estimated. In addition the source rate of condensable vapour required to sustain the ob-served growth was estimated for each event as presented by Kulmala et al. (2001).
2.4 Simulation setup
The size-segregated aerosol dynamics model UHMA (Uni-versity of Helsinki Multicomponent Aerosol model) (Korho-nen et al., 2004) can be used for Lagrangian studies of the tropospheric aerosol particles. The model includes the ma-jor clear sky processes: multicomponent condensation of or-ganic and inoror-ganic species (Grini et al., 2005), coagulation, new particle formation through nucleation and primary emis-sions, dry deposition as well as a simple treatment of entrain-ment and detrainentrain-ment. Recently the model has been extended to treat cloud processing in non-precipitating clouds (Korho-nen et al., 2005).
In the current study, the model was applied to two case studies to investigate nucleation and particle growth in air masses travelling from Pallas to V¨arri¨o measurement site. The air mass trajectory information was obtained from NOAA ARL trajectory model Hysplit 4 (Draxler and Rolph, 2003). The meteorological conditions (temperature, pres-sure, relative humidity, boundary layer height) for the model were interpolated from the calculated trajectory data. The particle size distribution and SO2concentration measured at
Pallas were used as model input and the modelled results were compared to similar measurements made at V¨arri¨o. The nucleation rate of particles and the concentration profile of condensable organic vapours, neither of which is directly available from measurements, were treated as follows.
In boreal forest conditions, organic compounds dominate the growth of the nucleation mode particles while conden-sation of sulphuric acid has been estimated to explain only about 10% of new particle growth rate (Boy et al., 2005). So far the knowledge of the chemical identity of the low-volatile organics responsible for particle growth is quite lim-ited; however, it is likely that in boreal forest these low-volatile organics are oxidation products of forest-emitted species, such as terpenes (Kavouras et al., 1998) or isoprene (Kourtchev et al., 2005). Since the exact oxidation mecha-nisms of the condensable products are unknown, we tested several possible production profiles which either remained constant throughout the day or followed the diurnal concen-tration of the atmospheric oxidants. For the saturation con-centration of the condensable organic vapour we assumed a value 106cm−3, which has been suggested by Kulmala et al. (2004b) based on modelling studies of new particle for-mation in boreal forests. The onset of the condensation of
0 5 10 15 20 25
Jan Feb Mar Apr May Jun Jul Aug Sep Oct Nov Dec
Month N u m b er o f eve n ts Pallas Värriö
Figure 2. Monthly distribution of all new particle formation events observed in Pallas and in Värriö during years 2002-2003.
24
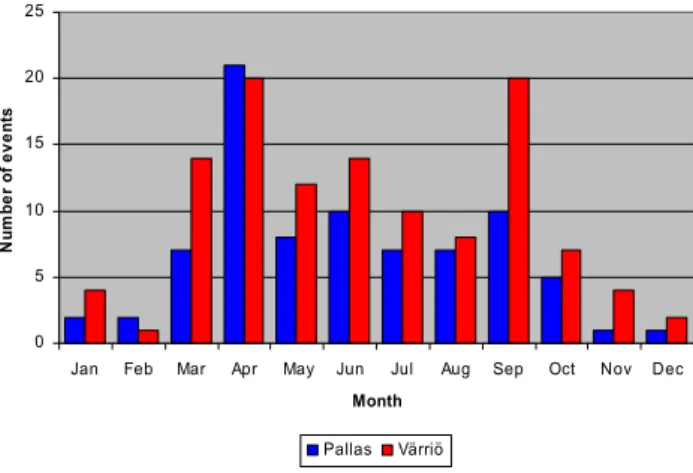
Fig. 2. Monthly distribution of all new particle formation events
observed in Pallas and in V¨arri¨o during years 2002–2003.
the organic compound followed the nano-K¨ohler mechanism suggested by Kulmala et al. (2004b).
Sulphuric acid concentration was calculated from mea-sured SO2concentrations (measurements both at Pallas and
V¨arri¨o stations) and estimated OH concentrations. The maxi-mum concentration of sulphuric acid obtained from this pro-cedure was 1–6×106cm−3, corresponding well with mea-surements made at other rural or remote locations (Weber et al., 1997; Birmili et al., 2003; Mauldin et al., 2003; Boy et al., 2005). We calculated also the total concentration of con-densing vapours (sulphate and organics) from the measured growth rate based on the expression presented by Kulmala et al. (2001), and the maximum of the organic vapour concen-tration in the simulations was adjusted accordingly.
Based on a review of an extensive set of field measure-ments, Kulmala et al. (2004a) concluded that sulphuric acid is a very likely candidate to take part in tropospheric nu-cleation. The exact nucleation mechanism remains, how-ever, unidentified and therefore we described nucleation in our simulations by simply scaling the kinetic rate of nucle-ation, i.e. the collision rate between two ammonium bisul-phate molecules, to produce the observed intensity of the new particle formation event. While this procedure does not di-rectly correspond to any specific physical nucleation mech-anism, it enables comparison between the studied cases as it relates the nucleation rate to the calculated sulphuric acid concentration.
3 Results and discussion
In total close to four years of data on new particle formation events at Pallas and V¨arri¨o were studied. A seasonal varia-tion of parameters related to new particle formavaria-tion is pre-sented. The effects of the air mass origin on particle forma-tion and its intensity are studied. A comparison between the two sites is presented concerning the main parameters related
to particle formation in air masses of eastern and western ori-gin. One of the ideas of this study was to find out whether the physical properties of aerosol particles observed at the V¨arri¨o station can be generated from those observed at the Pallas station, or if something is taking place that we cannot explain. An effort is made to model new particle formation in the V¨arri¨o site based on size distributions measured in the Pallas site. Modelling results are presented as two case stud-ies.
3.1 Data analysis 3.1.1 Previous studies
In our earlier study (Komppula et al., 2003b), a compari-son between the sites was done with a dataset of 21 months (April 2000–December 2001). More than half (55%) of the new particle formation events were observed to occur at both sites during the same day. Most of the days when an event was observed at one of the sites only could be explained by pollution plumes, weather differences (mostly rain/fog) or by different air mass origins. The largest differences and vari-ation were seen in the starting times of the events. Average particle formation and growth rates were found to be sim-ilar at both sites. According to the trajectory analysis, all events were associated with marine/polar air masses originat-ing from the Northern Atlantic or the Arctic Ocean. It was also concluded that about one third of the events at V¨arri¨o were associated with plumes from the Kola Peninsula in-dustry, and it appears likely that some of these events were caused by nucleation involving H2SO4from SO2oxidation
in these industry plumes. On some days Pallas experienced also air masses from the Kola area, but it seems that the much longer distance from Kola to Pallas reduces the SO2
concen-trations to lower levels than what is needed to launch the nu-cleation process at Pallas. Overall the simultaneous events indicated that in clean air masses the geographical extent of a nucleation event could be at least 250 km, which is the dis-tance between the Pallas and V¨arri¨o stations.
Vehkam¨aki et al. (2004) studied particle formation events in V¨arri¨o during the period 1998–2002. They found in total 147 clear new particle formation events. As expected the frequency of occurrence was highest in spring (March–May). They found also that the particle formation and growth rates were uncorrelated. The growth rate was found to be highest during summer and lowest in winter. No seasonal variation in the formation rate was observed. The plumes from Kola industrial area were observed to result in higher formation rates but had no effect on the growth rate.
3.1.2 Additional new data – years 2002 and 2003
A new data period of 24 months (years 2002–2003) was taken to make a new comparison between the sites and fur-thermore to be combined with the earlier data (years 2000–
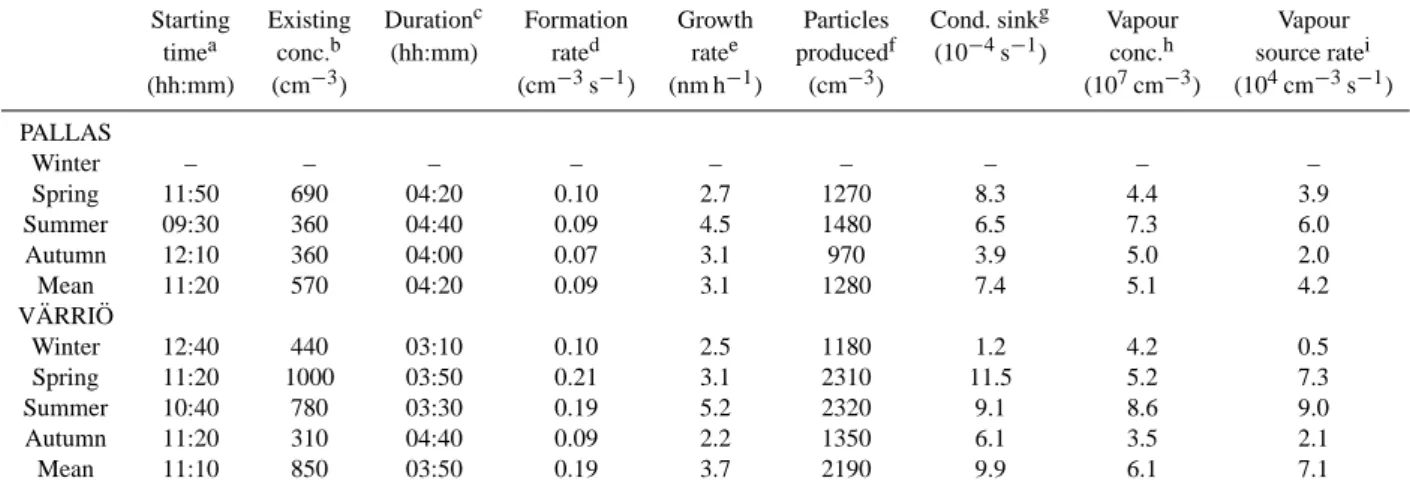
Table 1. Seasonal variation and annual average values of some parameters related to class 1 and 2 new particle formation events observed
during the years 2002–2003 in Pallas and in V¨arri¨o. (Winter values in Pallas are left out due to poor statistics). The formation and growth rate, condensation sink, vapour concentration and source rate are calculated from event-averages and then grouped according to season.
Starting Existing Durationc Formation Growth Particles Cond. sinkg Vapour Vapour timea conc.b (hh:mm) rated ratee producedf (10−4s−1) conc.h source ratei (hh:mm) (cm−3) (cm−3s−1) (nm h−1) (cm−3) (107cm−3) (104cm−3s−1) PALLAS Winter – – – – – – – – – Spring 11:50 690 04:20 0.10 2.7 1270 8.3 4.4 3.9 Summer 09:30 360 04:40 0.09 4.5 1480 6.5 7.3 6.0 Autumn 12:10 360 04:00 0.07 3.1 970 3.9 5.0 2.0 Mean 11:20 570 04:20 0.09 3.1 1280 7.4 5.1 4.2 V ¨ARRI ¨O Winter 12:40 440 03:10 0.10 2.5 1180 1.2 4.2 0.5 Spring 11:20 1000 03:50 0.21 3.1 2310 11.5 5.2 7.3 Summer 10:40 780 03:30 0.19 5.2 2320 9.1 8.6 9.0 Autumn 11:20 310 04:40 0.09 2.2 1350 6.1 3.5 2.1 Mean 11:10 850 03:50 0.19 3.7 2190 9.9 6.1 7.1
aStarting time of 7-nm particle formation; bPre-existing particle concentration at the time of start; cDuration of the formation event; dFormation rate of 7-nm particles;eGrowth rate of newly formed particles;fNew particles produced during the event;gCondensation sink
for vapour by existing particles;hVapour concentration needed for the observed growth;iVapour source rate needed to sustain the growth.
2001) in comparison of air mass differences. During years 2002–2003, 116 particle formation events were observed in V¨arri¨o and 81 events in Pallas. In 62% of all the event days at least some indication of particle formation was observed at both sites. This is in agreement with our previous study. The highest frequency of events occurred in April and Septem-ber (Fig. 2). Table 1 presents the seasonal variation related to class 1 and 2 new particle formation events observed dur-ing the years 2002–2003. Average values seem to be slightly higher in V¨arri¨o. V¨arri¨o had a slightly higher growth rate on average. The formation rate of 7-nm particles in V¨arri¨o was two times the value observed in Pallas. In V¨arri¨o more new particles were produced during the events on average. V¨arri¨o had also slightly higher pre-existing particle concentrations and CS. All this means that in V¨arri¨o a higher concentra-tion and higher source rate of condensable vapour is needed. Overall, the values are of about the same magnitude as ob-served in the earlier studies.
Seasonal variations of some parameters related to ob-served class 1 and 2 particle formation events are presented in Table 1. The starting time of particle formation (7 nm particles) was earliest in summer, following the annual pat-tern of sun rise. All class 1 and 2 events were observed to start between 07:00 and 16:40. The duration of these events seemed to have no seasonal pattern. The formation rate of 7 nm particles had no clear seasonal variation, though higher average values were observed in spring and summer in V¨arri¨o. A reasonable explanation for the higher values from March to July in V¨arri¨o would be the more frequent air masses from Kola industrial area. Observed formation
rates varied between 0.01 and 0.98 cm−3s−1. The growth rate had a similar seasonal pattern at both sites. The high-est growth rates were observed during summer. Growth rates varied from 0.1 to 9.0 nm h−1. The production of new par-ticles per event was highest in spring and summer at both sites. The condensation sink (and the pre-existing particle concentration) had slightly higher values in spring and sum-mer. This together with higher growth rates leads to higher vapour source rate needed in spring and summer. CS varied from 0.4 to 40×10−4s−1and the vapour source rate from 0.2 to 60×104cm−3s−1.
3.1.3 Particle formation in air masses of eastern and west-ern origin passing the two sites
In this analysis the whole four-year data set was used to get reasonable statistics. Air mass backward trajectories (120 h) were calculated for every 3 h for both sites. By using this set of trajectories, we selected all the cases in which the air had passed the Pallas site within 50 km in maximum prior to entering V¨arri¨o (western air masses), as well as cases de-scribing the air mass transport from V¨arri¨o to Pallas (eastern air masses).
A comparison of different parameters related to particle formation between the two sites in both western and eastern air masses is presented in Fig. 3. Altogether, 31 particle for-mation events took place in western air masses and 7 events took place in eastern air masses. In eastern air masses al-most all events were observed to start earlier at the eastern station V¨arri¨o, whereas in western air masses most of the
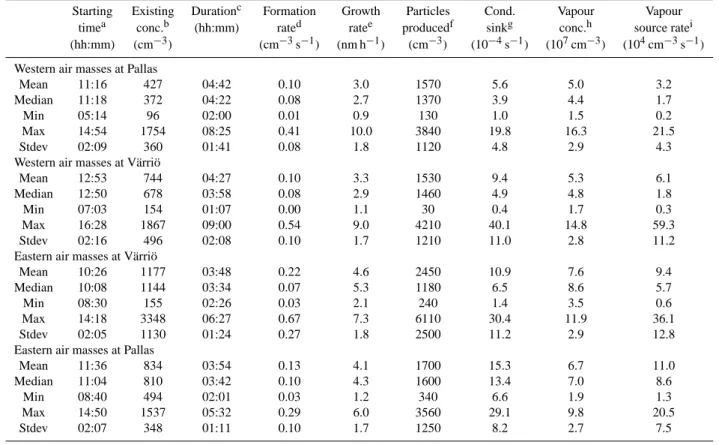
Table 2. Some parameters related to particle formation events observed on the same day at both sites during years the 2000–2003 classified
by the air mass origin. The formation and growth rate, condensation sink, vapour concentration and source rate are calculated from event-averages and then grouped according to air mass and location.
Starting Existing Durationc Formation Growth Particles Cond. Vapour Vapour timea conc.b (hh:mm) rated ratee producedf sinkg conc.h source ratei (hh:mm) (cm−3) (cm−3s−1) (nm h−1) (cm−3) (10−4s−1) (107cm−3) (104cm−3s−1)
Western air masses at Pallas
Mean 11:16 427 04:42 0.10 3.0 1570 5.6 5.0 3.2
Median 11:18 372 04:22 0.08 2.7 1370 3.9 4.4 1.7
Min 05:14 96 02:00 0.01 0.9 130 1.0 1.5 0.2
Max 14:54 1754 08:25 0.41 10.0 3840 19.8 16.3 21.5
Stdev 02:09 360 01:41 0.08 1.8 1120 4.8 2.9 4.3
Western air masses at V¨arri¨o
Mean 12:53 744 04:27 0.10 3.3 1530 9.4 5.3 6.1
Median 12:50 678 03:58 0.08 2.9 1460 4.9 4.8 1.8
Min 07:03 154 01:07 0.00 1.1 30 0.4 1.7 0.3
Max 16:28 1867 09:00 0.54 9.0 4210 40.1 14.8 59.3
Stdev 02:16 496 02:08 0.10 1.7 1210 11.0 2.8 11.2
Eastern air masses at V¨arri¨o
Mean 10:26 1177 03:48 0.22 4.6 2450 10.9 7.6 9.4
Median 10:08 1144 03:34 0.07 5.3 1180 6.5 8.6 5.7
Min 08:30 155 02:26 0.03 2.1 240 1.4 3.5 0.6
Max 14:18 3348 06:27 0.67 7.3 6110 30.4 11.9 36.1
Stdev 02:05 1130 01:24 0.27 1.8 2500 11.2 2.9 12.8
Eastern air masses at Pallas
Mean 11:36 834 03:54 0.13 4.1 1700 15.3 6.7 11.0
Median 11:04 810 03:42 0.10 4.3 1600 13.4 7.0 8.6
Min 08:40 494 02:01 0.03 1.2 340 6.6 1.9 1.3
Max 14:50 1537 05:32 0.29 6.0 3560 29.1 9.8 20.5
Stdev 02:07 348 01:11 0.10 1.7 1250 8.2 2.7 7.5
aStarting time of 7-nm particle formation; bPre-existing particle concentration at the time of start; cDuration of the formation event; dFormation rate of 7-nm particles;eGrowth rate of newly formed particles;fNew particles produced during the event;gCondensation sink
for vapour by existing particles;hVapour concentration needed for the observed growth;iVapour source rate needed to sustain the growth.
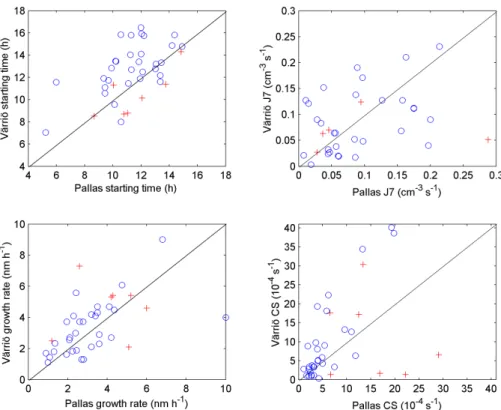
events were observed to start earlier at the western station Pallas (Fig. 3a). This demonstrates that particle formation in a certain air mass type depends not only on the diurnal varia-tion of the parameters causing the phenomenon (such as pho-tochemistry) but also on some properties carried by the air mass itself. The formation rate of 7 nm particles showed dif-ferences between the two sites on individual days (Fig. 3b), but no systematic pattern can be found. It seems that the particle formation rate is not very conservative parameter in an air mass. On the other hand the correlation in growth rates between the two sites was relatively good (Fig. 3c), which suggests that the amount of condensable vapour caus-ing the growth must have been at about the same level in both sites. It seems that in eastern air masses a bit higher growth rates were observed, probably because they had spent more time over the continent. The condensation sink (CS) was fre-quently much higher at the downwind station (Fig. 3d). This demonstrates the effect of particle sources and sinks modify-ing the particle size distribution on the path from one station to the other. It seems that secondary particle formation
re-lated to biogenic sources dominates in many cases over the particle sink during the air mass transport between the sites. This is in part evident because new particle formation does not occur on rainy days which would provide an effective sink for the particles.
Table 2 provides parameters classified by the air mass ori-gin for particle formation events observed on the same day in both sites. First we take a look at the western air masses (from Pallas to V¨arri¨o) originating mostly from the Atlantic Ocean. When reaching V¨arri¨o, these air masses had been influenced more by the continent, which caused a higher pre-existing particle concentration and higher condensation sink (CS) compared with Pallas on many days. The formation rate of 7-nm particles (J7) and the growth rate were close to equal in both sites during these western air masses. During western air masses particle formation is starting about 1.5 h earlier in Pallas than in V¨arri¨o, on average.
The eastern air masses (from V¨arri¨o to Pallas) were mostly continental and travelled sometimes over the Kola Peninsula industrial area. V¨arri¨o is closer to the Kola Peninsula area
Figure 3. Comparison of the effect of different air masses on particle formation parameters
(blue circles = western and red crosses = eastern). The starting times are exact values and
others are averages over each particle formation event.
25
Fig. 3. Comparison of the effect of different air masses on particle formation parameters (blue circles = western and red crosses = eastern).
The starting times are exact values and others are averages over each particle formation event.
and is therefore influenced more strongly by the industrial plumes. The oxidation of SO2 to H2SO4 in these plumes
could boost the particle formation in V¨arri¨o on some days. This is seen as a higher formation rate of 7-nm particles and also a slightly higher growth rate than in Pallas during the eastern air masses. On average more new particles were pro-duced in V¨arri¨o compared to Pallas. This is partly due to a higher CS observed in Pallas during the eastern air masses. Higher concentrations in Pallas refer either to some primary particle sources or to secondary formation of particulate mat-ter between the sites. It seems that during easmat-tern air masses new particle formation is starting 1.2 h earlier in V¨arri¨o than in Pallas, on average.
When looking at the average values on both sites, the east-ern air masses had higher pre-existing particle concentra-tions and CS, compared with western air masses. The east-ern air masses had also higher particle formation rates and slightly higher growth rates. Also larger numbers of new particles were produced during eastern air masses compared with western air masses. This requires higher concentrations and source rates of condensable vapour and suggests that on average in continental (eastern) air masses there is more nu-cleating and condensable vapour available for particle forma-tion and subsequent growth.
3.2 Case studies
Two cases of transport from Pallas to V¨arri¨o were selected for further analysis. In both cases the air arrived at Pallas from the Arctic Ocean after travelling over land for only 9– 10 h. Due to the marine origin and the short interaction time with continental sources, the measured pre-existing particle load and SO2concentration were relatively low. These cases
were also simulated with an aerosol dynamic model UHMA. The air mass trajectory information for the simulations was obtained from Hysplit 4 (Draxler and Rolph, 2003) and the model was initialized with particle size distribution and SO2
measurements made at Pallas. 3.2.1 Case 1 (30 July 2002)
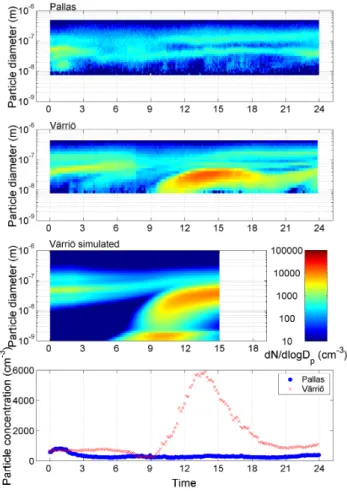
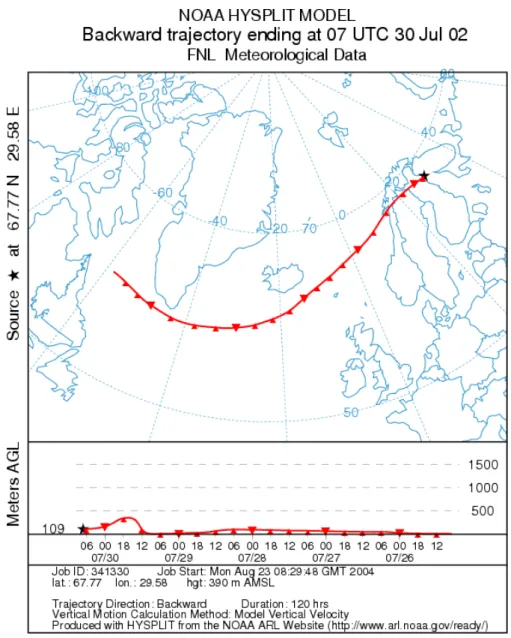
As case 1 (Fig. 4), we present an intense new particle forma-tion event with medium background concentraforma-tion. After a long travel close to the sea surface of the Northern Atlantic (Fig. 5) the air mass travelled over the continent for 9 and 19 h prior to arrival at Pallas and V¨arri¨o, respectively. On this day, new particle formation was observed only at the V¨arri¨o station where the event started at 9:00. Prior to the onset of the event the increase of the boundary layer height was observed to dilute the aerosol. The particle growth was strong until 15:00. The measurements in V¨arri¨o showed a pre-existing particle concentration of 260 cm−3 and CS of
Figure 4. Case 1: A new particle formation event observed only in Värriö on 30 July, 2002.
26
Fig. 4. Case 1: A new particle formation event observed only in
V¨arri¨o on 30 July 2002.
3.9×10⁻⁴s−1. The formation rate of 7-nm particles was 0.33 cm−3s−1and the particle growth rate was 5.6 nm h−1. Approximately 5400 cm−3new particles were produced dur-ing this relatively intense event. The fact that no event was observed at Pallas could not be explained by weather data as the weather parameters were very similar to those at V¨arri¨o.
Figures 4 and 6 display the simulation results for this day. Despite the intensity of the observed event, model simula-tions show that the nucleation rate could not have been close to the kinetic limit on this day. The appropriate intensity of the event can be reproduced using a scaling factor of 2×10⁻⁴–6×10⁻³ for the kinetic nucleation rate, the exact
value depending on the production profile of the low-volatile organics, which makes the main contribution for the growth. Using these scaling factors for kinetic nucleation the maxi-mum nucleation rate was 1–4 cm−3s−1. This relatively slow nucleation rate was able to produce a high concentration of new particles because of the low pre-existing particle load which was further diluted due to a boundary layer increase during the morning hours.
Based on a large number of model runs, it was observed that in order to reproduce an event similar to our
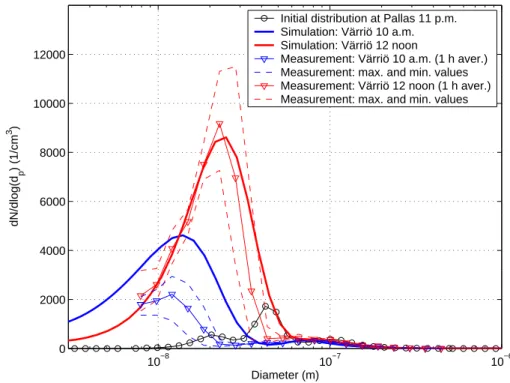
measure-ments, the concentration of condensable organics had to in-crease during the day. A production profile proportional to the OH concentration gave the best result; this is sup-ported by the assumption that condensable organic vapours are likely to result from OH-oxidation reactions of terpenes. The concentration profiles of condensable organics and sul-phuric acid during the simulation are presented in Fig. 7. The same growth rate as in the measurements was achieved using a maximum organic concentration of 1.2×108cm−3. In this simulation the maximum sulphuric acid concentration was approximately 2×106cm−3, so sulphuric acid made only a minor contribution to the growth.
The separate “mode” that appears below 3 nm in the simu-lated distributions (Figs. 4 and 8) deserves a few words: Due to efficient coagulation with bigger particles, only a small fraction of the large number of clusters <3 nm survives to the actual nucleation mode sizes and continue growing. Along with the growth of the nucleation mode, the condensation and coagulation sinks of the particle population increase lead-ing to increaslead-ing coagulation loss for the freshly nucleated clusters. At some stage, the coagulation sink for clusters becomes big enough to suppress the feeding of new parti-cles to the growing nucleation mode, which leads to a cease of the nucleation burst. However, the growth of the nucle-ation mode continues also after the feeding of new particles is stopped.
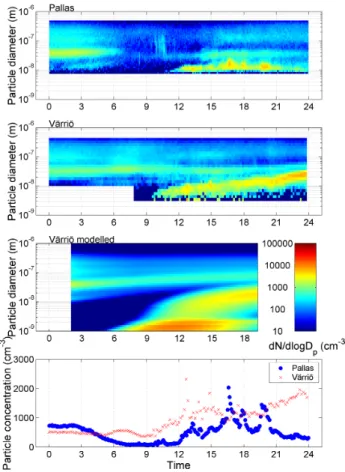
3.2.2 Case 2 (8 May 2003)
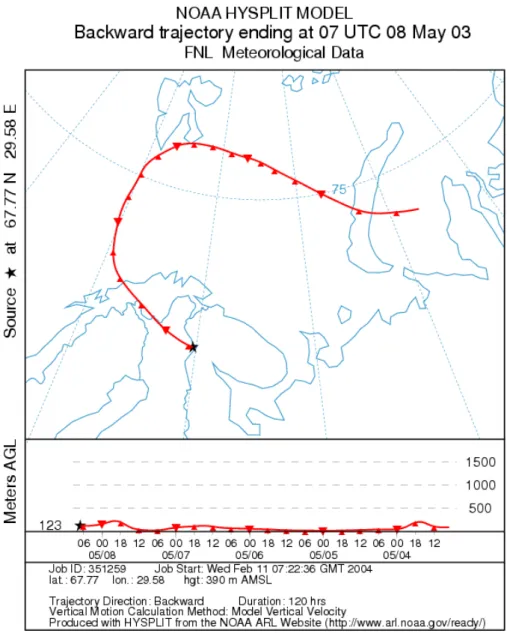
Case 2 represents an event in a clean air mass with low background concentrations (Fig. 8). On this day, new par-ticle formation was observed at about the same time at both sites. The formation of new 3-nm particles started at 09:00 in V¨arri¨o, whereas the formation of 7-nm particles started around 11:00 at both sites. This event was characterized by a slow and long particle growth until midnight. An increase in the boundary layer height was observed in the morning. On this day the air mass came from the north and circulated over the Arctic Ocean (Fig. 9). Before entering the continent, the air travelled close to the sea surface keeping the air relatively clean and the particle concentration low. The air mass arrived at Pallas after spending 10 h over the continent and travelled further 9 h before arrival to V¨arri¨o.
The pre-existing particle concentration before the event was around 100 cm−3 at Pallas and 400 cm−3 at V¨arri¨o.
The condensation sink was slightly higher in Pallas (2.8×10⁻⁴s−1)than in V¨arri¨o (1.3×10⁻⁴s−1)despite the
lower pre-existing particle concentration in Pallas. The for-mation rate of 7-nm particles was close to equal, being 0.03 cm−3s−1in V¨arri¨o and 0.02 cm−3s−1in Pallas. Particle growth rates were low and close to equal around 1–2 nm h−1, but in V¨arri¨o the growth continued for a longer period. This particle formation event produced 820 cm−3new particles in V¨arri¨o and 270 cm−3in Pallas.
Figure 5. Case 1: Trajectory path of the air mass, in which the particle formation takes place
in Värriö on 30 July, 2002.
Fig. 5. Case 1: Trajectory path of the air mass, in which the particle formation takes place in V¨arri¨o on 30 July 2002.
Simulation results for this case study are presented in Figs. 8 and 10. Even though the event was weak compared to case 1, the nucleation scaling factor needed to reproduce the observed intensity of the event was of the same order as in case 1. The difference is observed in the concentration of the condensable organic vapour: because the growth of the nucleation mode continued until midnight, the concen-tration of the organics had to rise or at least stay approxi-mately constant in the night. The best agreement with the measurement was achieved using a constant organic produc-tion rate or, more realistically, a producproduc-tion rate that has two small maxima at noon and at midnight, representing oxida-tion reacoxida-tions with OH and NO3. The simulations presented
in Figs. 8 and 10 were made with a constant production rate; the resulting concentration profile is shown in Fig. 7. 3.2.3 Discussion of simulation results
In both of the cases simulated above, the model was able to reproduce the observed nucleation events at V¨arri¨o, 250 km downwind of the simulation starting point. However, the model runs revealed some differences between the two events. The formation rate of 7-nm particles at V¨arri¨o was measured to be approximately ten times higher in case 1. Ac-cording to the model simulations, the actual nucleation rate (at around 1 nm) was 20–40 % lower in this case. This is due to the fact that in case 1 the pre-existing particle load, or
10−8 10−7 10−6 0 2000 4000 6000 8000 10000 12000 Diameter (m) dN/dlog(d p ) (1/cm 3 )
Initial distribution at Pallas 11 p.m. Simulation: Värriö 10 a.m. Simulation: Värriö 12 noon
Measurement: Värriö 10 a.m. (1 h aver.) Measurement: max. and min. values Measurement: Värriö 12 noon (1 h aver.) Measurement: max. and min. values
Figure 6. Simulated and measured size distributions, 30 July, 2002.
28
Fig. 6. Simulated and measured size distributions, 30 July 2002.0 5 10 15 20 104 105 106 107 108 109 Time (hours) Concentration (1/cm 3 ) H 2SO4 case 1 (30 July)
organics case 1 (30 July) H
2SO4 case 2 (8 May)
organics case 2 (8 May)
Figure 7. The used concentration profiles of condensable organics and sulphuric acid during
the simulation.
29
Fig. 7. The used concentration profiles of condensable organics and sulphuric acid during the simulation.condensation sink, was significantly lower and the concen-tration of condensable organic vapour required to reproduce the observed nucleation mode growth rate was higher. These two factors, i.e. slower scavenging to pre-existing aerosol and faster growth rate of new particles, made it possible for a larger fraction of the newly formed particles to survive to de-tectable sizes.
In case 1, the simulated nucleation rates was three to four orders of magnitude lower than the calculated kinetic limit whereas in case 2 we had to assume a scaling factor larger than 10−3; the exact value of the scaling factor is dependent on the simulated organic vapour concentration. The condens-able organic vapours were assumed to form in oxidation re-actions of forest emitted terpenes. The organic concentration profiles that best reproduced the observations at the recep-tor site V¨arri¨o were different in the two cases indicating that divergent formation reactions may dominate under different conditions. This could be due to the fact that the emission rates of the natural organic vapours depend on temperature, radiation or other environmental factors (Kesselmeier and Staudt, 1999), or that the oxidation mechanisms leading to low-volatile end products are highly complicated.
In the selected cases, the simulated concentrations of sul-phuric acid explained less than 10% of the nucleation mode growth, indicating that organic compounds are the main con-tributor to particle growth in this clean yet relatively sparsely vegetated subarctic environment. This observation is also in line with earlier analyses for more densely vegetated envi-ronments (Birmili et al., 2003; Boy et al., 2005). The crucial role of organics in new particle growth offers a tentative hy-pothesis to the distinct features of new particles at the two sites: At the source station Pallas no particle formation at 7 nm is detected in case 1 and in case 2 the growth of formed particles is not as clear as at V¨arri¨o. Since the air mass in both cases reaches Pallas after travelling over land for only 9–10 h, the time for the organic vapours to accumulate in the air and to interact with the particles is relatively short. As a result, the growth rate of newly formed clusters remains low, they are effectively scavenged by pre-existing particles and may not reach the detection limit of the measurement instru-mentation.
4 Conclusions
Four years of aerosol number size distribution data was used in this study. Two years of new data from years 2002–2003 were also examined. During the years 2002–2003 over 100 new particle formation events were observed. More than half of the events were observed to occur on the same day in a scale of 250 km. The highest frequency of events occurred in April and September. The slightly higher average values of particle formation and growth rates observed in V¨arri¨o site refer to polluted events boosted by the Kola Peninsula indus-trial area. Overall the values were of the same magnitude as observed in earlier studies.
Figure 8. Case 2: A new particle formation event observed at both sites on 8 May, 2003.
30
Fig. 8. Case 2: A new particle formation event observed at both
sites on 8 May 2003.
A clear seasonal variation was found in the starting time of the events, following the annual pattern of sun rise. The parti-cle formation rate had higher values in V¨arri¨o from March to July, possibly due to more frequent polluted air masses from the Kola Peninsula industrial area. No clear seasonal pattern in the formation rate of 7-nm particles was observed. The particle growth rate showed a clear seasonal variation, the values being highest in summer. These results are in agree-ment with earlier studies.
A comparison of parameters related to particle formation at two sites in both western and eastern air masses was pre-sented. In eastern air masses almost all events were observed to start earlier at the eastern station V¨arri¨o, whereas in west-ern air masses most of the events were observed to start ear-lier at the western station Pallas. This demonstrates that par-ticle formation in a certain air mass type depends not only on the diurnal variation of the parameters causing the phe-nomenon (like photochemistry) but also on some properties carried by the air mass itself. The formation rate of 7-nm par-ticles showed differences between the two sites, but without a systematic pattern. It seems that the particle formation rate is not a very conservative parameter in an air mass. The cor-relation in growth rates between the two sites was relatively
Figure 9. Case 2: Trajectory path of the air mass, in which the particle formation takes place
in Värriö on 8 May, 2003.
31
Fig. 9. Case 2: Trajectory path of the air mass, in which the particle formation takes place in V¨arri¨o on 8 May 2003.high, which suggests that the amount of condensable vapour causing the growth must have been at about the same level in both sites. The condensation sink (CS) was frequently much higher at the downwind station. It seems that secondary par-ticle formation related to biogenic sources dominate in many cases over the particle sinks during the air mass transport be-tween the sites.
In western (marine) air masses the formation and growth rates were close to equal in both sites on average. During western air masses emissions are mainly biogenic, therefore V¨arri¨o (deeper in the boreal forest than Pallas) has higher source rates of condensable vapour. However, higher vapour source rates combined with higher condensation sinks com-pensate each other, which might partly explain why no dif-ference in particle formation and growth rates were observed
between Pallas and V¨arri¨o in these western air masses. In eastern continental air masses higher formation rates and slightly higher growth rates were observed in V¨arri¨o which is closer to the major pollutant sources in Kola Peninsula area. On average, continental air masses had higher formation and growth rates compared to marine air masses. This suggests that in these more polluted continental air masses there is more nucleating and condensable vapour available for parti-cle formation and growth.
Two cases of transport from Pallas to V¨arri¨o were selected for further analysis and model simulations were performed along the trajectories on these days. The simulations high-lighted the influence of pre-existing particle concentration and condensable vapour concentration on new particle for-mation. Due to low particle load and high simulated vapour
32 10−8 10−7 10−6 0 500 1000 1500 2000 2500 3000 3500 4000 Diameter (m) dN/dlog(d p ) (1/cm 3 )
Initial distribution at Pallas 2 a.m. Simulation: Värriö 11 a.m. Simulation: Värriö 5 p.m.
Measurement: Värriö 11 a.m. (1 h aver.) Measurement: max. and min. values Measurement: Värriö 5 p.m. (1 h aver.) Measurement: max. and min. values
Figure 10. Simulated and measured size distributions, 8 May, 2003. Fig. 10. Simulated and measured size distributions, 8 May 2003.
concentrations, the formation rate of 7-nm particles was ap-proximately ten times higher in case 1 than in case 2, al-though the actual nucleation rate (at around 1 nm) was 20– 40 % lower in case 1. The organic concentration profiles that best reproduced the observations at the receptor site V¨arri¨o were different in the two cases indicating that divergent for-mation reactions may dominate under different conditions. This could be due to the fact that the emission rates of the natural organic vapours depend on temperature, radiation or other environmental factors, or that the oxidation mecha-nisms leading to low-volatile end products are highly com-plicated.
In the selected cases, the simulated concentrations of sul-phuric acid explained less than 10% of the nucleation mode growth, indicating that organic compounds are the main con-tributor to particle growth in this clean yet relatively sparsely vegetated subarctic environment. This observation is also in line with earlier analyses for more densely vegetated environ-ments (Boy et al., 2005; Birmili et al., 2003). The crucial role of organics in new particle growth offers a tentative hypoth-esis to the distinct features of new particles at the two sites: At the source station Pallas no particle formation at 7 nm is detected in case 1, and in case 2 the growth of formed par-ticles is not as clear as at V¨arri¨o. Since the air mass in both cases reaches Pallas after travelling over land for only 9–10 h, the time for the organic vapours to accumulate in the air and to interact with the particles is relatively short. As a result, the growth rate of newly formed clusters remains low, they are effectively scavenged by pre-existing particles and may not reach the detection limit of the measurement instrumen-tation.
Acknowledgements. The authors would like to thank the Academy
of Finland and the LAPBIAT project for financial support. Edited by: U. Baltensperger
References
Adams, P. J. and Seinfeld, J. H.: Predicting global aerosol size distributions in general circulation models, J. Geophys. Res., 107(D19), 4370, doi:10.1029/2001JD001010, 2002.
Ahonen, T., Aalto, P., Rannik, ¨U., Kulmala, M., Nilsson, E. D., Palmroth, S., Ylitalo, H., and Hari, P.: Variations and verti-cal profiles of trace gas and aerosol concentrations and CO2
exchange in eastern Lapland, Atmos. Environ. 31, 3351–3362, 1997.
Birmili, W., Berresheim, H., Plass-Dalmer, C., Elste, T., Gilge, S., Wiedensholer, A., and Uhrner, U.: The Hohenpeissenberg aerosol formation experiment (HAFEX): a long term study in-cluding size-resolved aerosol, H2SO4, OH, and monoterpene
measurements, Atmos. Chem. Phys., 3, 361–376, 2003, http://www.atmos-chem-phys.net/3/361/2003/.
Boy, M., Kulmala, M., Ruuskanen, T. M., Pihlatie, M., Reissell, A., Aalto, P. P., Keronen, P., Dal Maso, M., Hellen, H., Hakola, H., Jansson, R., Hanke, M., and Arnold, F.: Sulphuric acid clo-sure and contribution to nucleation mode particle growth, Atmos. Chem. Phys., 5, 863–878, 2005,
http://www.atmos-chem-phys.net/5/863/2005/.
Draxler, R. R. and Rolph, G. D.: HYSPLIT (HYbrid Single-Particle Lagrangian Integrated Trajectory) Model access via NOAA ARL READY Website (http://www.arl.noaa.gov/ready/hysplit4.html), NOAA Air Resources Laboratory, Silver Spring, MD, 2003. Grini, A., Korhonen, H., Lehtinen, K. E. J., Isaksen, I. S. A., and
Kulmala, M.,: A combined photochemistry/aerosol dynamics model: Model development and a study of new particle forma-tion, Boreal Env. Res., 10, 525–541, 2005.
Hatakka, J., Aalto, T., Aaltonen, V., Aurela, M., Hakola, H., Komp-pula, M., Laurila, T., Lihavainen, H., Paatero, J., Salminen, K., and Viisanen, Y.: Overview of the atmospheric research activ-ities and results at Pallas GAW station, Boreal Env. Res., 8(4), 365–384, 2003.
Hari, P., Kulmala, M., Pohja, T., Lahti, T., Siivola, E., Palva, L., Aalto, P., H¨ameri, K., Vesala, T., Luoma, S., and Pulliainen, E.: Air pollution in Eastern Lapland: Challenge for an Environmen-tal Measurement Station, Silva Fennica, 28, 29–39, 1994. Jacobson, M. Z.: Global direct radiative forcing due to
multicompo-nent anthropogenic and natural aerosols, J. Geophys. Res., 106, 1551–1568, 2001.
Jokinen, V. and M¨akel¨a, J. M.: Closed-loop arrangement with crit-ical orifice for DMA sheath/excess flow system, J. Aerosol Sci., 28, 643–648, 1997.
Kaufman, Y. J., Tanre, D., and Boucher, O.: A satellite view of aerosols in the climate system, Nature, 419, 215–223, 2002. Kavouras, I., Mihalopoulos, N., and Stephanou, E. G.: Formation
and gas/particle partitioning of monoterpene photo-oxidation products over forests, Geophys. Res. Lett., 26, 55–59, 1998. Kerminen, V.-M., Lihavainen, H., Komppula, M., Viisanen, Y., and
Kulmala, M.: Direct observational evidence linking atmospheric aerosol formation and cloud droplet activation, Geophys. Res. Lett., 32, L14803, doi:10.1029/2005GL023130, 2005.
Kesselmeier, J. and Staudt, M.: Biogenic volatile organic com-pounds (VOC): An overview on emission, physiology and ecol-ogy, J. Atm. Chem., 33, 23–87, 1999.
Komppula, M., Lihavainen, H., Hatakka, J., Aalto, P. P., Kulmala, M., and Viisanen Y.: Observations of new particle formation and size distribution at two different heights and surroundings in sub-arctic area in Northern Finland, J. Geophys. Res., 108(D9), 4295, doi:10.1029/2002JD002939, 2003a.
Komppula, M., Dal Maso, M., Lihavainen, H., Aalto, P. P., Kul-mala, M., and Viisanen, Y.: Comparison of new particle forma-tion events at two locaforma-tions in northern Finland, Boreal Env. Res., 8(4), 395–404, 2003b.
Komppula, M, Lihavainen, H., Kerminen, V.-M., Kulmala, M., and Viisanen, Y.: Measurements of cloud droplet activation of aerosol particles at a clean subarctic background site, J. Geophys. Res., 110, D06204, doi:10.1029/2004JD005200, 2005.
Korhonen, H., Lehtinen, K. E. J., and Kulmala, M.: Multicompo-nent aerosol dynamics model UHMA: model development and validation, Atmos. Chem. Phys., 4, 757–771, 2004,
http://www.atmos-chem-phys.net/4/757/2004/.
Korhonen, H., Kerminen, V.-M., Lehtinen, K. E. J., and Kulmala, M.: CCN activation and cloud processing in sectional aerosol models with low size resolution, Atmos. Chem. Phys., 5, 2561– 2570, 2005,
http://www.atmos-chem-phys.net/5/2561/2005/.
Kourtchev, I., Ruuskanen, T., Maenhaut, W., Kulmala, M., and Claeys, M.: Observation of 2-methyltetrols and related photo-oxidation products of isoprene in boreal forest aerosols from Hyyti¨al¨a, Finland, Atmos. Chem. Phys., 5, 2761–2770, 2005, http://www.atmos-chem-phys.net/5/2761/2005/.
Kulmala, M., Toivonen, A., M¨akel¨a, J., and Laaksonen, A.: Analy-sis of the growth of nucleation mode particles observed in boreal forest, Tellus, Ser. B, 50, 449–462, 1998.
Kulmala, M., Dal Maso, M., M¨akel¨a, J., Pirjola, L., V¨akev¨a, M., Aalto, P., Miikkulainen, P., H¨ameri, K., and O’Dowd, C. D.: On
the formation, growth and composition of nucleation mode par-ticles, Tellus, Ser. B, 53, 479–490, 2001.
Kulmala, M., Vehkam¨aki, H., Pet¨aj¨a, T., Dal Maso, M., Lauri, A., Kerminen, V.-M., Birmili, W., and McMurry, P. H.: Formation and growth rates of ultrafine atmospheric particles: A review of observations, J. Aerosol Sci., 35, 143–176, 2004a.
Kulmala, M., Kerminen, V.-M., Anttila, T., Laaksonen, A., and O’Dowd C.D.: Organic aerosol formation via sul-phate cluster activation, J. Geophys. Res., 109(D4), 4205, doi:10.1029/2003JD003961, 2004b.
Lihavainen, H., Kerminen, V.-M., Komppula, M., Hatakka, J., Aal-tonen, V., Kulmala, M., and Viisanen, Y.: Prodution of “poten-tial” cloud condensation nuclei production associated with atmo-spheric new-particle formation in northern Finland, J. Geophys. Res., 108(D24), 4782, doi:10.1029/2003JD003887, 2003. Lohmann, U. and Feichter, J.: Global indirect aerosol effects: a
review, Atmos. Chem. Phys., 5, 715–737, 2005, http://www.atmos-chem-phys.net/5/715/2005/.
Mauldin, III R. L., Cantrell, C. A., Zondlo, M. A., Kosciuch, E., Ridley, B. A., Weber, R., and Eisele, F. E.: Measurements of OH, H2SO4, and MSA during tropospheric ozone production about
the spring equinox (TOPSE), J. Geophys. Res., 108(D4), 8366, doi:10.1029/2002JD002295, 2003.
M¨akel¨a, J. M., Aalto, P., Jokinen, V., Pohja, T., Nissinen, A., Palm-roth, S., Markkanen, T., Seitsonen, K., Lihavainen, H., and Kul-mala, M.: Observations of ultrafine aerosol particle formation and growth in boreal forest, Geophys. Res. Lett., 24, 1219–1222, 1997.
M¨akel¨a, J., Dal Maso, M., Pirjola, L., Keronen, P., Laakso, L., Kul-mala, M., and Laaksonen, A.: Characteristics of the atmospheric particle formation events observed at a boreal forest site in South-ern Finland, Boreal Env. Res., 5, 299–313, 2000.
Pirjola, L., Kulmala, M., Wilck, M., Bischoff, A., Stratmann, F., and Otto, E.: Effects of aerosol dynamics on the formation of sulphuric acid aerosols and cloud condensation nuclei, J. Aerosol Sci., 30, 1079–1094, 1999.
Seinfeld, J. H. and Pandis, S. N.: Atmospheric chemistry and physics: From air pollution to climate change. John Wiley & Sons Inc, New York, 1998.
Stohl, A., Wotawa, G., Seibert, P., and Kromp-Kolb, H.: Interpo-lation errors in wind fields as a function of spatial and temporal resolution and their impact on different types of kinematic tra-jectories, J. Appl. Meteor., 34, 2149–2165, 1995.
Vehkam¨aki, H., Dal Maso, M., Hussein, T., Flanagan, R., Hyv¨arinen, A., Lauros, J., Merikanto, J., M¨onkk¨onen, P., Pih-latie, M., Salminen, K., Sogacheva, L., Thum, T., Ruuskanen, T. M., Keronen, P., Aalto, P. P., Hari, P., Lehtinen, K. E. J., Rannik,
¨
U., and Kulmala, M.: Atmospheric particle formation events at V¨arri¨o measurement station in Finnish Lapland 1998–2002, At-mos. Chem. Phys., 4, 2015–2023, 2004,
http://www.atmos-chem-phys.net/4/2015/2004/.
Weber, R. J., Marti, J. J., McMurry, P. H., Eisele, F. L., Tanner, D. J., and Jefferson, A.: Measurements of new particle formation and ultrafine particle growth rates at a clean continental site, J. Geophys. Res., 102(D4), 4375–4385, 1997.
Winklmayr, W., Reischl, G. P., Linder, A. O., and Berner, A.: A new electromobility spectrometer for the measurement of aerosol size distribution in the size range 1 to 1000 nm, J. Aerosol Sci., 22, 289–296, 1991.