DETECTION OF HYDROGEN EMBRITTLEMENT IN STEEL AND STEEL ALLOYS USING METHODS OF NEUTRON RADIOGRAPHY
by
ANDREW STEPHEN BARRITT Dipl. Maschineningenieur
Eidgen6ssische Technische Hochschule, Zirich, Switzerland
( 1987 )
SUBMITTED TO THE DEPARTMENT OF
NUCLEAR ENGINEERING IN PARTIAL FULFILLMENT OF
THE REQUIREMENT FOR THE DEGREE OF
MASTER OF SCIENCE IN NUCLEAR ENGINEERING at the
MASSACHUSETTS INSTITUTE OF TECHNOLOGY
January, 1994
© Massachusetts Institute of Technology 1994 All rights reserved
Signature of Author
7.
Department of Nuclear EngineeringJanuary, 1994
Certified by
-Dr. Richard C. Lanza Thesis Supervisor Prinipl Research Scientist, Department of Nuclear Engineering Certified by
Accepted by
Kent F. Hansen
' Thesis Reader
Professor, Department of Nuclear Engineering
- 'v r
MASS-AHUSETrTS IFSTI TUTE
AP r,6 1994e
APR 26 1994
Allan F. Henry, Chairman Department of Nuclear Engineering Graduate Committee
DETECTION OF HYDROGEN EMBRITTLEMENT IN STEEL AND STEEL ALLOYS USING METHODS OF NEUTRON RADIOGRAPHY
by
ANDREW STEPHEN BARRITT
Submitted to the Department of Nuclear Engineering on January 14, 1994, in partial
fulfillment of the requirements for the degree of Master of Science in Nuclear
Engineering.
ABSTRACT
A theoretical study of a thermal neutron radiography system for non-destructive testing of steel pipes as used in power plants was carried out. The system uses a neutron detecting scintillator screen and a cooled CCD-camera connected to a small computer as imaging devices. All components of the system are described by a set of equations representing the physical and optical properties. The equations are incorporated into a computer
spreadsheet program to model the system. The input parameters are varied to check for the correctness of the model and to supply the basis for modifications. The influence of
dark, readout and system noise is studied. The modeled equipment represents a Princeton
Instruments, Inc. camera with a EEV 1152 x 1242 pixel CCD-chip and a ST-138
controller.
The results from the modeling show that due to the large dynamic range and very low
noise levels, hydrogen can be detected in the inside wall of a steel pipe. The limit for spatial resolution without accounting for scattering effects is about 100 ptm, for the
detection of hydrogen between 50 to 100 ppm. Contrast resolution is dependent on the exposure time but reaches a limit at approximately 0.5 % of the mass attenuation coefficient for very long exposures. When scattering effects are taken into account, the contrast resolution is reduced by a factor gs, which is dependent on the type of material and the thickness. For the model case, gs reduces contrast resolution considerably ( Order of magnitude: 100 x ), so that improvements to the original system are indicated. These include, but are not limited to, an optimized object-scintillator-CCD geometry, scattering grids and the use of a cold neutron source.
The sources available at this time for thermal neutrons are either not powerful enough or
too bulky to be of any use for a system for the testing of non-removable steel pipes in a
power plant. This means that the system will not be useful in the proposed task until long and cost-intensive development further development of sources has taken place. On the other hand, the assessment of steel pipes in a power plant constitutes only a very small
part of non-destructive testing of materials. Therefore, the described system has many
other applications where the large dynamic range, high spatial resolution and low noise levels can be fully utilized.
Thesis Supervisor:Dr. Richard C. Lanza
Title: Principle Research Scientist, Nuclear Engineering
ACKNOWLEDGMENTS
It is hard for me to express all the gratitude for all the individuals that have helped me at MIT for the past two years. Hopefully I can share some of the appreciation in the next
few pages.
I would like to thank Dr. Richard Lanza for his supervision and patience on the project. Dr. Lanza allowed a lot of freedom for research, but supplied enough supervision to keep
the project on task. I learned a lot about neutron radiography and imaging systems in many interesting discussions.
I would also like to thank Professor Kent Hansen for his help in making my stay here at MIT possible and the guidance during the last two years. I appreciate the time Professor Hansen spent on reading this thesis and the resulting helpful commentaries greatly, especially as I know that spare time is a very valuable resource in Professor Hansen's schedule.
A thank you also goes to the other members of the faculty of the Nuclear Engineering
Department for the knowledge, information and guidance I received in their interesting classes during the past two years. I feel confident of possessing a good background in
Nuclear Engineering now.
Furthermore, I would like to thank the staff of the Nuclear Engineering Department for their help and background work in making the studying and working conditions of us
students a trouble-free environment. A special thank you to Clare Egan at the Graduate Student Office for her patience and help in getting me set up and organized in the beginning of my stay at MIT.
A special thanks goes to my employer, the Nuclear Power Plant at Leibstadt, Switzerland
( KKL AG ) for making studies here at MIT possible for me. I highly appreciate the confidence Dr. Hugo Schumacher and Mr. Hans Achermann put in me by sending me
here to pursue a Masters Degree. I hope the knowledge I have gained here will help the plant to continue operating in a safe and efficient manner for a long time.
I am grateful for the friends I encountered in fellow students here at MIT. It makes life
easier and much more pleasant if one has good friends to talk to when problems arise or
just to share views about politics, economics or life in general. Life would be boring
without you!
Last but not least I would like to thank my family. My wife Vera for being kind and
understanding when I did not have the time to be an attentive husband and for making our
apartment in Arlington a home I always liked to return to. My son Patrick for being a friendly, joyful and healthy little boy and sleeping through the night since he has been 21/2 months old! Furthermore, my parents, for our family that gave me the character
development and support to pursue my dreams. It is only when one gets to be a father oneself that one can really start to realize all the support given by the parents.
TABLE OF CONTENTS
Page
DETECTION OF HYDROGEN EMBRITTLEMENT IN STEEL AND STEEL
ALLOYS USING METHODS OF NEUTRON RADIOGRAPHY ...ii
ACKNOW LEDGM ENTS ... iv
LIST OF ILLUSTRATIONS ... x
LIST OF TABLES .... ... ... ... xiii
LIST OF ABBREVIATIONS ... ... xivx... CHAPTER 1 INTRODUCTION ... 17
1.1 Statement of Problem ... 1... 17
1.2 Approach ... 18
CHAPTER 2 BACKGROUND ... 20
2.1 Areas of Degradation of Structures by Hydrogen ... 20
2.2 Other Areas of Interest for Detection of Hydrogen ... 23
2.3 Two Examples of Recent Research ... 24
CHAPTER 3 SYSTEM DESCRIPTION ... 26
3.1 Theory of the Attenuation of a Neutron Beam ... ...26
3.2 General description of the System ... 30
3.3 Detailed Review of System Components ... 31
3.3.1 Neutron Source ... 31
3.3.2 Object Handling ... 33
3.3.3 Neutron Detection Device ... 34
3.3.4 Optical Lens ... 34
3.3.5 CCD-Camera Systems ... 38
3.3.6 Enclosure and Mounting for Scintillator and Camera ...40
3.5 Influence of Noise on System Performance ... 45
CHAPTER 4 MODELING AND COMPUTER SIMULATION ...49
4.1 Basic M odel ... 49
4.2 Parameter Variations and Case Studies ... 50
4.2.1 Base Case ... 50
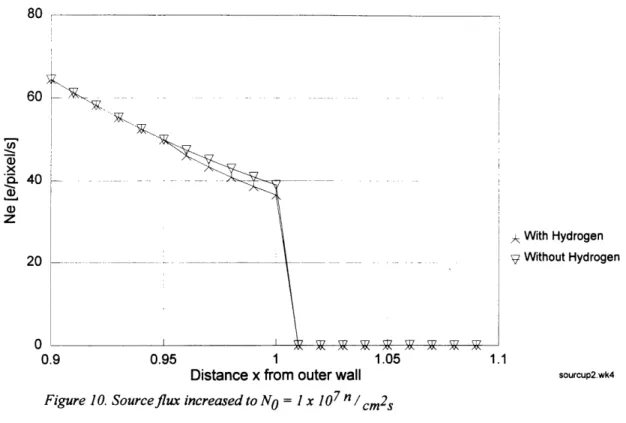
4.2.2 Variation of Source Flux ... 53
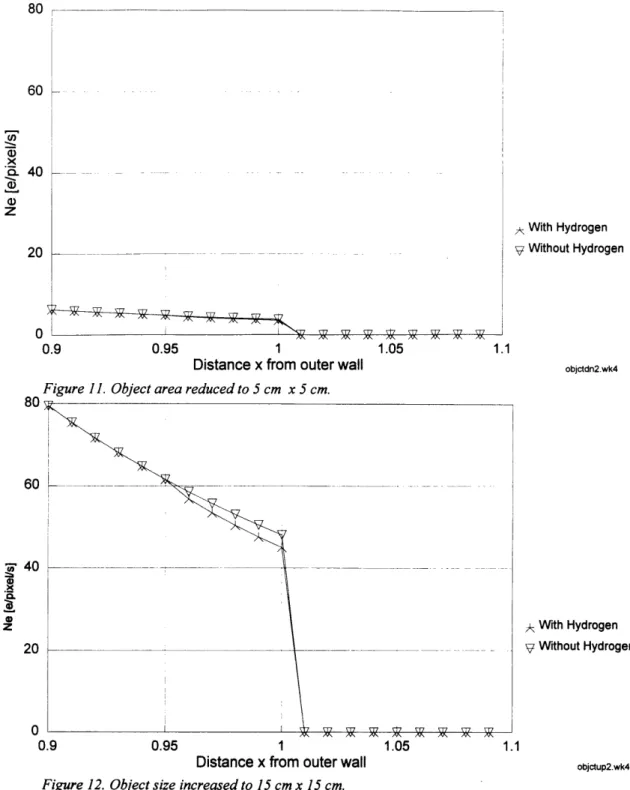
4.2.3 Variation of Object Size ... 54
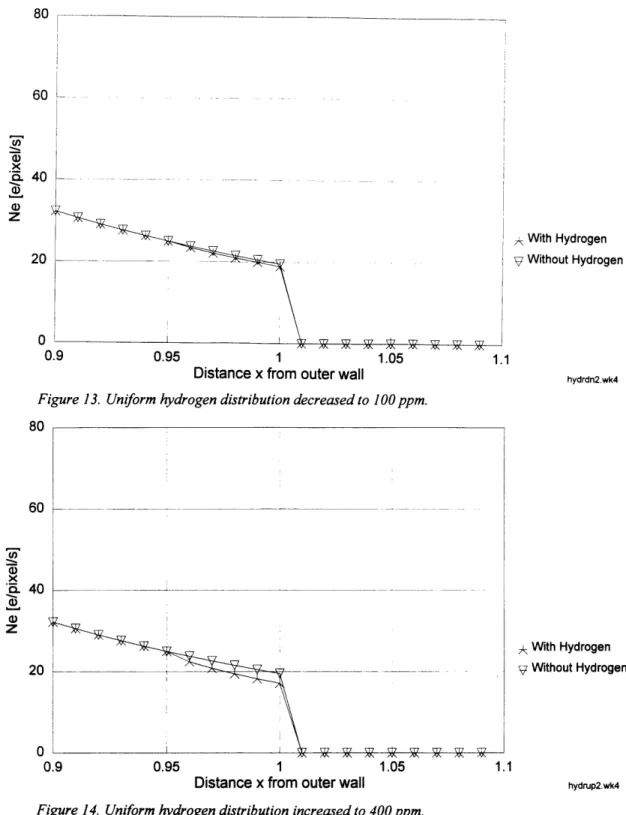
4.2.4 Variation of Hydrogen Content in Object ...56
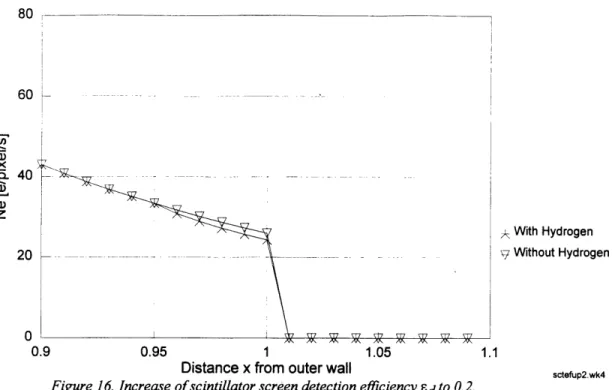
4.2.5 Variation of Parameters of the Scintillator Screen ...58
4.2.6 Variation of Lens Characteristics ... ... 60
4.2.7 Variation of the Characteristics of the CCD-Chip ...63
4.2.8 Summary of the Variation of Parameters ... 67
4.3 Modeling of Real Components ... 67
4.3.1 Evaluation of Different CCD-Camera Systems ...68
4.3.2 Modeling of the Princeton Instruments System ...70
4.3.3 Modeling of Various Pipe Dimensions ... ... 75
4.4 Error Sensitivity ... 76
CHAPTER 5 EXPERIMENTS ... 80
5.1 Preliminary Experiments ... 80
5.1.1 X-Ray Experiments with SBIG CCD-Camera ...80
5.1.2 Tests with Loaned PI Trial System ... 83
5.2 Components Prepared for Experiments ... 87
CHAPTER 6 ANALYSIS AND DISCUSSION OF RESULTS ...89
6.1 Analysis of Computer Modeling ... 89
6.1.1 Base Case and Variation of Parameters ... 89
6.1.2 Minimum Signal ... 90
6.1.3 Model of the Princeton Instruments System . ... 91
6.2 Relationship between the Model and Real Experiments ... 92
6.2.1 Influence of the Assumptions ... 92
6.2.2 Influence of the Hydrogen Distribution ... 94
6.2.3 Resolution Limits ... 94
6.2.4 Scattering ... 97
CHAPTER 7 CONCLUSIONS AND RECOMMENDATIONS ...99
7.1 Conclusions ... ... ... .. 99
7.2 Recommendations ...104
APPENDIX A ... ... 107
METALURGICAL CONSIDERATIONS ...107
A. 1 Characteristics of Some Metallic Construction Materials ...107
A. 1.1 Aluminum ... 107
A. 1.2 Titanium ... ... 107
A. 1.3 Iron and Steel ... 108
a.) Atomic Structure ... 108
b.) Effects of Alloying Elements ... 110
A.2 Mechanical Properties of Steel ... 112
A.3 Uses of Certain Types of Steel ... 1...14
A.3.1 Tube Steels ... 114
A.3.2 Nuclear Steam Supply Systems ...114
A.3.3 Primary Coolant Piping ... 115
A.3.4 Steam Piping ...116
A.4 Hydrogen in Metal ... 116
A.4.1 Hydrogen-Metal Relationship ... 116
A.4.3 Solubility of Hydrogen in Steel as a Function of Alloying Elements ... 119
A.5 Diffusion and Permeation of Hydrogen Through Iron and Steel ... 122
A.5.1 Possible Mechanism of Hydrogen Flow through Metals ... 122
A.5.2 Application of Fick's Law to the Flow of Hydrogen Through Metal ... 123
A.5.3 Various Parameters that Effect Hydrogen Flow ... 124
A.6 Mechanism of Embrittlement of Steel by Hydrogen ... 126
APPENDIX B ... ... 1291.. Information on Spreadsheet Used for the Model ... 129
B.1 General Information ...129
B.2 Example of the Spreadsheet ... 130
APPENDIX C ... 132
C. 1 Graph of Mass Attenuation Coefficients for Various Elements ... 132
APPENDIX D ... 133
Construction Sketches for Aluminum Box ...133
APPENDIX E ... 137
Technical Specifications for Princeton Instruments ST- 138 Camera Controller and EEV CCD-Camera ... 137
LIST OF ILLUSTRATIONS
Figure Page
Figure 1. Neutron beam passing through uniform material ...26
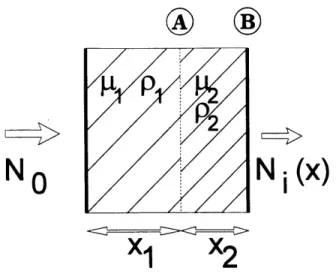
Figure 2. Neutron beam passing through an object with two regions with differing properties ... 28
Figure 3. Neutron beam passing through an object containing
hydrogen
...
29
Figure 4. Schematic of neutron radiography system ... 31
Figure 5. Pipe geometry for neutron beam attenuation ... 42
Figure 6. Example of a SNR-Diagram ... 47
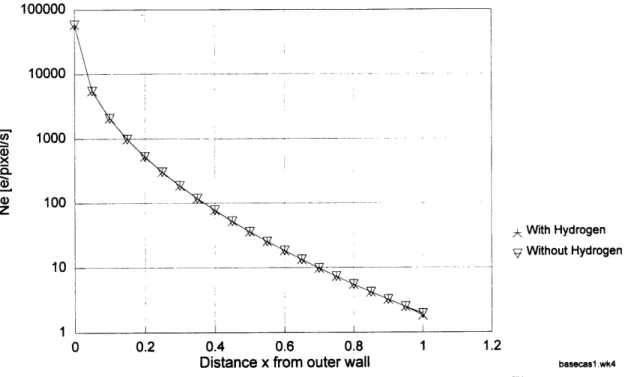
Figure 7. Base case. Signal at CCD-output vs. distance from pipe outside diam eter ... 51
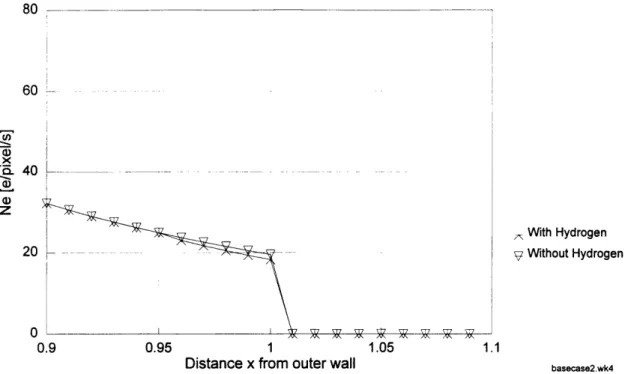
Figure 8. Base case. Signal at CCD-output. Enlargement of region around pipe inside diameter ... 52
Figure 9. Source flux reduced to No = 1 x 10⁶ n/cm2 s ... 53
Figure 10. Source flux increased to No = 1 x 10⁷ n / cm2s ... 54
Figure 11. Object area reduced to 5 cm x 5 cm ... 55
Figure 12. Object size increased to 15 cm x 15 cm ... 55
Figure 13. Uniform hydrogen distribution decreased to 100 ppm ...57
Figure 14. Uniform hydrogen distribution increased to 400 ppm ...57
Figure 15. Decrease of scintillator screen detection efficiency edto 0. 1 . ... ... 58
Figure 16. Increase of scintillator screen detection efficiency edto 0.2 ... 59
Figure 17. Low scintillator screen conversion factor N7 = 9 x 10⁴
e/n ... ... .. ... . ... 59
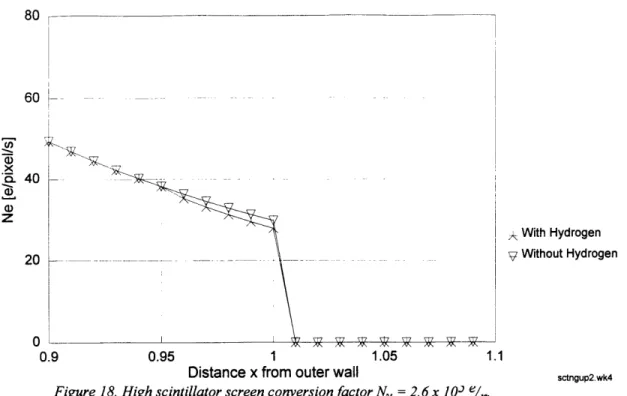
Figure 18. High scintillator screen conversion factor NY = 2.6 x
105 e/n ... 60
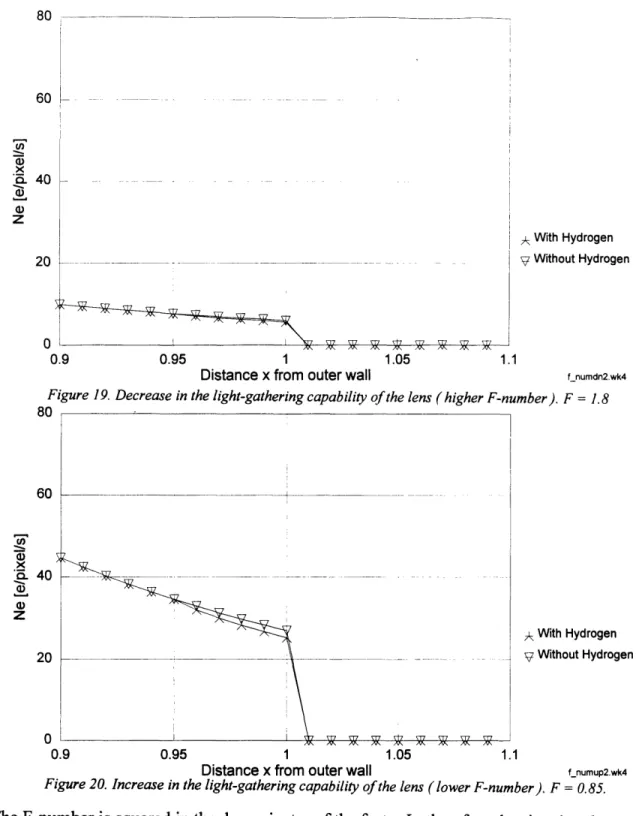
Figure 19. Decrease in the light-gathering capability of the lens
(higher F-number ). F = 1.8 ... 61
Figure 20. Increase in the light-gathering capability of the lens
(lower F-number ). F = 0.85 ... 61
Figure 21. Decrease in lens efficiency, el = 0.7 ... 62 Figure 22. Increase in lens efficiency, el = 0.95 ... 62 Figure 23. Reduction in CCD-chip size to 512 x 512 pixels. Pixel
size 15 mm ... 63 Figure 24. Increase in CCD-chip size to 2048 x 2048 pixels. Pixel
size 15 mm ... 64 Figure 25. Reduction of pixel-size to 8 mm ... 65 Figure 26. Increase of pixel-size to 22 mm ... 65 Figure 27. Reduction in quantum efficiency of the CCD-chip. eq = 0.15 ... 66 Figure 28. Increase in quantum efficiency of the CCD-chip. eq =
0.45
...
66
Figure 29. CCD-output signal Ne of PI camera system vs. distance
from outside pipe wall ... 71
Figure 30. CCD-output signal Ne of PI camera system.
Enlargement of region adjacent to inside pipe wall ... 72 Figure 31. Output signal at CCD and noise levels vs. exposure
time. Standard readout mode. ( PI system ) ... 73
Figure 32. Output signal at CCD and noise levels vs. exposure
time. MPP mode. (PI system) ... 73 Figure 33. Signal-to-noise ratio for PI system operating under
standard mode ... 74
Figure 34. Signal-to-noise ratio for PI system running under
MPP-m ode ... 75
Figure 35. Output signal at CCD-chip for various outside pipe
diameters and wall thicknesses ... 76
Figure 36. Printout of screen image of X-ray calibration plate. Most coarse line spacing at bottom left corner of plate ( 0.6 LP /
mm ). Negative image is displayed ... 82 Figure 37. Printout of enlargement of figure 39. A profile plot of
the intensity is below the image ... 83 Figure 38. Princeton Instruments Trial System Noise Test.
Intensity of dark frames vs. exposure time ...86
Figure 39. Minimum exposure time t vs. hydrogen loading. Data
for PI-system, distance x = 1 cm, i.e. at inside wall of pipe ... 91
Figure 40. Minimum contrast resolution vs. exposure time t. Data
for PI-system, distance x = 1cm, i.e. at inside pipe wall ... 97
Figure 41. Equilibrium phase stage diagram for Iron and Carbon ...109
Figure 42. Generic Stress vs. Strain Diagram . ... 13
Figure 43. Solubility of Hydrogen as a Function of Chromium and
LIST OF TABLES
Table Page
Table 1. Comparison of Lenses ... 37
Table 2. Relevant CCD-camera systems manufacturers for closer
evaluation
...
69
Table 3. Effects of 1 % error in source flux on signal at CCD-chip ... 77
Table 4. Effects of 1 % error in radius on signal at CCD-chip ... 77
Table 5. Effects of a 1 % error in density on signal at CCD-chip ... 78
Table 6. Effect of a 1 % change in attenuation coefficient on the signal at the CCD-chip ... 78
Table 7. Technical specifications for SBIG ST4 camera ... 80
Table 8. Technical specifications for Kevex K 5010 SW X-ray tube ... ... ... ... 81
Table 9. Factor gs for various materials and thicknesses T. Table copied from reference [ 8 ] ... 98
Table 10. Lattice types as a function of temperature ...109
Table 11. Composition of Inconel 600. Limiting chemical com position in % ...115
Table 12. Composition of 300-Series Stainless Steels ( in wt% ) ... 116
Table 13. Solubility of Hydrogen in pure Iron at p = 1 atm ... 118
Table 14. Conversion Factors for different units of hydrogen content in metal. With: PFe = 7.88 g/cm3 ; atomic weight of Fe = 55.84 ...119
Table 15. Solubility of Hydrogen as a Function of Nickel Content ...120
LIST OF ABBREVIATIONS
#p: Total number of pixels on CCD-chip
A/D: Analog to Digital
A: Mass number
Ai: Image area on scintillator screen
B: Background photon flux
bcc: Body-centered cubic BWR: Boiling Water Reactor
CCD: Charge Coupled Device
D: Dark noise
Dmin: Minimum distance of two points in object plane
Ed: Detection efficiency of the scintillator screen
EEV: English Electric Valve Company
e1: Lens efficiency
Eq: Quantum efficiency of CCD-chip
F: F-number, aperture of an optical lens
f: Focal length of an optical lens
f: Fraction of hydrogen
fcc: Face-centered cubic
gs: Scattering factor
Hi: Image height
Ho: Object height
IGSCC: Inter-Granular Stress Corrosion Cracking
LP: Line-pair Lpixel: Pixel size
[t: Attenuation coefficient
m: Minification
MPP: Multi-Pinned Phase
Jtres: Resulting mass attenuation coefficient for steel containing hydrogen
n: Number of atoms per unit volume
NO: Source flux
Nc: Number of photons incident on CCD per neutron Nd: Neutrons detected by scintillator screen
NDT: Non-Destructive Testing
Ne: Signal at output of CCD-chip
N7: Transformation factor of scintillator screen
Ni(x): Attenuated neutron flux
no: Avogadro's number
Nr: Readout noise
p: Distance object to lens
p: Fraction of hydrogen in ppm
P: Photon flux incident on CCD-chip
PI: Princeton Instruments, Inc.
ppm: Parts per million
PWR: Pressurized Water Reactor
q: Image distance
p: Density
rO: Inside radius of a pipe
r2: Outside radius of a pipe G(t): Total noise of imaging system
SBIG: Santa Barbara Instrument Group, Inc. SCC: Stress Corrosion Cracking
SEM: Scanning Electron Microscope
se: Total noise of system measured in electrons
acn: Total noise of imaging system measured in neutrons
SNR: Signal To Noise Ratio
at: Total cross-section
t: time
TI: Texas Instruments, Inc.
y: Length of attenuation of neutron beam in pipe wall
Z: Atomic number
CHAPTER 1
INTRODUCTION
1.1 Statement of Problem
Degradation of construction materials by environmental attack is a concern for any operator of engineered systems made of metals. The most obvious form is rusting of iron
or steel due to the exposure to air and moisture. Other forms of environmentally assisted
degradation of metals are connected with the formation of hydrogen compounds or the
inclusion of hydrogen in atomic form into the micro structure of the metal itself.
Examples of this are hydrates, hydrogen embrittlement and closely related, intergranular stress corrosion cracking. Due to the nature of these processes, visible inspection of a component may not give any indication of the degradation, a potential weakness in a
structure can go unnoticed.
A non-destructive testing method for components susceptible to hydrogen-related degradation is needed. Neutron Radiography, based on the significantly larger mass attenuation coefficient of hydrogen in comparison to the attenuation coefficients of the base metal, has been proposed and used. One example is the inspection of aluminum aircraft components to find corrosion products which contain large amounts of hydrogen. For iron and steel, hydrogen embrittlement and stress corrosion cracking are the main concern, though formation of hydrogen compounds in larger cracks ( e.g. H2S ) can also
be troublesome.
Many of the components tested with neutron radiography are parts of aircraft, therefore of
light construction with small wall thicknesses. Due to the physical-metallurgical
larger. Examples are the piping and vessels in chemical processing and power plants. Often, single components cannot be dismantled for non-destructive testing and have to be
inspected in situ. For this, a transportable, for political and institutional reasons preferably
non-nuclear neutron source and test equipment has to be used.
Under these aspects a system for testing steel pipes, has to be given a detailed evaluation.
Fields of interest are the attenuation of the neutron-flux on traversing the pipe walls,
spatial and physical-metallurgical resolution as well as detection, visualization and
evaluation of results using a CCD-camera and computer-based system. 1.2 Approach
The major emphasis of this investigation is to evaluate a CCD-camera based system for its suitability as an instrument for non-destructive testing of steel components for hydrogen embrittlement. The necessary background for detection of hydrogen in metals using methods of neutron radiography is surveyed. A general view at who would be
interested in the results of such testing and at some earlier experiments is taken. The metallurgical background of hydrogen in metals is surveyed to find a basis for the form
and amount of hydrogen to be expected. A detailed description of the system to be used
includes a general view at the physics involved to be able to model the system for a
computer simulation. This simulation is utilized to study the response of the system to various internal and external parameters. Parallel to this, some preliminary work is undertaken to prepare for practical experiments which will be used to validate the results
of the computer simulation and evaluate system performance. Specific CCD-camera systems by various manufacturers are compared and some tested in short practical experiments. A specific system is then chosen which is the most suitable to the task.
Recommendations for future neutron radiography experiments using the chosen CCD-camera system are given.
The work and tasks done in the course of this investigation are described in the following pages, which have been subdivided into 7 chapters and an appendix. Chapter 1 is this introduction. In chapter 2, the background information on problems caused by hydrogen
and recent experiments on hydrogen detection are described. In chapter 3 the whole proposed detection system, its possibilities and limitations are outlined. Chapter 4 contains a computer model of the system and studies the influences of various system parameters. The chapter 5 gives information on preliminary experiments, practical components of the system and planned experiments. In chapter 6, the results of chapter 3
and 4 are analyzed and discussed. The final chapter gives conclusions based on the
CHAPTER 2
BACKGROUND
2.1 Areas of Degradation of Structures by Hydrogen
The degradation of construction materials by environmental influences is a great concern to any designer, builder and operator of structures made of metals. The damages can take on a multitude of forms and express themselves as a loss in reliability, a reduction in safety or increased costs due to additional maintenance, higher down time or replacement
of failed components. A classical example is the rusting of iron which causes thousands of motor vehicles to be taken out of service every year while other mechanical
components might still be in usable working order.
The reduction of a material's physical abilities by hydrogen is less obvious and hardly
perceived by the general public. The reduced optical obviousness results in greater
operational uncertainty and higher effort for detection.
At least three phenomenological different mechanisms can be attributed to the degradation of a material in which hydrogen plays an important role:
a.) Surface corrosion with formation of hydrogen-compounds ( e.g. Aluminum )
b.) Stress corrosion cracking, where an anodic dissolution with formation of
hydrogen occurs along the crack ( Metal+ + H20 -> Metal-OH + H+). Example:
SCC near welds in early BWR piping.
c.) Hydrogen embrittlement with the reduction of the ductility of a metal by
The distinction between b.) and c.) is not evident and is causing a large amount of discussion in the Materials Sciences [ 1, 2]. A subform of a.) is also found in systems where hydrates or hydrogen-compounds form in existing surface imperfections like small cracks and pits and cause growth of these imperfections through surface processes.
Often all three mechanisms are present on one structure and a clear distinction can not be
easily made. For the operator the actual process involved is not of primary concern, his
interest lies much more in the initial detection and the extent of the degradation. In a secondary step the mechanism becomes important, when countermeasures have to be
developed.
In the following, some examples are described, and the implications for the operation of the structure are given:
- Civil aircraft: Corrosion through hydrate formation of the surfaces between two bonded or riveted aluminum plates. The stability of the connection is decreased,
the structure is weakened. High loading on the structure may cause it to fail prematurely. FAA regulations require the airline to take the aircraft out of service
until necessary repairs have been undertaken.
- Military aircraft: On modern combat aircraft, bonding of surfaces is becoming more and more frequent. Composite materials and/or mixed structures (Plates and
honeycomb) are in widespread use. Ingress of moisture or condensation causes
corrosion and separation of layers, leading to a weakening of the structure. High g-loading during aerial combat or carrier starts and landings can lead to
1
Latanision R.M., Gastine O.H., Compeau C.R. Stress Corrosion Cracking and Hydrogen Embrittlement: Differences and Similarities. Proceedings of the Symposium on Environment Sensitive Fracture of Engineering Materials, Fall AIME Meeting, 24-26 October 1977.
2
catastrophic failure, disrupting the mission. Detection of degradation at an early stage is crucial to enable effective repairs.
- Shipbuilding, Crude Oil transportation by "Supertanker": The most obvious
form of environmental attack on a sea-going vessel is rusting. Quite apart from
this, operators of supertankers also face problems with Stress Corrosion Cracking
and hydrogen embrittlement. SCC occurs in the heat affected zone around welds, while hydrogen embrittlement can occur anywhere in the structure. Loss of ductility due to embrittlement seriously impairs the capability of the ship to absorb the loads of a rough sea or a large swell. As these large vessels can not ride the waves, they flex quite considerably in a rough sea. This flexibility is given by
the design and type of steel used. Hydrogen embrittlement can therefore lead to the breaking of parts of the structure with catastrophic results to the environment and profit margins of the ships owner.
- Petrochemical Industry: Large refineries contain hundreds of miles of pipes and
a multitude of reaction vessels. These can contain hydrocarbon-compounds at high temperature and pressure. This combination of the transported fluid and
physical properties makes the materials used for construction very susceptible to
any form of degradation by hydrogen. The pipes are often very long and due to temperature and pressure changes have to posses a certain degree of flexibility. A brittle region in a pipe is thus a potential breaking point. Pipe breaks can lead to large production losses, the bursting of a reaction vessel has the potential for serious risk to life and the environment. A fast, reliable way of testing the pipes
would help to secure operations and allow the timely replacement of degraded components. A factor to be considered for neutron radiography is that the fluid
transported has a high hydrogen content. This may be limiting for resolution purposes, on the other hand it may help to detect cracks and/or internal breaks.
- Power plants (Nuclear and fossil-fueled): Similar to the example above, a multitude of pipes are used to transport fluids at various temperatures and
pressures ( e.g. hot water under high pressure, superheated steam under high pressure and cold water under low pressure). Additionally, in nuclear power plants, these pipes are one of the barriers between fission products in the primary
coolant system and the environment. Internal and external forces act on these pipes during operation, so they need to display a certain elasticity/ductility to cope with these forces. Hydrogen embrittlement can be caused by dissociation of the water/steam or, in a smaller extent, by H2-gas dissolved in the water ( e.g. adding
H2 to bind 02 in BWR to fight IGSCC). Detecting degraded lengths of piping before damage occurs is not only an operational consideration, but also an
important issue for nuclear safety. In this application, the type of neutron source used ( i.e. nuclear or non-nuclear ) is of smaller importance, all the same, a "non-nuclear" source would facilitate operations. Difficulties for NDT of these pipes by neutron radiography are the thermal insulation often found on the outer diameter
and general accessibility.
2.2 Other Areas of Interest for Detection of Hydrogen
There is not only a metallurgical interest in detecting hydrogen and hydrogen-compounds
with neutron radiography. Other areas of science can also use this technology to facilitate operations. Some examples are:
- Detection of various levels of moisture and water in drilling cores. This would be useful for site characterization plans for repositories for radioactive waste. Another use might be the measurement of diffusion/water flow through a rock sample to evaluate porosity.
- Detection of oil in drilling cores. This is similar to the above idea, oil companies could use this technology to evaluate sites for their suitability for future
exploitation.
- Testing of manufacturing processes for compound materials, like Aluminum-Carbonfiber mixtures. The inclusion of the carbonfiber array into the compound plate could be visualized and manufacturing defects found. Carbon and aluminum have mass attenuation coefficients which are different by about one order of magnitude. Even though the difference is smaller than in the hydrogen-steel
system, it can be sufficient for such testing.
- Detection of explosives, for example in air baggage. Explosives are organic
compounds, one of the main elements is hydrogen. This is a much more specific method to search for bombs than X-rays, as these can only give density
differences helping to find specific geometries. The main problem here is that
baggage usually is filled with organics, which makes detection difficult. A
solution to this is to search for nitrogen, which is the usual signature for
explosives. Nitrogen can be detected with fast neutron technology by measuring the characteristic ( gamma ) radiation resulting from inelastic collisions.
Considerable research is going into this field and some systems are in operation.
Detailed information is classified.
2.3 Two Examples of Recent Research
a.)A multi-dimensional tomographic imaging device for non-destructive testing of materials and complex assemblies was built and operated. The results are
described in [ 3 ]. The function of a simple system involving a reactor neutron
3 McFarland E.W., Lanza R.C., Poulos G.W. Multi-Dimensional Neutron-Computed Tomography Using Cooled Charge-Coupled Devices. IEEE Transactions on Nuclear Science. April 1991, Vol. 38, Number 2.
source, an object handling device, a scintillator screen detector and a
CCD-imaging system was tested under various conditions. Limits on spatial resolution
where found to be in the 100 tm section in small samples.
With these experiments, the basic feasibility of a system using a CCD-camera
could be shown. A great advantage over film-based methods is an increase in the dynamic range by a factor of at least 100. This factor can be increased by further
development of the system and the use of better components.
b.)Detection of corrosion on aircraft components and hydrogen ingress on Zircalloy fuel cladding tubes by neutron radiography. For these experiments [ 4 ],
cold neutrons were used which enhance the differences in the attenuation
coefficients between aluminum and hydrogen giving higher sensitivity. The experiments were done to quantify the detection capabilities of a subthermal neutrons system and looked at corroded aluminum aircraft components. Also, for nuclear power applications, zircalloy tubes were examined. The imaging system utilized was a gadolinium screen with single coated X-ray film. Excellent results were achieved even with the limited dynamic range of this system on the corroded aircraft components in detecting surface, subsurface and pit corrosion. With the zircalloy tube, neutron radiography showed hydrogen ingress into the inside of the tube. Various loadings of hydrogen could be detected when compared to a
calibrated reference object. This part of these experiments constitute an important starting point for the investigations of this thesis.
4 Leeflang H.P., Markgraf J.F.W., Detection of Corrosion on Aircraft Components by Neutron Radiography. Proceedings of the Fourth World Conference on Neutron Radiography, May 1992, San Francisco (in press).
CHAPTER 3
SYSTEM DESCRIPTION
3.1 Theory of the Attenuation of a Neutron Beam
The physics involved in the process of visualizing hydrogen in steel components by
neutron-beams are simplified to where they are relevant for the modeling of the system. The probability of occurrence of a nuclear reaction between the incident neutron and the
atoms of the object is expressed in terms of the concept of cross-sections. For these
observations, the total cross-section of an element is used. The total cross-section, at, is
mainly a function of the element ( Atomic Number ), the isotope ( Mass Number ) and the
energy of the incident neutron. The neutrons used here are in the thermal, respectively. cold energy range, i.e. the energies are smaller than 0.025 eV. The total cross-section for an element was found by experiments. Many of these cross-sections have been compiled
at BNL ( Brookhaven National Laboratory ) in a series off handbooks of neutron sections, commonly known as " Barn-books " (Named after the unit for neutron
cross-sections. 1 barn = 10-24 cm2 ).
A beam of neutrons passing through a material interacts with the atoms in the material:
N
o
N i(x)
X
Ni(x) = No e-CIX
NO: Source neutron flux [ n/cm2 s]; Ni(x) : Neutron flux after passing through x [n/cm2s]
pt: Linear attenuation coefficient [ cm1 ]; x: thickness of object [ cm ]
The linear attenuation coefficient can be expressed as:
p = n Z at (3.2)
n : Number of atoms per unit volume [ # / cm3 ]; Z : Atomic number; at : Total
cross-section [cm2]
More often, the mass attenuation coefficient is given, as n is rarely known and has to be
calculated:
It/p=nZat/p=
(no P/A)(Z/p)at=no(Z/A)Ct
(3.3)
p: density [ g / cm3 ]; no: Avogadro's number [ mole- ] A: Mass number Introduction of the mass attenuation coefficient in Eqn. ( 3.1 ):
Ni(x) = NO e-l x p ( 3.4 )
This form makes accounting for various material properties in the x-direction easier. Assuming we have an object with two different material properties in the x-direction:
N
o
N i(x)
X
1X
2Figure 2. Neutron beam passing through an object with two regions with differing properties.
At position A: Ni(xl) = NO e-H1 P1 Xl ( 3.5 )
At position B: Ni(x) = Ni(xl+x2) = Ni(xl) e-H2 P2 X2 ( 3.6 )
Insert ( 3.5 ) into ( 3.6 ):
Ni(x) = (N0 e 1 P1 X ) e-2 P2 X2 = No e-(1 P1 Xl + g2 P2 X2)
(3.7)
With this form, varying material properties along the path of the neutron beam can be treated.
This effect is what is used to try to detect hydrogen in steel components. Looking at the graph .n appendix C, it can be seen that the mass attenuation coefficient for thermal
neutrons of H is several orders of magnitude higher than the value for Fe ( or Al ). Assuming that the change of the density of steel due to the inclusion of hydrogen is negligible, the following situation presents itself if part of a steel object contains hydrogen:
N
o
N i(x)
X
1x
2Figure 3. Neutron beam passing through an object containing hydrogen.
Region 1: Pure steel, contains no hydrogen. Density p.
Region 2: Steel with small amount of hydrogen. Density p. Inserting given values into eqn. ( 3.7 ) gives:
Ni(x) = No e -(l P X1 + JL2 P X2) = No eP (pi1 Xl + ~t2 X2)
The mass attenuation coefficient for region 1 is simply
The attenuation coefficient for region 2 is made up out ,U2 for cases of hydrogen in steel will be called Itres
Assuming that a fraction of the volume of the steel has
can write:
L2 = -res = p1 (1 - f) + pH f
the coefficient for the pure metal. of two parts. For future reference,
been replaced by hydrogen, one
(3.10)
f: fraction of hydrogen; 'H : Mass attenuation coefficient of hydrogen [ cm2 / g ] As hydrogen is only present in small amounts, f would be a small numerical value. For this reason, the expression of p for ppm of hydrogen is introduced.
p = 106 f p : fraction of H in ppm
Substituting this into eqn. ( 3.10 ):
Ftres = 1'1 (1 - P/ 106) + H (P / 106) (3.11)
Eqn. (3.11 )into(3.8):
Ni(x) = N eP [ 1 Xl + { (1 - p / 106) + H (P / 106)} X2 ] (3.12)
3.2 General description of the System
The proposed system for the detection of hydrogen in steel consists of the following sub-systems:
a.) Neutron source with collimating device. b.) Object
c.) Neutron detection unit d.) Optical system
Scintillator
Source + Collimation Screen Mirror
m _ I
Object
C
Computer
Figure 4. Schematic of neutron radiography system
The neutrons come from the source, pass through the collimating device and hit the object. The object can be moved about with the handling device to enable two-,or if
necessary, three-dimensional scans. The remaining neutron flux behind the object hits the detection unit where each incident neutron is transformed into a certain number of
photons. The photons are gathered by a lens onto the front surface of a
Charge-Coupled-Device ( CCD ) chip. This produces an electrical signal proportional to the number of
incident photons ( and to the number of neutrons). The analog electrical signal is
converted by an A/D-board and made available in a digitized form as an image on the computer monitor in various gray-shades ( or color ). The pictures can be manipulated, enhanced and analyzed on the computer using imaging software. If necessary, a
tomographic reconstruction can be made.
3.3 Detailed Review of System Components 3.3.1 Neutron Source
1.) A certain minimum "strength" ( Intensity ).
2.) Constant flux with small variations ( 6 / t small, although this becomes less important with longer integration ( exposure) times ).
3.) Constant level over a sufficiently large time to acquire data.
The most obvious choice for this source is a nuclear research reactor. The negative points are that the whole test equipment and the object to be tested has to be transported to the reactor. Furthermore, the time schedule for the experiments has to be coordinated by reactor operations with other scientific groups using the reactor. The neutron flux in the
beam port may be "contaminated" by y-radiation, which imposes certain additional demands on shielding of the camera.
Non-reactor sources can be Cyclotrons with the appropriate targets, e.g. a Be ( p,n )-reaction. The same problems as for the reactor above can apply ( immovable,
coordination of experiments ). On the other hand, there are some quite compact Linear
Accelerators, which can be used combined with a Be ( p,n )-target. The problem with
these system often is the available neutron flux. The smaller and more compact a unit gets, the less powerful it tends to be. Similar to a reactor source, the neutron beam can be
contaminated with y-radiation, necessitating additional shielding or leading to optical
disturbances in the detection system.
A further possibility is the use of a pulsed source. The neutronic power densities of these
normally are quite high. To be able to utilize this kind of source, a timing device between the source and the detection/optical system has to synchronize the pulses with the camera
shutter.
The principle demands on a source for this system for non-destructive testing are:
- Transportable. The source has to be moved to the site of the component testing, if possible by one or two people.
- Powerful. For steel components with an average wall thickness a certain
- Non-nuclear. This is mainly a " political " issue. In the precise sense of the word,
any device that produces neutrons at any time is based on nuclear reactions and therefore "nuclear". The meaning of the term "non-nuclear" is that it can not be a
reactor or radioactive elements which need special handling, shielding and institutional control at all times.
- Reasonable power demands. For on site testing, the power demands have to be met by normal, industrial standard power supply circuits. If absolutely necessary,
a separate, small generating group could be imagined.
- Easy to handle. The source has to be moved around on the site, in some cases
even around the circumference of a pipe.
This list is not complete, but it already shows a few of the many, sometimes seemingly
contradictory demands set upon the neutron source. It will by no means be simple to meet
all of these demands, some compromises are inevitable. A weighting of the demands and
comparison to the possibilities will have to take place for any possible source. Work on looking for and evaluating sources is ongoing. For the experiments described in this paper, a reactor or stationary linear accelerator [ 5 ] can be used, as the main purpose is to
evaluate the basic possibilities of the system under laboratory conditions.
3.3.2 Object Handling
Object handling is a concern for a system that is set up in a laboratory environment. A
transportable system that is used in power or chemical plants and on other large objects will have to be moved around the ( stationary ) object.
Object handling, meaning the movement of the object during a neutron radiography
experiment, has to be done remotely. Many systems are available with two- and
three-5 Strictly speaking, an accelerator is a RF quadrupole. The term " Linear Accelerator " has found widespread use, even though it might not be correct in an absolute sense.
dimensional, remotely controlled tables. The tooling industry uses such devices, five or six independent axis can be controlled from one input device. Often, these are interfaced to a computer so that defined, pre-recorded programs of movements can be run.
Simple handling devices for these experiments are available for use with small computes,
e.g. the " nuDrive 3-axis system " which interfaces on to a Macintosh Computer and can
run a preprogrammed sequence of movements. 3.3.3 Neutron Detection Device
For the detection of the neutrons after they have passed through the object, a Scintillator
Screen is utilized. It absorbs the neutrons and emits a certain constant average number of
photons for each incident neutron. The scintillator screen that is going to be used for these experiments is a 6LiF-ZnS type, supplied by Nuclear Enterprises , Part -# NE 426. The wave length of the emitted light is in the blue-green range. Although this is not the optimum wavelength for detection by a CCD, a quantum efficiency 6q of about 0.3 can
be expected [ 6 ]. The reason for choosing this detector was commercial availability, although import into the USA took approximately two months as 6Li is a controlled substance. The detection efficiency cd for this screen is 0.15 for thermal neutrons that
incident at an angle of 900 to the screen. An advantage of this screen is a very small detection efficiency for y-radiation, as some of the sources mentioned in 3.3.1 have
noticeable amounts of " y-contamination " along the neutron beam.
3.3.4 Optical Lens
The optical lens is mounted to the front of the CCD-camera. The function of the lens is to
gather the light emitted from the scintillator screen onto the front surface of the CCD-chip. The characteristics of the lens strongly influence the detection capabilities of the
6
ZnS uses either an Ag actuator or a Cu activator. The Cu activator produces a light which is closer to the green-range and hence is somewhat better in conjunction with Charge-Coupled-Devices.
system. A large amount of light is lost due to the minification of the larger scintillator screen ( object size ) on to the CCD-chip ( image size ).
The characteristic values for a lens are:
- Focal length ( f [ mm ] ). This is the distance from the lens to the point at which incoming parallel rays focus. Some camera lenses have continuously variable
focal length within certain boundaries.
- F-number ( Aperture; F [ - ] ). This is the ratio of the focal length to the lens diameter. A lens with a large diameter has a better light-gathering power and a smaller f-number. The F-number can often be adjusted on camera lenses to
account for different light conditions.
The lens equation can be used to calculate the image distance if the object distance and
the focal length are known.
1/p+ /q= 1/f (3.13)
p: Distance object to lens, q: Image distance, f: Focal length of the lens
The minification, m, is defined as the ratio of the object height to the image height:
m=Ho/Hi
(3.14)
Ho: Object height [ mm ], Hi: Image Height [ mm ]. This can also be expressed by the ratio of p to q.
Using these ratios and the lens equation, various information can be found based on given
data. For example, if the focal length and the desired minification are given, the image distance and object distance can be calculated:
Image defects: The ability of a lens to form a perfect optical image is limited by certain
defects. These are called aberrations. A simple, non-color corrected lens will have color
aberrations, caused by different wavelengths of light being refracted at slightly different
angles. There are other defects, like astigmatism, coma and spherical aberration that cause an image to be blurred. A sign of the quality of a lens is how small the effects of these
defects are, closely controlled manufacturing, adjustment and the appropriate choice of
lens material can keep these defects at a minimum.
Apart from the effects mentioned above, there are certain optical effects that limit the
amount of light that can be captured by a lens system. This is given by the factor L, which expresses the fraction of light captured from a screen ( Lambertian radiator) into a lens and is valid for small angles in the following form:
L = 1 / {2F(m + 1)}2 (3.17)
Example: Object height Ho = 100 mm. CCD height 1150 x 22.5 lpm = 25.9 mm.
F-number of the lens F = 0.95.
m= Ho / Hi = 100/ 25.9 = 3.86
L = 1 / {2F(m + 1)}2 = 1 / {2 x 0.95( 3.86 + 1 )}2 = 1.17 x 10⁻²
This shows, that only about 1.2 % of the light from the scintillator screen gets captured by the lens. Changes in m and/or the F-number of the lens towards higher values make
this number smaller proportionally to the inverse square. Just using a lens with an F-number of 1.3 reduces L to 0.63 %, about half of the above value. The reasoning to use a larger CCD-chip also becomes obvious, as m is inside the squared brackets in the
denominator too.
Furthermore, the lens is not perfectly transparent to the light passing through it. A certain amount of light gets lost due to reflection and refraction processes. A typical value for the
Various lenses supplied by many name brand manufacturers where surveyed for this system. Four major manufacturers with interesting products for our purposes where: · Jos. Schneider Optische Werke Kreuznach Gmbh & Co. KG in Germany
· Rodenstock Precision Optics, Inc. in Rockford, Ill. ( US Distributor) · Canon USA, Inc. in Englewood Cliffs, NJ
· Fujinon USA, Inc.
In an effort to limit the size of the test equipment, a so called "Wide Angle Lens" was searched for. These are characterized by focal lengths smaller than 50 mm. With such a lens it is possible to image a given object size onto a predetermined CCD at a smaller
object distance. The disadvantage of these lenses are higher distortions, especially in the
edge areas with smaller focal length. The following lenses were compared:
Table 1. Comparison of Lenses
Lens Name Focal Length Max. Aperture Price ( 1993)
Schneider XENON 17 mm 0.95 $
865.-Schneider XENON 25 mm 0.95 $
738.-Schneider XENON 42 mm 0.95 $ 1100.- ( approx. )
Canon PH6x8 8 - 48 mm 1.0 (at ? focal $ 800.- ( approx. )
Zoom length) Rodenst. TV- 42 mm 0.75 Heligon Rodenst. TV- 50 mm 0.75 Heligon Fujinon CF25L 25 mm 0.85 $
350.-After comparing the technical data sheets, calculating some possible layouts and taking into account the cost/features ratio, the Fujinon CF25L was acquired with a C-Mount. This should be sufficient for the first set of experiments and constitutes a great
improvement over the TAMRON 28 - 70 mm zoom lens with f-number 3.5 used in Ref. [3] ( see footnote p. 9 ).
3.3.5 CCD-Camera Systems
The CCD-Camera System is made up out of several components: 1. The CCD-Chip in the Camera Head.
2. The Camera Head with the Shutter, Cooling and Power Supply for the CCD-Chip, Preamplifier Circuitry, Lens and Camera Casing ( with Mounting Frame ).
3. The Camera Controller. This controls the Shutter, camera cooling, data acquisition,
and transfer to the computer. It contains the A/D Converter(s) and the Power Supply
for the Camera Head.
4. The Computer Interface Card. This acquires the data from the Controller A/D
Converter and makes it accessible to the computer data bus.
5. The Computer System. The data from the interface card can be stored on a hard disk, displayed on the monitor, enhanced and analyzed. Hardcopies of images can be made on a connected printer or data transferred over a network.
Components 1.) and 5.) can be specified by the user in quite a large range of different
makes and types for one given system manufacturer. The other parts are mostly
predetermined by the manufacturer, although some choices for the A/D Converters do
exist.
The choice of the CCD-chip and A/D converter directly influences the quality of the
image. Some important characteristic values for the CCD-chips are:
· Number of horizontal and vertical pixels. · Size of an individual pixel.
· Readout Noise.
· Dark Charge ( Dark Current, Dark Noise ).
· Dynamic Range ( measured in bits of parallel data processing ).
· Grade, specified by the number of defective pixels in the array.
The number of horizontal and vertical pixels and the pixel size directly influence the size
of the CCD-chip. This then goes into eqn. ( 3.14 ) and influences the light-capture
fraction L in eqn. (3.17). A larger chip will thus be beneficial to the factor L, giving a
better overall efficiency of the scintillator-camera system. The number of pixels also
influences the spatial resolution. A small number of pixels in either dimension will give a
bad, very coarse resolution of the object. This is especially important for the detection of
hydrogen in steel, as changes in the concentration can take place over small distances.
Readout Noise influences the optical resolution of the CCD-chip, the capability to resolve small differences in light intensity. If the readout noise is high, subtle variances in the
light intensity will get "drowned" by the noise. This is a very important area for the
proposed system, as the basic principle relies on the detection of small variances in
neutron flux, which give proportionally different brightness at the scintillator screen. A
more detailed discussion of this subject will take place in chapter 3.5.
Dark Charge, often also called Dark Noise ( or -Current ), is relevant for the minimum
flux that can be detected. This relates to the source flux, the object geometry and the
object properties. The dark current is the amount of current the CCD-chip passes on to the preamplifier and the controller even when there is absolutely no light incident on the
CCD. A high dark current will "cover up" a very low intensity light source, disabling the
detection. Dark current on CCD-chips is proportional to the temperature and usually reduces by half with every decrease in temperature by 5 - 6°C. This is the reason why CCD-cameras for scientific low-light experiments are mostly cooled. The influence of this value on the neutron radiography system will be described in chapter 3.5.
Dynamic Range is measured in bits on a CCD-camera system. This expresses how many
bits are available at the A/D Converter to describe the status of an analog value, in this case the light intensity ( measured as a charge ) at a pixel. A small number of bits enables less values to be assigned to a given state, e.g. 1 bit gives 21 = 2 values ( "on" or "off' ). With 8 bits, 28 = 256 shades of grey can be described. A large dynamic range is
desirable, similar to the considerations for readout noise. Here, the influence is on the
ability to display small variances in the light intensity.
The quality of CCD-chips are specified by grades, grade 1 being the highest quality. This
classification is done by testing the device after the manufacturing process. Every grade
has a specific limit on the number of faulty points, clusters and columns. The grade has a direct influence on the price of the chip. As the object can be moved in relation to the surface of the CCD in these experiments, a lower grade chip can be chosen without negative effects.
The choice of Computer System influences the depth of possible data analysis and the speed at which this can be done. As a full readout of one image can easily represent several megabytes of information, the demand for a fast computer with large storage capacity and plenty of memory becomes obvious. Furthermore, the display subsystem (monitor and display adapter ) should be able to show the full information received from
the camera. For a CCD-Chip with 1000 x 1000 pixels, the monitor would have to be able to display at least the same number of picture points. The same applies to the dynamic
range, where the small variances in light intensity have to be equally well represented on the monitor for analysis.
3.3.6 Enclosure and Mounting for Scintillator and Camera
In an ideal case, the CCD-camera should only "see" the light emitted by the scintillator screen. All backlight and diffuse light from the surrounding room has therefore to be avoided. This is done by enclosing the scintillator screen, the lens and the CCD-chip in a
light-tight box. Furthermore, to keep the y-radiation of the neutron beam away from the sensitive camera, a mirror is used to place the camera at an angle ( e.g. 90° ) to the axis of the beam.
The box has to be made out of a material that is not neutron activated, so that it can be
moved or settings changed without necessitating additional shielding or radiation protection. For this reason, aluminum was chosen. The box is constructed of a welded
aluminum frame for stability with aluminum plates fixed to it by plastic screws. The plates are removable for initial setup and adjustment of the mirror. The size of the box is approximately 90 cm x 30 cm x 30 cm. Details of the construction are included in appendix D
3.4 Basic Modeling Of System
For the computer simulation of the system in chapter 5, it is necessary to model the
individual components as a set of equations. These equations can the be connected
together to give the response of the system to a given set of input parameters. The influence of variations on the results can be studied.
Most of the components can be modeled very simply by giving efficiencies for the processes involved.
Source: The source is represented by a unidirectional neutron flux incident on the object.
In most cases this is not the flux of the actual source ( e.g. reactor ) itself, as losses are involved in the thermalization, guidance in the beam-tubes and collimation. The source flux is represented by the symbol No ( see also eqn. 3.1, p. 12 ) and expressed in n / cm2s.
Object: The object is described by the attenuation of the neutron flux, described by
equation 3.12:
This equation is valid for a plate geometry. For a pipe, the lengths xl and x2 have to be
redefined.
Steel
rogen
'O x
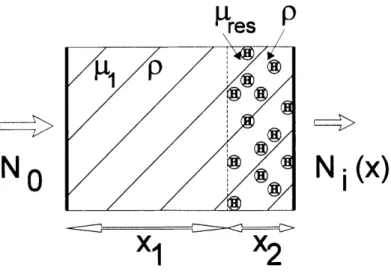
Figure 5. Pipe geometry for neutron beam attenuation.
For this modeling, hydrogen embrittlement of the inside of the pipe is represented by a low uniform re-distribution of hydrogen over a certain depth of the inside of the pipe. Given: Inside radius rO, radius of uniform hydrogen loading rl and outside radius r2.
The values y 1, y2 and y3 have to be determined.
y tot = yl + y2 +y3
Applying trigonometry, the results for y 1, y2 and y3 can be found:
y3 = { r 2 - ( r2- x )2 )
y2= {ri
2-(r2-x)
2}-y3
(3.19)
( 3.20 )
42
(3.18)
yl ={ 2r2x-x 2 } -y2- y3
={ 2r2x-x
2}- {rl
2-(r2-x)
2}
(3.21)
These values for the lengths can then be inserted into equation 3.12. As the neutron beam will also have to traverse parts of the fluid inside the pipe, the length y3 had to be
introduced.
Ni(x) = NO exp[- {ILFe 2 yl PFe + res 2 y2 PFe + tfl 2 y3 pfl }] (3.22)
,tFe: Att. coef. of Iron; fl: Att. coef of fluid in pipe; PFe: density of Iron; pfl: density of fluid.
Scintillator Screen: Ni(x) is the number of neutrons that strike the front surface of the scintillate screen. The scintillator screen detects:
Nd = Ni(x) Ed ( 3.23 )
Nd: Neutrons detected by scintillator [ n / cm2s ]; Ed: detector efficiency.
The transformation of incident neutrons into photons takes place with a constant
transformation factor, given for the type of screen and neutron energy:
N' : Transformation Factor [ e / n ].
Lens: The lens can be described with the light-capture fraction L of equation 3.17:
L = 1 / {2F(m + 1)}2 (3.17)
CCD-Camera: The first number of interest is how many photons are incident on the
front surface of the CCD-Chip. This is proportional to the neutron flux incident on the front side of the scintillator screen.
P Ni(x)
P = Ni(x) L El m2 = Ni(x) L 1EdN m2 ( 3.24 )
P: Photon flux incident on front of CCD [ e / cm2s ]
The factor m2 comes from the decrease in area due to minification.
The second number of interest is how many electrons ( = current ) are available at the
output of the CCD-Chip. This is the signal that is then used to generate an image.
Ne = P q = Ni(x) L E1 Ed Eq N¥ m2 (3.25)
Ne: Signal at output of CCD-Chip [ e / cm2s ]; sq: Quantum efficiency of CCD-chip. For most uses, the strength of this signal for one pixel of the CCD-Chip is of interest. To calculate this number, Ne has to be multiplied by the ratios of the image area to the CCD area and the CCD area to the total number of pixels.
Ne [ e /pixel s = Ni(x) L l d q N m2( Ai / #p) (3.26)
Ai: Image area, measured on scintillator screen [ cm2 ]; #p: Total number of pixels on
CCD-Chip.
Camera Head, Controller, Computer: These parts of the system are not included in the
modeling anymore, thus Ne in [ e / pixel s ] is the final result. The effects of
amplification, conversion from an analog into a digital signal and modification into
output signal of the CCD-Chip and the grey-shade on the monitor will have to be found
by calibration on the actual system.
3.5 Influence of Noise on System Performance
a.) First approach:
The noise of the CCD-camera system is made up of three components: - Statistical noise of the signal ( "Shot noise" )
- Readout noise of the CCD-chip - Dark noise of the CCD-chip.
The total noise of the system can be written as:
a(t)= { (P+ B)tq+Dt+Nr2
}
(3.27)
a: Total noise of system [ e / pixel s ]; P: Photo-electron flux incident on CCD [ e / pixels]; B: Background photo-electron flux on CCD ( "Background light" ) [e/pixel s ];
D: Dark noise [e / pixel s ]; Nr: Readout noise [ e RMS / pixel ]; t: Integration time [ s ].
For further calculations, B will be assumed to be zero, there is no background light on the
CCD, it is enclosed in a light tight box. In this case, the term ( P + B ) t q can be replaced by Ne t (see equation 3.25 ). Equation 3.27 can then be simplified to:
(t) = { Net + D t + Nr2 } (3.28)
In electronic systems, the absolute noise level is seldom given. The use of the " Signal to Noise Ratio " ( SNR ) is much more common, as a dimensionless comparison,
given by Ne. The SNR is dependent of the integration time t required to acquire the image.
The time dependent SNR can then be written as:
SNR(t) = Ne(t) / c(t) ( 3.29 )
Inserting 3.28 into 3.29:
SNR(t)=Net/ Net + D t + Nr
2(3.30)
Two regions of the time dependent SNR can be distinguished:
For very short exposure times, the read noise Nr becomes the dominant source, the other terms can be omitted with a good approximation. In this case, equation 3.30 reduces to:
SNR(t) =( Ne /Nr ) t (3.31)
This is known as the " Read noise dominated area ".
For longer exposure times, the read noise is negligible. Equation 3.30 reduces to:
SNR(t) =( Ne / { Ne + D } ) [ ( 3.32)
This is then called the " Shot noise dominated area ".
The dependance of the various components on exposure time can be summed up: Dark noise - t
Statistical noise- 4it Read noise = constant
Signal - t
20 15 / or , Signal JU O 10 ., 5 n or ,e Dark Noise
Read Noise Dominated i Shot Noise Dominated * Read Noise
l
___________
Ni e
o m
l
t
I
-
Shot
Noise
1
t
r
* * * i i
.
H
t A A A
-0.1 0.3 0.5 0.7 0.9 1.1 1.3 1.5
Time [ s
Figure 6. Example of a SNR-Diagram.
b.) Second approach:
The noise of a system can also be approached by first looking at the purely statistical noise and including the system specific parameters later.
Generally, the statistical noise of a signal is equal to the square root of the signal. For the
" signal flux " Nd of the scintillator screen, the statistical noise is lNd . The statistical
noise of the electrons produced at the CCD is also the square root of this signal. We want
to relate this noise to the detected neutron flux at the scintillator screen. For this, we have to introduce the number Nc, the number of photons produced per detected neutron.
Nc = L Ny 61 Eq ( 3.33)
The component of the noise added by the CCD-chip, expressed as detected neutrons, is proportional to 1 / N . To calculate the absolute value, we have to multiply with Nd. The
components then are added up in quadrature:
n2 = Nd + Nd ( 1 /Nc )
Noise:
a
n{Nd+(Nd/Nc)
(3.34)
on: Noise expressed in terms of the number of neutrons [ n / cm2 s ]
By multiplying equation 3.34 with Nc, we get the statistical noise in terms of electrons. The system specific noises, i.e. readout noise and dark noise, are added to this statistical
noise in quadrature:
Ge2 = Nc2 [ Nd + (Nd / N ) ] + D2 + Nr2
Noise: e = { N2 Nd [ 1 1 / N ) ] + D+( 2+Nr 2 (3.35)
ae: Noise expressed in terms of the number of electrons at the CCD [ e / cm2 s ]. By applying the area reduction factor ( Ai / #p+ ), this can then be transformed into
[e/pixel s] There is no time dependence on this way of expressing the noise, as integration time is not taken into account in equation ( 3.35 ). This can be done by multiplying the appropriate terms in the equation by the integration time. ( Signal and dark noise )
The noise influences system performance in two ways:
1. In the read noise dominated region, it sets the minimum source flux needed to give a signal that is above the read noise with all other system parameters given.
2. In the shot noise dominated region, the minimum resolution for variances in the signal is determined. The variance in the signal that can be detected ( Difference in steel without hydrogen to steel with hydrogen => Hydrogen loading ) has to be larger than the shot noise.
CHAPTER 4
MODELING AND COMPUTER SIMULATION
4.1 Basic Model
The basic model used for the simulation of the neutron radiography system is made up of
the components as described in chapter 3.4. The fundamental equations to describe the system are 3.22 and 3.26. These can be used to evaluate the response of the system to various parameter changes. Calculations of the Signal-to-Noise ratio will also be based on these equations, as they supply the input data for the signal.
A method had to be found to be able to change parameters quickly and make results
visible numerically as well as graphically. Calculation by hand ( with a calculator ) is possible, but would be time consuming and error-prone. As the same type of calculations
have to be repeated several times, the spreadsheet program " Lotus 1-2-3, Release 4. " (for Windows)was chosen. Some calculations were also done with " MathCAD 3.1 " (
for Windows ), as this has the ability to solve equations for an implicit variable. Most of the results will be presented in diagrams of signal at the CCD-chip output vs. distance x,
measured from the outer diameter of the steel pipe.
Basic assumptions for the spreadsheet model: This model of the system has been kept as simple as possible so that the reaction to changes can be made visible. The
assumptions are:
· The " Source Flux " is the flux incident on the object.
· There are no scattered neutrons incident on the detector screen.
· The material properties density and mass attenuation coefficient are uniform over the whole object.