HAL Id: insu-00585270
https://hal-insu.archives-ouvertes.fr/insu-00585270
Submitted on 12 Apr 2011
HAL is a multi-disciplinary open access archive for the deposit and dissemination of sci-entific research documents, whether they are pub-lished or not. The documents may come from teaching and research institutions in France or abroad, or from public or private research centers.
L’archive ouverte pluridisciplinaire HAL, est destinée au dépôt et à la diffusion de documents scientifiques de niveau recherche, publiés ou non, émanant des établissements d’enseignement et de recherche français ou étrangers, des laboratoires publics ou privés.
Confinement effects on water structure in membrane
lyotropic phases
Régis Guégan
To cite this version:
Régis Guégan. Confinement effects on water structure in membrane lyotropic phases. Journal of Colloid and Interface Science, Elsevier, 2011, 358 (2), pp.485-490. �10.1016/j.jcis.2011.02.035�. �insu-00585270�
1
Confinement effects on water structure in
membrane lyotropic phases
Régis Guégan
*Institut des Sciences de la Terre d’Orléans, CNRS-Université d’Orléans, 1A Rue de la
Férolerie, 45071 Orléans Cedex 2, France
February 11 2011
*To whom correspondence should be addressed. E-mail: [email protected].
2
Abstract
The change of the water structure in aqueous solutions of the tri-ethyleneglycol mono n-decyl ether (C10E3) was studied by micro Raman scattering. The results obtained on the O-H
stretching band show that the behavior of the hydrogen bonding (H-bonds) water network can be used as a probe to follow the lamellar (Lα) to sponge (L3) phase transition. In the lamellar
phase, the stack of the surfactant molecules aggregated into a two-dimensional structure (membrane) acts as a soft confinement system for the H-bond water network of which the regular tetrahedral structure is perturbed. The change of the planar organization of the membranes to a highly disordered and infinite array of bilayers in the sponge phase amplifies the surface of contact between amphiphilic surfactant and water molecules which drives a strong disruption of the regular tetrahedral H-bonding water network.
3
1. Introduction
The study of the physico-chemical properties of water in confined geometry at a mesoscopic scale is important to technological and biophysical problems, such as micro-fluidic system, lab on chip materials, enzymatic activity and functions of membranes [1-4]. Numerous investigations have been devoted on the understanding of confined water and other liquids into mesoporous materials such as MCM-41, Vycor, clay and porous silicon [5-18]. These studies have revealed effects of confinement which affect both the structure and dynamics of the confined system of which properties differ strictly from these-ones of bulk liquid [1-18]. Surfactant systems self assemble into a variety of structures which present particular organizations of the membranes and provide model system to host small or significant amounts of water for mimic confinement in biological objects [1, 19-22]. The formed lyotropic liquid phases have been considered as intermediate between complex biological water cavities and rigid wall pores in mesoporous media [21]. Despite numerous studies on nanoconfined water, a little is known about the effect of confinement on water molecules arranged into H-bond networks. The past infra-red and Raman scattering investigations have shown a significant change of the tetrahedral H-bonding water network in micelle systems for a confinement lower than 10 nm [21, 22]. In the same range of scale, Marinov et al have highlighted a change of the characteristics of water confined in a lamellar, and reverse micelle phases [22]. However, no studies have focused on the investigation of the change of the H-bond water network confined into several membrane phases or when the system undergoes a membrane reorganization which is of great importance since the water network has been recognized to contribute to the hydration force acting between membranes [23, 24].
4 The bulk water structure is understood as a tetrahedral ice like arrangement which competes to a non tetrahedral arrangement [25-27]. The Raman spectroscopy gives vibrational spectra which are sensitive to the local environment of molecule and allow apprehending the disruption of the water network. In particular, the band in the region from 3000 to 3700 cm-1, corresponding to the O-H stretching can be convoluted into three Gaussian components [22]. The lower frequency component at about 3200 cm-1 refers to collective in phase stretching vibrations of the tetrahedral H-bonding network, while the second component at about 3400 cm-1 is assigned to the not in phase vibrations between the nearest or higher neighbor molecules [25]. The last component at high frequency corresponds to non H-bonds or hydrogen bent structure. The measure of the integral intensities of both components gives information of how the regular tetrahedral H-bonding network of can be disrupted. In this approach, several studies on bulk water and once confined in surfactant systems, have used the ratio of the component at about 3200 cm-1 to the component at about 3400 cm-1, defined as
ROH which represents the fraction of water in the system that takes part in the regular
tetrahedral H-bonding network [22, 25, 28-30].
The tri-ethyleneglycol mono n-decyl ether (C10E3) and water system forms internal
structures organized by surfactant bilayers such as the lamellar (Lα) and sponge (L3) phases
[31, 32]. The lamellar phase, Lα, is characterized by a stack of surfactant molecules
aggregated into two dimensional structures (membranes) and layers of water whose organization is at long range order which displays a smectic order [32, 33]. On the other hand, for another range of temperature and concentration, the surfactant self organizes in a disordered and infinitely connected array of bilayers, called sponge phase or ‘plumber’s nightmare phase’. Both phases are present in neighboring regions in several phase diagrams and the transition from Lα to L3 phase is of first order and is triggered by variations of saddle
5 Previous investigations focused on the changes in water structure in extended polyatomic surfactant structures (lamellar to reverse micelle structures) by the increase of surfactant concentration [21, 22]. The aim of this study is to quantitatively evaluate the extent of perturbation of water structure confined into two lyotropic membrane phases which shows two levels and organization of the surfactant bilayer (1D and 3D confinement for the lamellar and sponge phases respectively) and to follow its change in temperature. For this purpose, the changes in water structure of the lamellar to sponge phase transition in the C10E3-water
system is studied by Raman scattering experiments with an accurate analysis of the O-H stretching mode which allows estimating a contribution of strongly and weakly H-bond water molecules. The intensity and shape of the O-H stretching mode provide information on how the fraction of confined water in the system, that takes part in the regular tetrahedral structure, changes during the reorganization of the surfactant bilayer when the system transits from 1D to 3D organization membrane phase.
2. Materials and Methods
2.1. Materials and experimental setup
The surfactant C10E3 was purchased by Nikko Chemicals, Inc., Tokyo is assumed to have a
purity better than 99.8 % and was used without further purification. Distilled and deionized water was used to prepare the aqueous solution of 0, 5, 10, 20, 30, 40, 60, 80 and 100 wt % for C10E3. The solutions were prepared by weight and were homogenized for at least 24 hours.
Then, the solutions were sandwiched between two plates of cover glasses for microscopy with the use of 10 µm diameter silica spheres as spacers. The samples were sealed by glue to avoid any water evaporation. Special care was taken to prevent nor dust contamination nor contact between glue and aqueous solutions. In this C10E3-water system, an isotropic sponge phase
6 (1) (L3) phase exists at high temperature whereas a lamellar (Lα) phase is displayed at low
temperature and for high concentration of surfactant an inverse micellar phase characterizes the mixture, as shown in Figure 1. The interlamellar spacings of the dilute lamellar phase can reach several hundred nanometers and can be described, assuming conservation of volume and a constant bilayer thickness, ζ, by eq (1):
where d is the repeat distance, φ the volume fraction of surfactant in solution and the C10E3
bilayer thickness ζ is assumed to be close to 27.6 Å [12, 32].
C10E3 (wt%)
0
10
20
30
40
50
60
70
80
T(°C)
25
30
35
40
45
50
55
60
65
Lα L3 L27
L3 and reverse micellar L2 phases. The phase domains are identified with phase contrast microscopy. The two
inserts represent schematic drawing of the organization of the membranes in the lamellar and sponge phases.
The Raman Spectra in the 2600-4000 cm-1 region were recorded in the backscattering geometry with a Horiba Jobin-Yvon T64000 micro Raman spectrometer equipped with a symphony CCD detector. A Neodynium Vanadate laser (Verdi Coherent) operating at 514.5 nm with an output power of 100 mW was used as an excitation light source. The spectral resolution was 2 cm-1 whereas the spatial resolution, determined on silicon wafer, was better than 2 µm. The temperature range measured for the lamellar to sponge phase transition for the 20 wt % for C10E3 solution was controlled by a Linkam system. The Raman spectra of various
concentration wt % of C10E3 solutions were recorded at room temperature (i.e. 25°C). This
implies measurements in three phases, sponge, lamellar and reverse micellar solution phase.
2.2. Raman scattering experimental setup for light depolarization
The measured spectra in the lamellar phase cannot be directly comparable to the optically isotropic sponge or micellar phases. In the lamellar phase which shows some anisotropic properties, the light experiences partial or full depolarization. A method has been suggested and successfully applied to prevent this experimental problem of light depolarization [22, 29].
The lamellar phase consists to numerous randomly oriented microscopic domains of lyotropic liquid crystals. At each interface between two neighboring monodomains, a light beam is split into ordinary and extraordinary beams with orthogonal polarization orientations. When the number of the domains, which the beam is intersecting, is large enough, the exciting laser beam is completely depolarized and the scattered Raman spectrum is that of randomly oriented molecules illuminated with naturally polarized light. If I|| and I⊥ are the
intensities of the scattered light components with polarization parallel and perpendicular to that of the exciting light, respectively, then, in the experimental situation described, the
8 (2) intensities of the Raman signal components with polarizations parallel and perpendicular to the direction of propagation of the exciting light are proportional to I|| + I⊥ and 2I⊥,
respectively. As the total Raman signal polarization is scrambled on the way out, the intensities of the observed spectra are proportional to I|| + 3I⊥. The rational idea of the
suggested method is that Raman spectra with the same type of a linear combination of I|| and
I⊥ as that for the liquid crystalline phases, namely, I|| + 3I⊥, are measured for the isotropic
micellar and sponge phases. Thus, it is possible without the influence of depolarization effects to compare the Raman spectra of the isotropic solution phase and the anisotropic liquid crystalline phase and accordingly to compare changes in the spectral shape of the bands to be attributed to changes in the molecular structure. Obviously, such a combination of I|| and I⊥ is
obtained if Raman scattered light is recorded from the isotropic phase with polarization rotated to 60° with respect to the polarization of the exciting light:
I60 = [cos²(60°)]I|| + [sin²(60°)]I⊥ = (0.25)I|| + (0.75)I⊥
In order to diminish the error due to the uncertainty in tuning the angle of the polarization rotator at 60°, parallel and perpendicular Raman spectra were measured and their linear combinations were calculated according to eq 2. Moreover, the derivative of the intensity at such angles (0 and 90°) of a polarized light with respect to the polarization rotation angle is zero. An important condition of producing correct results with this experimental setup is that both the exciting light and the Raman scattered light have to experience full depolarization in the liquid crystalline phase. This means that the excitation and Raman photons must cross a sufficiently large number of monodomain borders, or in other words, the size of the domains should be much smaller than the distance at which each photon travels through the sample.
9
Raman shift (cm
-1)
2600
2800
3000
3200
3400
3600
3800
4000
Ram
an
Inten
sity (
a. u.)
0
2
4
6
8
10
12
14
16
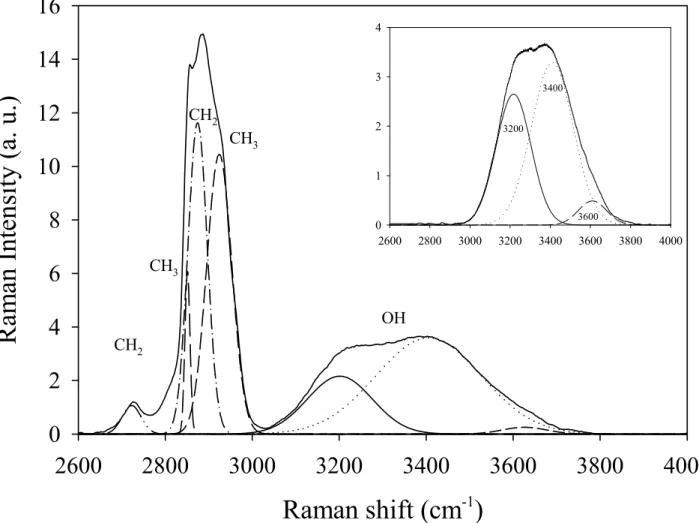
CH2 CH2 CH3 CH3 OH 2600 2800 3000 3200 3400 3600 3800 4000 0 1 2 3 4 3200 3400 3600Figure 2: Raman spectra of the C10E3-water system for a concentration of 20 wt % of surfactant. The bands at
about 2900 cm-1 are assigned to the C-H stretching of the aliphatic tails of the surfactant whereas the broad band
at higher frequency represents the O-H stretching of both water and surfactant molecules. The insert shows the Gaussian decomposition of the vibration Raman spectra of the O-H stretching mode. The correlation coefficient
for all fit r²=0.99.
2.3. Processing of the spectra
The Figure 2 represents the Raman spectra of C10E3-water system in the experimental
frequency range from 2600 to 4000 cm-1. In order to discriminate the O-H stretching band from the C-H stretching band relating to surfactant molecules, we used the fitting procedure of the LabSpec software (Horiba, Jobin-Yvon). The C-H stretching band was decomposed
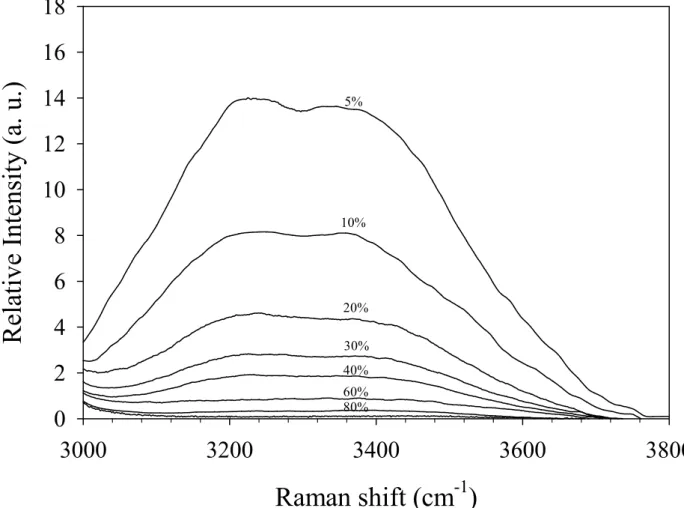
10 into four Gaussian components, while the O-H stretching was fitted with three main Gaussian components at about 3200, 3400 and 3600 cm-1, as it is shown in the insert of Figure 2. The calculated I60 spectra were rescaled so that they correspond to equal surfactant content in the
solution. The procedure has consisted to divide each spectrum by the integral of the C-H stretching band obtained by the fitting procedure. The Figure 3 shows the results of the calibrated spectra in the range of the O-H stretching.
Raman shift (cm
-1)
3000
3200
3400
3600
3800
Relativ
e I
ntensity
(
a. u.)
0
2
4
6
8
10
12
14
16
18
5% 10% 20% 30% 40% 60% 80%Figure 3: Raman spectra in the O-H stretching band region for the C10E3-water system. The spectra are
11
H2O/C10E3 mole ratio
0
50
100
150
200
250
300
350
Relative inte
gr
ated intensity
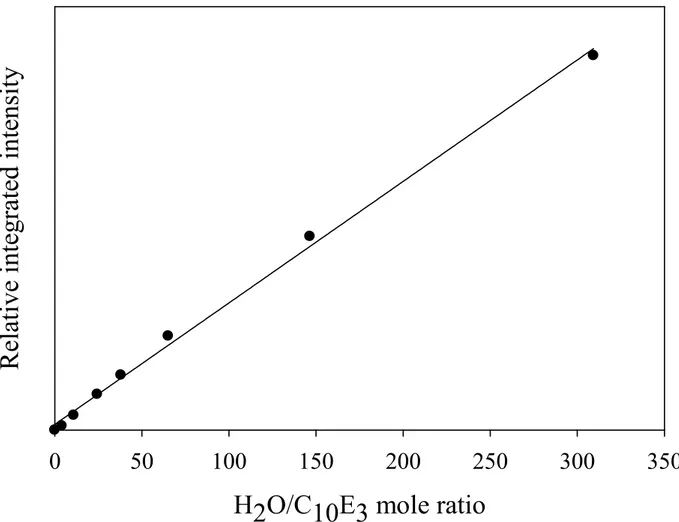
Figure 4: Relative integrated intensity of the O-H stretching band for the C10E3-water system after the subtraction
of the contribution of the O-H stretching band of the surfactant, given as a function of the mole ratio of water to surfactant. The solid line shows the best linear fit passes through the origin.
Thus, the spectra were corrected from the contribution of the O-H stretching of the surfactant which can be achieved from the spectrum of the neat C10E3. We realized another
fitting procedure on the subtracted corrected spectra for both concentrations on the O-H stretching range. The integrated intensity of the O-H stretching band as a function of the mole ratio of water to surfactant is shown in the Figure 4. The excellent linearity supports the appropriateness and accuracy of the calibration procedure adopted in this study.
12
3. Results and Discussion
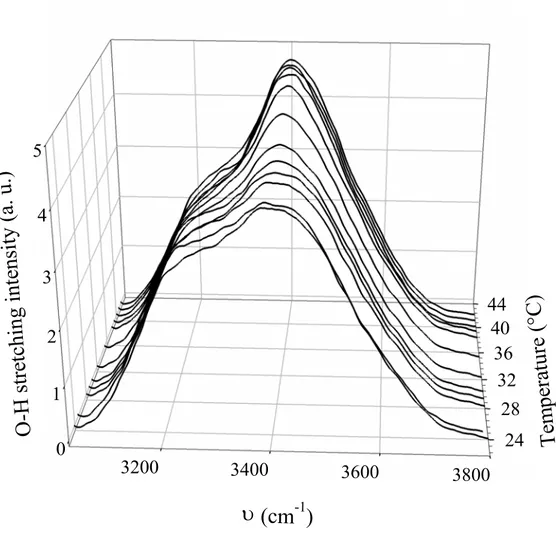
The Raman spectra of the C10E3-water in the O-H stretching range from 24 to 43°C for the
concentration of 20 wt % are shown on the Figure 5, and the parameter ROH, obtained from
the spectra, is presented in the Figure 6 as a function of the temperature when the system transits from lamellar to sponge phase. The Raman spectra in the Figure 5 are normalized to equal area after the correction by surfactant contribution. For each spectrum, the parameter
ROH was calculated as the area ratio of the component at about 3200 cm-1 to the component at
about 3400 cm-1 (ROH = A3200/A3400) using the curve fitting procedure.
0 1 2 3 4 5 24 28 32 36 40 44 3200 3400 3600 3800
O
-H
s
tr
et
ch
in
g
in
te
ns
it
y
(a
. u
.)
T
em
pe
ra
tu
re
(
°C
)
υ (cm
-1)
Figure 5: Temperature evolution of the Raman spectra of aqueous C10E3 solution at a concentration of 20 wt %
13
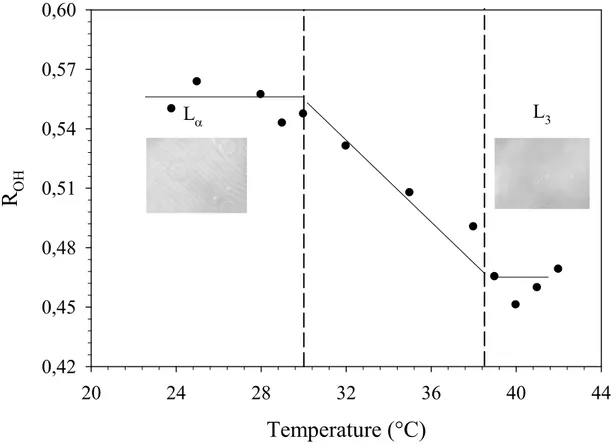
Temperature (°C)
20 24 28 32 36 40 44R
OH 0,42 0,45 0,48 0,51 0,54 0,57 0,60 Lα L3Figure 6: ROH parameter as a function of the temperature for the 20 % wt C10E3-water system. The dashed lines
represent the approximate borders of the phases and the phase transitions temperatures (Lα, lamellar phase; L3,
sponge phase) as estimated by the observation with phase contrast microscopy.
In this temperature range from 24 to 43°C, the 20 wt % C10E3-water system transits from
lamellar to sponge phase. The two phases coexist on about 8°C as it can be represented in either Figure 1 or 6. The Raman spectra evolution in the Figure 5 displays some interesting features. By increasing temperature, one can note the decrease in intensity of the 3200 cm-1 component whereas the component at about 3400 cm-1 becomes preponderant in the O-H stretching band. One can remark also the increase in the intensity of the component at about 3600 cm-1, which underlines the rupture of the H-bonds. The temperature evolution of the spectra for the C10E3-water system indicates that the intermolecular vibrational coupling at
14 The parameter ROH corresponds to the measure of collectiveness vibrations within the
fraction of water molecules that take part in the tetrahedral structure. The Figure 6 shows the temperature evolution of ROH for the lamellar to sponge phase transition of the 20 wt % C10E3
-water system. The parameter ROH obtained from the spectra of pure water (not presented) in
the same experimental conditions does not present any fluctuations and remains at a constant value of 0.7 in the studied temperature range. Previous studies on the bulk water from amorphous ice to super critical water via ambient water highlighted the strong change of water structure with a variation of the ROH ratio from 2 at -180°C to about 0 at 400°C [25].
However, on the ambient temperature range between 20 and 50°C, the fraction of the regular tetrahedral H-bonding water molecules display a ROH parameter close to 0.7 which is coherent
to our experimental spectra evolution and reflects the good agreement of the fitting procedure. The parameter ROH exhibits a different behavior when the system is in the lamellar phase.
The removing of water in the system or the introduction of surfactant at a weight of 20% leads to a decrease in the relative part of the tetrahedrally H-bonding water molecules. In the lamellar phase, the 20 wt % C10E3-water system exhibits a ROH parameter close to 0.55 and
remains at this same value of in the phase domain temperature. The changes in the O-H stretching spectra in the lamellar phase, comparatively to spectra in the bulk water at same temperature, are due to a reduction of bulk water relative to the volume of the water that is in some degree involved in interaction with the surfactant molecules and also a change of the structure of water. Interestingly, the introduction of a C10E3 membrane in water affects the
fraction of the regular tetrahedrally H-bonding water molecules at about 20% comparatively to bulk water, which indicates the existence of a correlation between surfactant concentration and ROH parameter. Then, as the temperature reaches the sponge-lamellar coexistence region,
an abrupt change in the behavior of the ROH parameter is observed, which decreases linearly
15 structure of water. Thus, in the sponge phase, ROH remains at a plateau value of 0.46 which
underlines that water structure does not evolve.
Previous studies in the structure and properties of water confined at a mesoscopic scale between supramolecular aggregates and in small cavities have highlighted the same behavior [38]. In these studies, the decrease of the intensity of the lower frequency component of the O-H stretching band, resulting to the reduced long range intermolecular vibrational coupling, is interpreted to an effect of finite size on the water domains than to the nature of the surface interstices where the water is confined. Generally, the confinement of water or alcohol between hydrophilic surfaces leads to a distortion of the H-bond network, which can be expressed by a decrease in the value of the parameter ROH [39-41]. The O-H stretching Raman
spectra of interstitial water in multilamellar lipid liposomes showed a significant deviation from the spectrum of bulk water when the distance between the surfaces was several nanometers. Again, the component at about 3200 cm-1 decreased in intensity compared to the component at about 3400 cm-1 [26].
At such mesoscopic scale, numerous studies have shown that the structure and the physical properties of confined liquids in cavities differ strikingly from the bulk system [5-18]. The experiments on the confinement of water or associated liquid such as alcohol in mesoporous materials (aerogels, controlled pore glass, MCM-41...) showed confined liquid presents a density, structure and dynamics different from bulk system. Physical properties such as structure factor or density are also perturbed due to the interaction with the surface which is of first importance in this latter case and also to a finite size effect. In the recent Monte Carlo simulation study of methanol, which is the simplest alcohol system available to create some H-bonds, confined into a silica mesopore, the results obtained have shown that the pore surface significantly affects the spatial arrangement of molecules, leading to the creation of layers which propagate to the entire pore volume [16, 17]. The interesting result concerns the
16 interfacial layer molecules which creates more H-bonds with the silanols groups of the surface than between them, leading to a strong disruption of the H-bond network.
The changes in the water structure observed for the present C10E3-water system in the
lamellar phase are in good agreement with the changes of the structure of nanoconfined water observed by other researchers [1, 21, 22]. In the lamellar phase, the repeat distance d of a bilayer can be calculated for one dimensional swelling system by the eq1. This relation is not exactly valuable because it does not take in account the thermal undulations of the bilayer and also the interbilayer interactions but gives a suitable idea of the repeat distance of the bilayer against dilution with a good accuracy. For a concentration of 20 wt % C10E3 in water, the
repeat distance d is equal to 138 Å and implicates that water domains are confined between two flat surfaces in a slit thickness close to 110Å [12, 32]. The finite size effect confinement and the presence of a surfactant membrane surface contribute to the disruption of the long-range ordering of the water molecules and lead to the decrease of the ROH parameter. Previous
studies on confinement of water in surfactant micelles showed a strong change in water structure for core micelle size below 10 nm which is in good agreement with our observations even if the system geometry differs [21].
The structure of the sponge phase is described in terms of a 3-d isotropic continuous bilayer structure as it represented on the insert of the Figure 1 [33-37]. The previous electric conductivity experience on the sponge phase concluded to the structure of a bicontinuous bilayer cubic phase [37]. The repeat distance for this bilayer is 1.4 wider than this-one of the lamellar phase for the same concentration which means that, in this study, the water domains are confined into a space of about 168 Å if we assume that the thickness of the bilayer remains the same in both membrane phases [32]. However, the elastic curvature, characteristic of the lyotropic membrane phases, differs in the sponge phase. Besides, the shape of the bilayer organization shows a 3D arrangement which drives to an increase of
17 water amount in interaction with the polar headgroup of the surfactant [33, 36, 37]. Moreover, the high disordered structure in the sponge phase shows defects in the bilayer organization which could favor interaction between confined water with hydrocarbon chains of surfactant and as result disrupt the water structure.
The continuous decreasing of the fraction of the regular tetrahedrally H-bonding water molecules undergoes the transition from the lamellar to the sponge phase. In these two phases, water interacts with the hydrophilic part of the C10E3 surfactant membrane. The fast
decreasing of the ROH parameter is due to an increase of water molecules interacting with the
polar headgroup of the nonionic surfactant. These results obtained here can be related to the hydration force which results to the ordering from the water molecules between the membranes and its organization [23, 24]. This force due to the structure of water with surface changes between the lamellar and sponge phases due to an increase of water molecules interacting with the headgroup of surfactant leading to a strong disruption of the water structure. Finally, these results highlight the importance of the first adsorbed layers of water molecules on surface in the water structure. Indeed, the water structure depends mainly on this particular layer and its morphology [42-44]. In the case of the lamellar phase, the planar geometry of the surface leads to a 1D slit confinement and affects only the first layer also called solvation layer, as it has been observed for adsorbed water on various substrate whereas in the sponge phase, the solvation layer thickness should highly increase and perturbs in the same order of magnitude the water structure between the 3D organization of the surfactant bilayer. Even if the size of confinement is wider in the sponge phase, the geometry of the highly disordered structure of the membranes reduces the size of the tetrahedrally H-bonding water clusters and consequently disorganizes the water structure at long range ordering, characteristic of the bulk water.
18
4. Conclusion
Water confined in solid pores and cavities of mesoscopic dimensions in surfactant structures exhibit highly unusual properties [1-3]. The understanding of the dynamics and the water structure is important to biophysical problems such as functions of membranes and food conservation [1]. However the use of biological systems is rather complex and surfactant structures provide interesting well-controlled aggregates for the understanding of confined water [1]. Effects of confinement have been observed on water structure network confined in micelle structures and lamellar phase by Raman scattering and infra-red spectroscopy investigations [21, 22]. However, the investigation of H-bond water structure in the sponge phase of which structure corresponds to a 3D isotropic bilayer organization has not been characterized so far. Moreover, the study on the changes in water structure for the lamellar (Lα) to sponge (L3) phase transition has also not be undertaken which is of great importance
since the water network ordering has been recognized to contribute to the hydration force acting between membranes [23, 24].
In this work, we have explored using Raman scattering the behavior of the water structure in aqueous solution of tri-ethylene glycol mono n-decyl ether (C10E3) for various
concentrations in the lamellar and sponge phases. Using a three-Gaussian decomposition of the OH stretching band data, it is clear that the confinement in the lamellar phase disturbs essentially the two lower and slightly the higher energy components, as it has been previously identified. The reorganization of the membrane in one dimensional structure, in the lamellar phase to a three dimensional structure in the sponge phase affects both components, which indicates that the water molecules involved in different supermolecular bonding schemes differ from each other through their respective mean degrees of connectivity. In the sponge phase, even for a wider confinement size, the regular tetrahedral water structure is disrupted quite strongly comparatively to this-one of the lamellar phase. This observation indicates
19 water molecules interacting with the polar head groups of the nonionic surfactant increase considerably when the system self organizes from a 1D to a 3D confinement and reveals the importance of the first layers of adsorbed water molecules in the water structure. The behavior of the water structure can be used as a probe to describe perfectly the lamellar to sponge phase transition and its consequence for the formation of the liquid crystalline phases.
20
References
[1] N. Nandi, K. Bhattachayya, B. Bagchi, Chem. Rev. 100 (2000), 2013. [2] U. Raviv, P. Laurat, J. Klein, Nature 413 (2001), 51.
[3] U. Raviv, J. Klein, Science 297 (2002), 1540.
[4] F. Gillot, F.O. Morin, H.F. Arata, R. Guegan, H. Tanaka, H. Fujita, Lab Chip 7 (2007), 1600.
[5] R. Lopez-Esparza, M.A. Guedeau-Boudeville, E. Larios-Rodriguez, A. Maldonado, R. Ober, W. Urbach, J. Colloid Interface Sci. 331 (2009), 577.
[6] J.J. Valle-Delgado, J.A. Molina-Bolivar, F. Galisteo-Gonzalez, M.J. Galvez-Ruiz, A. Feiler, M.W. Rutland, J. Chem. Phys. 123 (2005), 034708-1.
[7] E. Tombari, G. Salvetti, C. Ferrari, G.P. Johari, J. Chem. Phys. 122 (2005), 104712-1. [8] V.V. Turov, V.M. Gun'ko, V.M. Bogatyrev, V.I. Zarko, S.P. Gorbik, E.M. Pakhlov, R. Leboda, O.V. Shulga, A.A. Chuiko, J. Colloid Interface Sci. 283 (2005), 329.
[9] A.I. Kolesnikov, J.-M. Zanotti, C.-K. Loong, P. Thiyagarajan, A.P. Moravsky, R.O. Loutfy, C.J. Burnham, Phys. Rev. Lett. 93 (3) (2004), 035503-1.
[10] N. Floquet, J.P. Coulomb, N. Dufau, G. Andre, J. Phys. Chem. B 108 (2004), 13,107. [11] V. Crupi, D. Majolino, P. Migliardo, V. Venuti, M.-C. Bellissent-Funel, Mol. Phys. 101 (22) (2003), 3323.
[12] R. Guégan, Langmuir 26 (2010), 24-19175.
21 [14] R. Guégan, D. Morineau, R. Lefort, W. Béziel, M. Guendouz, L. Noirez, A. Henschel, P. Huber, Eur. Phys. J. E 26 (2008), 261.
[15] R. Guégan, D. Morineau, C. Loverdo, W. Béziel, M. Guendouz, Phys. Rev. E 73 (2006), 011707.
[16] R. Guégan, D. Morineau, C. Alba-Simionesco Chem. Phys. 317 (2005), 236.
[17] D. Morineau, R. Guégan, Y. Xia, C. Alba-Simionesco, J. Chem. Phys. 121 (2004), 1466. [18] C. Alba-Simionesco, B. Coasne, G. Dosseh, G. Dudziak, K. E. Gubbins, R. Radhakrishnan, M. Sliwinska-Bartkowiak, J. Phys.: Condens. Matter. 18 (2006), R15.
[19] W.M. Gelbart, A. Ben-Shaul, D. Roux (Eds.), Micelles, Membranes, Microemulsions and Monolayers, Springer-Verlag, 1994.
[20] S. Mackeben, M. Müller, C.C. Müller-Goymann, Colloid Surf. A 183-185 (2001), 699. [21] J.-B. Brubach, A. Mermet, A. Filabozzi, A. Gerschel, D. Lairez, M.P. Krafft, P. Roy, J. Phys. Chem. B 105 (2001), 430.
[22] V.S. Marinov, Z.S. Nickolov, H. Matsuura, J. Phys. Chem. B 105 (2001), 9953. [23] S.-J. Marrink, M. Berkowitz, H. J. C. Berendsen, Langmuir 9 (1993), 3122. [24] L. Perera, U. Essmann, M. L. Berkowitz, Langmuir 12 (1996), 2625. [25] G. E. Walrafen, Y. C. Chu, J. Phys. Chem. 99 (1995), 11225.
[26] R. McGraw, W.G. Madden, M.S. Bergen, S.A. Rice, M.G. Sceats, J. Chem. Phys. 69 (1978), 3483.
22 [27] M.S. Bergen, S.A. Rice, J. Chem. Phys. 77 (1982), 583.
[28] B. Ratajska-Gadomska, W. Gadomski, J. Chem. Phys. 121 (2004), 12583. [29] N. Abe, M. Ito, J. Raman Spectrosc. 7 (1978), 161.
[30] D. M. Carey, G. M. Korenowski, J. Chem. Phys. 108 (1998), 2669. [31] A. A. Ali, B. A. Mulley, J. Pharm. Pharmacol. 30 (1978), 205.
[32] T.D. Le, U. Olsson, K. Mortensen, J. Zipfel, W. Richtering, Langmuir 17 (2001), 999. [33] G. Porte, J. Apell, P. Bassereau, J. Marignan, J. Phys. (France) 50 (1989), 1335.
[34] A. Maldonado, R. Ober, T. Gulik-Krzywicki, W. Urbach, D. Langevin, J. Colloid Interface Sci. 308 (2007), 485.
[35] J. Bender, P. Jarvoll, M. Nydén, S. Engström, J. Colloid Interface Sci. 317 (2008), 577. [36] D. Roux, C. Coulon, M. E. Cates, J. Phys. Chem. 96 (1992), 4174.
[37] E. Freyssingeas, F. Nallet, D. Roux, Langmuir 12 (1996), 6028.
[38] M. Lafleur, M. Pigeon, M. Pézolet, J. Caillé, J. Phys. Chem. 93 (1989), 1522. [39] J. Puibasset, R. Pellenq, J. Chem. Phys. 119 (2003), 9226.
[40] C. Hartnig, W. Witschel, E. Sphor, P. Gallo, M.A. Ricci, M. Rovere, J. Mol. Liq. 85 (2000), 127.
[41] N. Casillas, J. E. Puig, R. Olayo, T.J. Hart, E.I. Franses, Langmuir 5 (1989), 384. [42] P. Fenter, N. C. Sturchio, Prog. Surf. Sci. 77 (2004), 171.
23 [44] H.A. Al-Abadleh, V.H. Grassian, Langmuir 19 (2003), 341.