HAL Id: hal-01416517
https://hal.sorbonne-universite.fr/hal-01416517
Submitted on 14 Dec 2016
HAL is a multi-disciplinary open access
archive for the deposit and dissemination of
sci-entific research documents, whether they are
pub-lished or not. The documents may come from
teaching and research institutions in France or
abroad, or from public or private research centers.
L’archive ouverte pluridisciplinaire HAL, est
destinée au dépôt et à la diffusion de documents
scientifiques de niveau recherche, publiés ou non,
émanant des établissements d’enseignement et de
recherche français ou étrangers, des laboratoires
publics ou privés.
Detyniecki, David Cohen, Mohamed Chetouani
To cite this version:
Jonathan Aigrain, Michel Spodenkiewicz, Severine Dubuisson, Marcin Detyniecki, David Cohen,
et al..
Multimodal stress detection from multiple assessments.
IEEE Transactions on
Affec-tive Computing, Institute of Electrical and Electronics Engineers, 2016, PP (99), pp.1 - 1.
�10.1109/TAFFC.2016.2631594�. �hal-01416517�
Multimodal stress detection from multiple
assessments
Jonathan Aigrain
1, Michel Spodenkiewicz
1,2,3,4, S´everine Dubuisson
1, Marcin Detyniecki
5,6,
David Cohen
1,2, and Mohamed Chetouani
11Sorbonne Universit´es, UPMC Univ Paris 06, UMR 7222, ISIR, Paris, France
2Service de Psychiatrie de l’Enfant et de l’Adolescent, APHP, GH Piti´e-Salp´etri`ere, Paris, France 3Unit´e de P´edopsychiatrie de Liaison CIC-EC 1410, CHU Sud R´eunion, Saint-Pierre, France
4Inserm U1178, Paris, France 5CNRS, UMR 7606, LIP6, Paris, France 6Polish Academy of Sciences, IBS, Warsaw, Poland
Abstract—Stress is a complex phenomenon that impacts the body and the mind at several levels. It has been studied for more than a
century from different perspectives, which result in different definitions and different ways to assess the presence of stress. This paper introduces a methodology for analyzing multimodal stress detection results by taking into account the variety of stress assessments. As a first step, we have collected video, depth and physiological data from 25 subjects in a stressful situation: a socially evaluated mental arithmetic test. As a second step, we have acquired 3 different assessments of stress: self-assessment, assessments from external observers and assessment from a physiology expert. Finally, we extract 101 behavioural and physiological features and evaluate their predictive power for the 3 collected assessments using a classification task. Using multimodal features, we obtain average F1 scores up to 0.85. By investigating the composition of the best selected feature subsets and the individual feature classification performances, we show that several features provide valuable information for the classification of the 3 assessments: features related to body movement, blood volume pulse and heart rate. From a methodological point of view, we argue that a multiple assessment approach provide more robust results.
Index Terms—Stress, assessment, behaviour, physiology, multimodal, classification.
F
1 I
NTRODUCTIONR
ECENT progress in computer vision and social signalprocessing have helped to understand the impact of af-fective and mental states on human behaviour and body. For instance, frameworks for automated analysis and detection of stress [1], [2] provide valuable information about the pre-dictive performance of certain features in stressful contexts. However, these results greatly depend on the way stress is assessed. Lutchyn et al. suggest that, regarding automatic stress detection, “inconsistent results reported in some areas of research can be partially explained by the choice of measurements that capture different manifestations of affective phenomena, or fo-cus on different elements of affective processes” [3]. In this paper, we propose a multi-assessment methodogy to analyze stress detection results.
1.1 Background
1.1.1 Stress definition and measure
Although researchers have studied the topic for more than a century, the stress definition is still debated [13] and can be studied from different perspectives. In this work, we focus on 3 perspectives: the biological perspective, the phe-nomenological perspective and the behavioural perspective. The biological perspective aims at understanding how the body responds to a stressful stimulus. It was pioneered by Hans Selye [14], who defined stress as the non-specific neu-roendocrine response of the body to a demand placed on it, Manuscript received April 19, 2005; revised August 26, 2015.
such as extreme temperatures [14], [15]. The body responds to a stressful stimulus by the activation of the hypothalamo-pituitary-adrenal (HPA) pathway and the autonomic ner-vous system (ANS) that mediates the general adaptation syndrome [16]. After the stimulus, a neuroendocrine chain reaction begins in the brain. Recent neuroimaging studies support evidence of the major implication of some cerebral structures with a multiroad processing system of stress [17], [18]. At a peripheral level, adrenal glands respond by the release of epinephrin and cortisol into the bloodstream with an effect on cardiovascular, musculoskeletal, gastrointesti-nal, nervous and endocrine systems. This physiological cas-cade can be measured through salivary or blood sampling with biomarkers such as cortisol. It can also be measured with wearable sensors [19] via valuable signals, such as skin conductance [20] or heart-rate variability (HRV) mea-sures [21], [22]. Using filtering techniques, the sympathova-gal balance can be directly calculated as the ratio of low and high frequencies of HRV [23]. Previous experimental studies suggest that the stress response is linked to a modulation in spectral density of the low frequency band of HRV (HRV-LF) [24].
The phenomenological perspective considers that self-perception is the key aspect. This vision has been supported within the Cannon-Bard theory: the authors state that stress can occur even when the body changes are not present because the physiologic response of the body is more slowly recognized by the brain compared to its function to release
Study Stimulus Signals Stress annotation
Barreto et al. [4] Stroop test BVP, GSR, skin temperature and pupil
diameter Task complexity
Chen et al. [5] Trier Social Stress Test Tissue oxygen saturation Assessement from cortisol Fernandez et al. [6] Mental arithmetic task while
driv-ing Speech Experimental conditions
Gaggioli et al. [7] Naturalistic settings ECG and 3D acceleration Self-assessment Giakoumis et al. [1] Stroop test GSR, ECG, body movement, head
posi-tion, posture and occurence of specific gestures
Assessment from GSR + self-assessment
Healey et al. [8] Driving in several conditions ECG, EMG, GSR and respiration Assessment from external observers
Lefter et al. [2] None Speech, movement and gestures valence
and arousal Acted
Plarre et al. [9] Public speaking task + mental
arith-metic task + cold pressor ECG, respiration and 3D acceleration Experimental conditions +self-assessment Shi et al. [10] Public speaking task + Mental
arith-metic task + cold pressor HR, ECG, respiration, GSR, temperature Self-assessment Wijsman et al. [11] Mental arithmetic + logical puzzle +
memory tasks HR, ECG, EMG and respiration Self-assessment
Zhou et al. [12] Riding a roller-coaster Speech Experimental conditions + acted
Our approach Mental arithmetic task HR, GSR, EMG, respiration, skin tem-perature, body movement, posture, oc-curence of specific gestures and actions units
Self-assessment + assess-ment from external ob-servers + assessment from HRV
TABLE 1: Stimuli, signals and stress annotations for some automatic stress detection systems. an emotional response [25], [26]. A major contribution to the
field of research on stress was described within Lazarus’ the-ory of cognitive appraisal: stress is a two-way process which includes both the stressor and the individual assessment of ressources required to minimize, tolerate or eradicate the stressor and the stress it produces. Experimental studies confirmed recently that stress experience is moderated by the ability of a human subject to feel his body signals such as the heartbeat [27]. Lazarus states that “Stress occurs when an individual perceives that the demands of an external situations are beyond his or her ability to cope with them” [28], [29]. Since this definition focuses mainly on individual perception, stress can be measured by questionnaires [30], [31], [32], Likert and visual analogue scales [33].
Finally, the behavioural perspective investigates the impact of stress on human and animal behaviour both at individual and group levels [34], [35]. Both transfer of ethological re-search to human behaviour and social signal processing lead researchers to a promising approach of behavioral measure of stress in non human primates [34] and more recently in human subjects [35], [36]. Engaging in displacement behav-iors such as scratching, face touching and lip biting have been associated with stressfull experiences and may give more valuable information about the subjects emotional state than verbal statements and verbal expressions [34]. Authors suggest that these behaviors could impair cogni-tive performance by cutting-off attention temporarily from stressful or threatening stimuli. This short term diversion of attention could reduce the ability to deal with a mentally challenging or stressful task [37], [38]. In this perspective, behavior characteristics do not infer internal subjective feel-ings but are used as external marker for behavior adaptation (as in the ethological principle). Therefore, stress can be
assessed on the basis of ones behavior modifications when a subject is exposed to a stressor.
1.1.2 Automatic stress detection
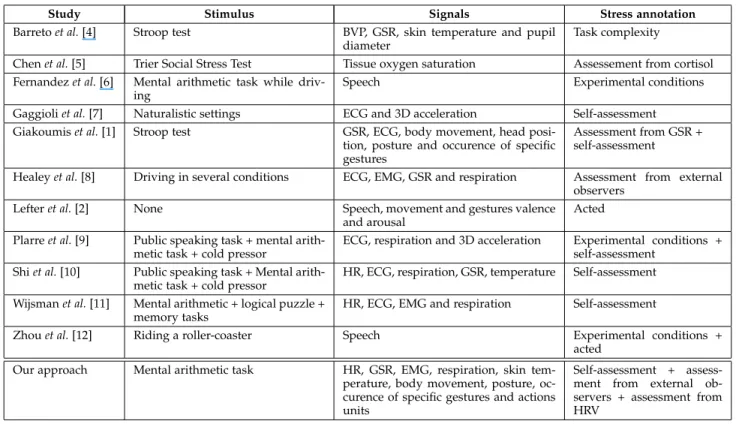
During the last decade, several authors studied the feasibil-ity of automatic stress detection. Table 1 presents the stimuli, the signals from which features are extracted and the stress annotations considered in several works. Most stimuli used are based on cognitive tasks (Stroop test, mental arithmetic task, logical puzzle task, etc.). Dickerson and Kemeny state that this type of stimulus is the most efficient for stress induction when combined with social-evaluative threat [39]. Two works focus on automatic stress detection during driv-ing tasks [6], [8] and three other works also study the impact of physical stimulus such as cold pressor [9], [10] and riding a roller-coaster [12]. Regarding the signals collected, 2 categories are usually employed:
• physiological signals: Blood Volume Pressure (BVP),
Electrocardiography (ECG), Electromyogram (EMG), Galvanic Skin Response (GSR), Heart Rate (HR), Heart Rate Variability (HRV), etc.
• behavioural signals: speech, body movement, head
position, etc.
Regarding stress annotations, there is a wide variety of methods: self-assessment, assessment from biomarkers (cor-tisol, GSR, etc.), assessment from external observers, in-ference from experimental conditions and inin-ference from acting instructions. Most of the works presented use only one of these methods.
1.2 Objective of study
In this work, we propose to study the stress phenomenon in a more comprehensive way by considering the results
SA (Body movement, AU, …)distal cues proximal
cues EOA
Mental State
Externalization Perception Attribution
Observer internal cues (HR, GSR, BVP, …) Expert PEA HRV-LF%
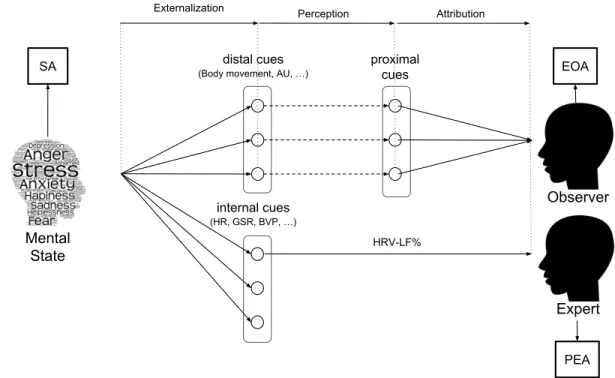
Fig. 1: Data is annotated in 3 different ways. First, following the phenomenological perspective, we ask the subject to provide her Self-Assessment (SA). Then, following the behavioural perspective, we ask external observers (recruited using a crowdsourcing platform) assessments (EOA). Finally, following the biological perspective, a physiology expert assesses the presence of stress from the percentage of low frequencies in the heart rate variability (PEA).
obtained from different annotations. We introduce original behavioural features expected to be relevant for automatic stress detection. We evaluate the predictive power of 101 behavioural and physiological features for each annotation. Overall, we argue that stress detection should be tackled with a multiple assessment approach because of the com-plexity of stress.
Figure 1 is an extension of Brunswik Lens [40] and summa-rizes how we address the issue of the annotation choice. The Brunswik Lens is used in the affective computing literature to illustrate the difference between self-assessment and ex-ternal assessment for phenomena such as personality [41] and stress [2]. We extend it by adding the assessment provided by a physiology expert. Thus, we annotate stress in 3 different ways:
• Following the behavioural perspective, we gather
external observer assessments (EOA) using a crowd-sourcing platform.
• Following the phenomenological perspective, we ask
the subject to provide her self-assessment (SA).
• Following the biological perspective, a physiology
expert assesses the presence of stress from the per-centage of low frequencies in the heart rate variabil-ity (PEA).
Using these 3 annotations, we evaluate the predictive power of behavioural (or distal) and physiological (or internal) cues.
This paper is organized as follows: Section 2 presents the experiment we used for data collection. Section 3 describes the 3 collected assessments. Section 4 introduces our frame-work for automatic stress detection: the extracted features, the preprocessing transformations and the feature subset selection methods. Section 5 presents the different results obtained. Section 6 discusses the results and the limitations and strengths of this study. Section 7 concludes and gives some perspectives for future works.
2 A
CQUIREDD
ATASETIn this section, we present the experiment we designed to obtain behavioural and physiological data in a stressful situation. Designing this new protocol was necessary to collect the required data for a multi-perspective analysis of stress.
2.1 The experimental stressor
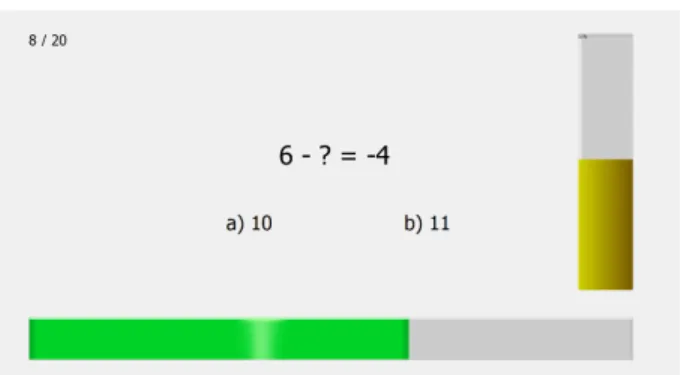
In [39], Dickerson and Kemeny state that the best way to in-crease the cortisol level of a subject is to have her experience cognitive load while being socially evaluated. Based on this work, we designed a time-constrained mental arithmetic test as the stress-induction stimulus of the experiment (Figure 2). Participants were told that the objective of the experiment is to estimate their developmental age and to correlate it with their academic and professional careers. It made them believe that they were socially evaluated while keeping
hidden the stress induction aim of the experiment. This way, stress induction occured as naturally as possible.
Fig. 2: Screenshot of the test software used for the study. The question asked is shown in the middle of the screen. The two possible answers are below the question. At the bottom, the remaining time is displayed using a progress bar. On the right, the color of the score bar provides a feedback regarding the performance of the participant: green means “above average”, yellow means “average” and red means “below average”.
In our protocol, participants are first briefed about the fake objective of the experiment and asked to sign the consent form and the release waiver accordingly to the ethical com-mittees rules. We also informed the participants that they could stop the experiment at anytime. Then, the physiologi-cal sensors are installed, and the participant starts taking the test. The test is composed of 6 steps of increasing difficulty. There is a break period of 5 seconds between 2 steps. The participant is told that both quickness and correctness of her answers are taken into account to compute her score. In reality, the values of the score bar are set in advance. It displays an “above average” score at the beginning, so that the participant finds the test easy enough and feels like she should suceed. Then, the score drops to “average” and “below average” levels, giving the participant the feeling she is actually failing. Overall, the score bar and the fake objective induce the feeling of social evaluation while the questions and the time bar induce cognitive load. This combination follows the recommandations of Dickerson and Kemeny [39]. Once the test is finished, the real objective is revealed and the experiment is debriefed.
2.2 Participants
Participants were recruited among medical students of the Universit´e Pierre et Marie Curie in Paris after written in-formed consent was given. 25 people participated in the experiment. However, because of acquisition problems for the physiological signals, the data of 4 participants was dismissed. Thus, the data of 21 participants has been used: 15 women and 6 men. Their average age is 26.3 ± 4.6 years old.
2.3 Hardware setup
Video and skeleton data were recorded using a Microsoft Kinect. Since the resolution (640 ⇥ 480 pixels) of the video recorded by the Kinect is too low for an accurate facial
expression analysis, we also recorded video data of the participant’s face using the optic zoom of a high defini-tion (1440 ⇥ 1080 pixels) camera. Physiological data were recorded with a Nexus-10 portable device (MindMedia B.V., The Netherlands) with a measurement of EMG, GSR, skin temperature, respiration, BVP and HR.
2.4 Acquired data
For each of the 21 participants and for each of the 6 steps of the mental arithmetic task, we acquired:
• the video of the whole body from the Kinect; • the skeleton from the Kinect;
• physiological measures from the Nexus-10; • the video of the face from the HD camera;
In total, we have recorded 6 ⇥ 21 = 126 steps.
3 A
SSESSMENT OF STRESSEach step was annotated in 3 differents ways (Figure 1), one for each perspective we presented in Section 1.1.1:
• External Observers Assessment (EOA) • Self-Assessment (SA)
• Physiology Expert Assessment (PEA)
In this section, we describe in detail these 3 annotations and study their correlations.
3.1 Description of External Observers Assessment (EOA)
We used the crowdsourcing platform CrowdFlower1 to
ob-tain annotations from external observers. It allows to easily obtain a large amout of annotations while providing some quality control mechanisms.
3.1.1 Crowdsourcing acquisition procedure
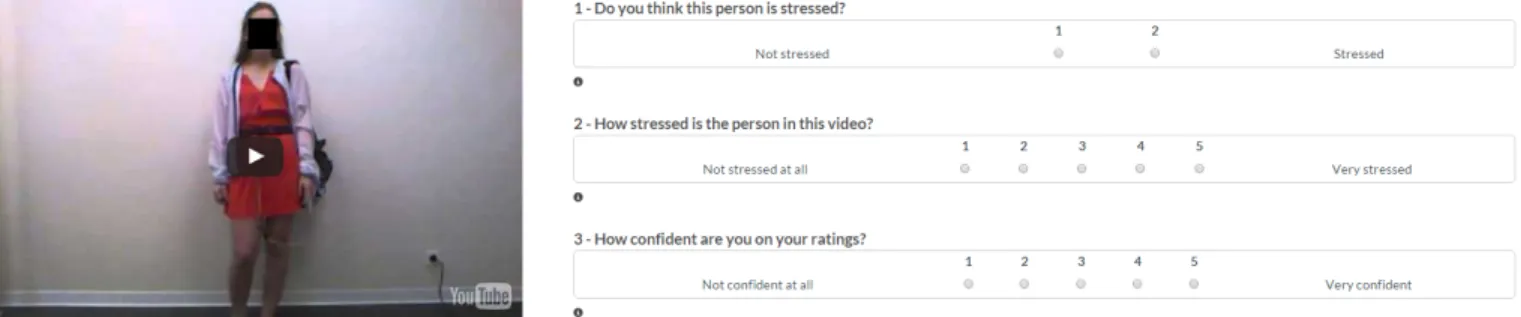
We presented the video of the body recorded by the Kinect for all 126 steps. Three questions were asked for each video (Figure 3):
• Do you think this person is stressed? Answers: not
stressed/stressed (Q1)
• How stressed is the person in this video? Answers:
Likert scale 1-5 (Q2)
• How confident are you on your ratings? Answers:
Likert scale 1-5 (Q3)
Regarding the instructions given to the annotators, we told them that they were shown videos of people taking a cogni-tive test. This was done so that they would have just enough knowledge about the context to provide accurate ratings. To obtain acceptable statistical significance, we requested 10 annotations per video.
Fig. 3: Screenshot of the CrowdFlower platform. 3.1.2 Crowdsourcing annotation quality control
We used 3 mechanisms to ensure the annotation quality. First, as CrowdFlower proposes 3 categories of contributors according to their experience and their accuracy on the platform, we have chosen the highest ranked category. Second, it is possible to set a minimum amount of time that an annotator should take to provide her answers for one video. We can then discard annotators that do not actually watch the videos until the end before answering. Since the shortest video lasts 50 seconds, we set that duration as the threshold.
Finally, CrowdFlower randomly inserts “Test Questions” among the videos. Test Questions are videos for which we provided an expected set of answers. If an annotator misses too many Test Questions, she is not allowed to provide new ratings and her previous ratings are marked as unreliable. In order to select the videos for the Test Questions, we preselected a set of videos (N = 14) that we considered prototypical. These videos were presented in an online questionnaire where people had to answer questions Q1, Q2 and Q3. We obtained 28 answers for each video. We discarded the videos that achieved an agreement rate lower than 90% for Q1, decreasing the number of Test Questions to 11.
3.1.3 Annotators
248 people annotated an average of 6.45 ± 5.22 videos. Their repartition over the continents is presented in Table 2. We can see that most of them are from western culture, as the subjects of the experiment are. This is important since stress may be expressed and perceived differently depending on one’s culture. Analysis on the impact of culture on stress expression and perception is important but is out of the scope of this paper.
Continent EU SA AS NA AF OC
Number of annotators 128 48 46 24 1 1 TABLE 2: Repartition of the annotators over the continents (EU = Europe, SA = South America, AS = Asia, NA = North America, AF = Africa, OC = Oceania).
3.1.4 Annotations aggregation
Since we have several annotations per video, we have to use an aggregation method in order to assign a single label to each video. To do so, we use the Honeypot method [42]. First, we remove untrustworthy annotators using answers to Test Questions. Then, we assign the majority decision to each video: if more than half of the remaining annotations are Stress answers, we assign the Stress label, otherwise we assign the Non-Stress label.
Label Non-Stress Stress Proportion 39.7% 60.3% TABLE 3: EOA label distribution.
3.2 Description of Self-Assessment (SA)
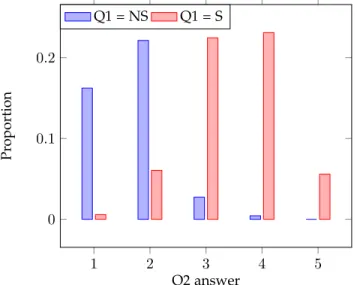
Self-assessment of stress was conducted during the debrief-ing of the experiment described in Section 2.1. The subjects answered a Likert-scaled (1-5) question about how stressed they felt during each step. To limit memory bias, they watched their own videos before providing their answers. Then, in order to obtain binary labels, we use a threshold on the stress level: Non-Stress = {1, 2} and Stress = {3, 4, 5}. This threshold has been chosen regarding the repartiton of the answers to Q2 according to the answer given for Q1. As shown in Figure 4, it appears that stress levels 1 and 2 are associated with Non-Stress, while stress levels 3, 4 and 5 are associated with Stress.
Label Non-Stress Stress Proportion 25.4% 74.6% TABLE 4: SA label distribution.
3.3 Description of Physiology Expert Assessment (PEA)
For PEA, presence of stress was assessed based on psychi-atric expertise on the physiological impact of stress. We used the percentage of low frequency in the heart-rate variability (HRV-LF%) measure provided by the Nexus-10. HRV is considered to be a reliable indicator to assess the presence
1 2 3 4 5 0 0.1 0.2 Q2 answer Pr oportion Q1 = NS Q1 = S
Fig. 4: Answers to Q2 according to the answer given for Q1. Best viewed in color.
of physiological stress [21], [22] and its percentage of low frequency is seen as a valuable marker [24], [43], [44]. It also has the advantage to be a fast physiological marker of the activation of the HPA pathway and the ANS. Thus, it gives a fast image of the impact made by the stressor, unlike cortisol which is realeased with a 5 to 20 minutes delay [45]. In order to obtain binary labels, we compare the values obtained with the average of HRV-LF% over all the steps. For each step, if the HRV-LF% observed is above the computed average, then the step is associated with the Stress label. Otherwise, it is associated with the Non-Stress label. Consequently, we obtain the distribution shown in Table 5.
Label Non-Stress Stress Proportion 52.4% 47.6% TABLE 5: PEA label distribution.
3.4 Are PEA, SA, and EOA significantly associated ?
To assess how PEA, SA, and EOA were associated, we performed two analyses. First, we calculated Cohens Kappa to assess their agreement based on binary labels. Second we used correlation analysis based on non-binary values. Ta-ble 6 shows the Cohen’s kappa scores for each combination of 2 assessment sets. The only score which is considered as fair by the guidelines given by Landis et al. in [46] is obtained by the pair SA⇥EOA. This could be explained by the fact that the experiment subjects are asked to watch their own videos before providing their self-assessment. Thus, they looked at the same distal cues as the external observers before judging whether they felt stressed or not. The low kappa scores obtained by PEA with SA and EOA may be explained by the differences in distribution: PEA is more balanced (Table 5) than SA (Table 4) and EOA (Table 3). Since the kappa scores are impacted by the choice of a specific threshold for each assessment, we also used correlation analysis on non-binary values. Table 7 presents
the correlation coefficient between the non-binary values associated with each assessment:
• EOA: the proportion of annotators that answered
“Stressed” for Q1.
• SA: the self-reported answers to the Likert-scaled
(1-5) question asked during the debriefing of the experiment.
• PEA: the HRV-LF% values.
The correlation coefficients are very similar to the kappa scores: the only significant correlation is obtained by the pair SA⇥EOA. The correlation coefficient - 0.41 - indicates a modest correlation. There is no significant correlations between PEA and EOA and between PEA and SA.
Overall, the kappa scores and the correlation coefcients are going in the same direction. The lack or limited correla-tion found supports : (1) the idea that stress is a complex phenomenon which can be expressed through ones body, behaviour and/or mind. (2) physiological parameters may differ in timing for stress induction compared to behavioral cues; (3) despite the correlation between EOA and SA, it appears that the two phenomena have both common basis and separate cues. Thus, it is important to assess stress in several ways because of the diversity of its expression.
Assessment sets SA⇥EOA SA⇥PEA EOA⇥PEA Cohen’s Kappa 0.38 -0.08 -0.07
TABLE 6: Cohen’s Kappa for each combination of 2 assess-ment sets.
Assessment sets SA⇥EOA SA⇥PEA EOA⇥PEA Correlation coefficient 0.41* -0.11 -0.06 TABLE 7: Correlation coefficients for each combination of 2 assessment sets. The only significant correlation (p < 0.05) is marked with *.
4 F
RAMEWORK FOR AUTOMATIC STRESS DETEC-TION
In this section, we describe how we use the data and anno-tations described in Sections 2 and 3 to perform automatic stress detection.
4.1 Feature extraction
In this work, we extract 101 features from 3 sources: body features from the Kinect data, facial features from the HD video and physiological features from the signals provided by the Nexus-10. Body and facial features are presented in Table A1 gathered as behavioural features. Physiological features are presented in Table A2.
4.1.1 Body features
In the literature, several sets of body features have been used to recognize or to synthesize someone’s affective state [47], [48], [49]. Regarding automatic stress detection systems, only few of them actually use body features. In [1],
Giakoumis et al. state that behavioural features such as body movement, head position and posture enhance the performances of “standard” systems based on physiological features. In this work, we extract 15 original features from body activity, posture and occurence of specific gestures. We describe them in the following paragraphs.
Quantity of Movement
The main body activity feature extracted is the Quantity of Movement (QoM). We compute it in two ways: using the RGB video (IQoM), and using the skeleton joints (SQoM) (Figure 5). IQoM is the number of pixels that changed between two successive frames and SQoM is the sum of the displacements of the skeleton joints. Each method has its advantages and drawbacks. SQoM enables us to detect slight movements in the camera axis. However, as the Kinect skeleton can be unstable during the recordings, IQoM is also used in order to extract a less noisy quantity of movement. For both IQoM and SQoM, we compute their mean value over all the Kinect video frames of the protocol step. Then, in order to make these features invariant to the size of a person and to the distance between her and the camera, we normalize them with respect to the surface of the box bounding the person. We also compute the SQoM only for the head joint (HeM) and isolate its movement along the camera-axis (HeMZ).
Fig. 5: The skeleton joints extracted by the Kinect2 Periods of high body activity
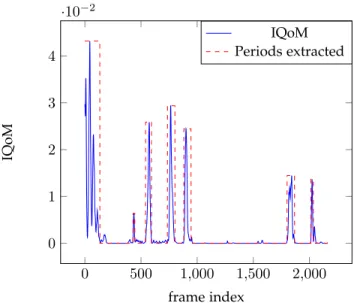
We make the hypothesis that periods of high body activity characterize an increasing uncomfortability. These periods are extracted by detecting the peaks in the IQoM signal (Figure 6). We use the number of periods extracted (HAPC), their average duration (HAPMD) and their average intensity (HAPMV) as features.
Posture changes
As for periods of high body activity, posture changes may reveal uncomfortability. We use the number of posture changes (PCC) that occur during the video as a feature. Because of the skeleton stability issues in the recordings, especially when the participant crosses her arms, we use 2. Image retrieved from https://msdn.microsoft.com/en-us/library/microsoft.kinect.jointtype.aspx 0 500 1,000 1,500 2,000 0 1 2 3 4 ·10 frame index IQoM IQoM Periods extracted
Fig. 6: Extraction of periods of high body activity from the IQoM. Blue line: IQoM values per frame. Red dashed line: periods of high activity extracted. Best viewed in color. the periods of high body activity described previously to extract the posture changes. For each period, we compare the first frame and the last frame by computing their difference (Figure 7). If the number of pixels divided by the surface of the bounding box is above a given threshold, we consider that there is a posture change. Thus, we can consider that this feature is an additional information for periods of high activity.
Fig. 7: Example of detection of a posture change. From left to right: first frame of the period, last frame and their thresholded absolute difference.
Detection of self-touching
Harrigan suggests in [50] that self-touching can be an indi-cator of negative affect. We detect two types of self-touching: face touching, which is part of the displacement behaviours described by Troisi [34], and rubbing fingers together. Since detecting self-touching requires a precise tracking of the hand, we use skin detection to refine the hand joint location provided by the Kinect. Starting from the position given by the Kinect, we look for the closest skin pixel detected. This becomes the new position of the hand.
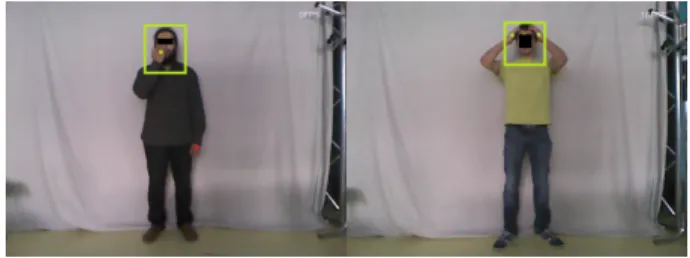
To determine if a person is touching her face, we com-pute the hand-head and the hand-neck distances. If one of these distances is below a given threshold, we consider that the person is face touching (Figure 8). The number of occurences (FTC) and the average duration (FTMD) are
used as features. Similar features are extracted when the person is self-touching her head with two hands (FT2HC and FT2HMD).
Fig. 8: Examples of detections of face touching. Left image: face touching with one hand. Right image: face touching with two hands.
To detect gestures such as rubbing fingers together, the Kinect skeleton is not sufficient since it does not provide joints for the fingers. Thus, using the hand positions, we first extract the sub-image of each hand region. Then, we compute the IQoM between successive extracted sub-frames. We only compute it when the person is not moving her hand since the IQoM can be affected by changes in the background. This feature is computed for each hand separately (LHM for the left hand, RHM for the right one) and for both (HM).
4.1.2 Facial features
For facial expressions, we extract the activation levels of 12 Actions Units (AU). Paul Ekman presented AUs as part of the Facial Action Coding System (FACS) [51]. This system has become one of the standards for systematic catego-rization of facial expressions. To extract these activation levels, we use the method presented in [52], which proposes a multi-task extension for a subspace learning algorithm called Metric Learning for Kernel Regression. Once we have extracted the activation level of each AU for each HD video frame, we compute the average and the standard deviation and use them as features.
4.1.3 Physiological features
The Nexus-10 device is used to extract physiological fea-tures classically associated in the literature with stress: car-diac functions (blood volume pulse, heart rate and heart rate variability) [13], [53], respiratory system (chest and abdominal respiration) [54], galvanic skin response [8], [55], skin temperature [56] and electromyographic activity of the sternocleidomastoid and upper trapezius [57]. For most of the signals described in Table A2, the mean, the variance, the minimum and the maximum values are used as features. In total, 62 physiological features are extracted.
4.2 Feature transformation
One issue when working with humans is interindividual differences. Indeed, as said in [58], “Different people tend to display the same emotion in very different ways”. These differ-ences may impact the feature distributions and prevent the machine learning algorithm from finding the most adequate model. We use the Box-Cox transformation [59] to normalize
the feature distributions in a systematic way. The Box-Cox transformation is defined as:
x0 =x 1
The aim is to find the value of that maximizes the correlation between the transformed feature x0 and the
normal distribution N (µ(x0), (x0)2). We only compute the
correlation for specific values of that can be found in Table 8. Tables A1 and A2 show which transformation is used for each behavioural and physiological feature.
-2 -1 -0.5 0 0.5 1 2
x0 1
x2 x1 p1x log(x)
p
x x x2
TABLE 8: Tested values of for the Box-Cox transformation and their associated transformation functions.
4.3 Feature subset selection
We perform feature subset selection in order to avoid over-fitting and better understand the predictive power of each feature. Each result presented in Section 5 corresponds to the best one obtained among the 3 following feature subset selection methods.
4.3.1 Forward selection wrapper (FSW)
Wrappers evaluate a subset of features by using the same machine learning algorithm as in the final application [60]. In our case, we use a SVM with a linear kernel function. Since training SVMs is computationally expensive, explor-ing the space of feature subsets is usually done usexplor-ing greedy methods [61]. With forward selection, starting from using only the feature with the best accuracy, we iteratively add the best feature among the remaining ones. Once all features have been added, we keep the subset that gives the best classification performances.
4.3.2 Backward elimination wrapper (BEW)
This method also uses a SVM to evaluate subsets. Backward elimination is also a greedy search strategy: starting from the complete set of features, we iteratively remove the worst feature of the remaining set. Once all features have been re-moved, we keep the subset that gives the best classification performances.
4.3.3 Simulated annealing with Hall correlation (SAHC) For this method, we use the simulated annealing meta-heuristic [62] to explore the space of feature subsets. Because of the computational cost of this space search strategy, we use the Hall correlation [63] to evaluate feature subsets. We then get a good approximation of the subset that both maximizes the correlation between features and labels and minimizes the inter-feature correlation.
4.4 Evaluation Process
We use a classification task to evaluate the predictive value of our framework. The objective is to predict the binary stress label - Stress or Non-Stress - of each of the 126 collected steps. To do so, we use SVMs with three different kernel functions: linear, polynomial and radial basis. We use a 10 fold subject independant cross validation strategy to compute the results: steps from 2 or 3 people are used as the testing set. The steps of the remaining people are used as the training set. This cross validation is also used with the training set to determine the SVM and kernel function parameters. Since our dataset is unbalanced for 2 assessment sets - SA and EOA - we have chosen the average of the F1 score for both Stress and Non-Stress classes as the performance metric. This metric allows us to consider the recall and the precision of both classes, unlike the usual F1 score that considers the recall and the precision only for the positive class and ignores the true negative rate. We use the Student’s t-test to compare two average F1 scores.
It is important to note that we use all the data for the feature transformation and feature subset selection steps. It has been done in order to facilitate the interpretation of the results and of the revelance of each feature. Consequently, we also present the average F1 score when the parameters for the feature transformation and the feature subset selec-tion are selected using only data from the training set and are then applied on the testing set.
5 E
VALUATION OF OUR FRAMEWORKIn this section, we present the predictive power of our framework for the 3 assessment sets described in Section 3. We present the results obtained by each modality - be-haviour and physiology - and by each feature.
5.1 Evaluation of the predictive power of each modality
Figures 9, 10 and 11 show the classification results obtained by the best selected feature subset for all 3 assessment sets. Feature are selected from the whole set of features (All*), only behavourial ones (Behaviour*) or only physiological ones (Physio*). Regarding PEA, we compute the results in 2 different conditions. First, we compute the classification results after having dismissed all the features which are the-oretically too correlated to the heart-rate variability: HRV-LF%, HRV-SDNN, HRV-RMSSD and RSP+HR. Including all the functionals applied to each feature (i.e. mean, standard deviation, min and max), we dismissed a total of 10 features that we refer to as Physiology Label Related (PLR) features. In the second condition,we dismiss only the features directly related to the low frequency in the heart-rate variability (HRV-LF%) that we used as our assessment. Including all the functionnals, we dismissed 4 features.
In general, we can see that, for most of the subsets, the linear kernel outperforms both RBF and polynomial kernels. It is due to the fact that most of the best subsets were provided by one of the 2 wrappers, which are optimized for the linear kernel. This may artificially boost its performances, thus inducing a bias when comparing modalities. We take this into account in the following discussion: when necessary, we also compare the average F1-scores of two modalities
without including the linear kernel. Overall, the results show that depending on the assessment set considered, the effectiveness of each modality and of their combination varies.
All* Behaviour* Physio* 0 0.5 1 0.81 0.84 0.74 0.86 0.8 0.73 0.9 0.85 0.8 0.85 0.83 0.76 mean F1
RBF Poly Linear Average Baseline Fig. 9: Performances of each kernel for each modality for the prediction of EOA. The baseline average F1 score obtained by a random classifier is 0.410 (± 0.083).
Features selected in All*: AU1-std, mean, AU2-std, AU4-mean, AU6-mean, AU12-AU2-std, AU15-mean, AU17-mean, BVP-mean, BVPA-max, HeM, IQoM, FTC, PCC, RSP-var, RSPR-max, max, RSP+HRC-mean,RSP+HRC-min, EMG-min, GSR-var
Regarding EOA (Figure 9), we can see that both modalities achieve good mean F1 scores: 0.829 (± 0.025) for behavioural features and 0.758 (± 0.033) for physiological ones. It is not surprising that behavioural features significantly out-perform physiological ones (p < 0.0001) since annotators based their judgement solely on the behaviour of the per-son in each video. It is however interesting to see that physiological features can predict how stress is assessed by external observers. It could have been explained by the fact that some of the physiological features selected can be visually perceived: features related to the respiration rate and EMG features, which can reflect the upper body activity. But the results obtained after having dimissed these features are similar with a mean F1 score of 0.751 (± 0.028). This feature subset is composed of 15 features: 7 related to HRV, 4 related to HR, 2 related to BVP, one related to GSR and one to skin temperature. The best results are obtained when we combine both modalities with a mean F1 score of 0.855 (± 0.020). The subset All* is composed of 24 features: 15 behavioural features and 9 physiological ones. It is however interesting to note that the difference in mean F1 score between the subsets All* and Behaviour* is statistically significant if we consider the 3 kernel functions, but is not if we do not consider the linear kernel. Overall, it seems that using only behavioural features is sufficient for the prediction of EOA. When we use all features and we include the feature transformation and the feature subset selection in the training phase, we obtain a mean F1 score of 0.739 (± 0.023).
Regarding SA, Figure 10 shows that the combination of physiological and behavioural features outperforms the re-sults obtained when using only one modality. It is
under-All* Behaviour* Physio* 0 0.5 1 0.7 0.61 0.59 0.82 0.58 0.59 0.87 0.65 0.67 0.8 0.61 0.63 mean F1
RBF Poly Linear Average Baseline Fig. 10: Performances of each kernel for each modality for the prediction of SA. The baseline average F1 score obtained by a random classifier is 0.404 (± 0.079).
Features selected in All*: AU4-mean, mean, AU6-std, AU12-AU6-std, AU17-AU6-std, BVP-max, BVP-min, BVPA-max, BVPA-min, BVPA-var, EMGMF-max, EMGMF-var, EMG-min, EMG-mean, EMG-var, GSR-var, HAPMV, HR-max, HRVA-var, IQoM, RHM, RSPA-max, RSPA-min, RSPA-var, RSPR-max, RSPR-mean, RSPR-min, RSP+HRC-max, RSP-var, FTMD, FT2HMD, TMP-min
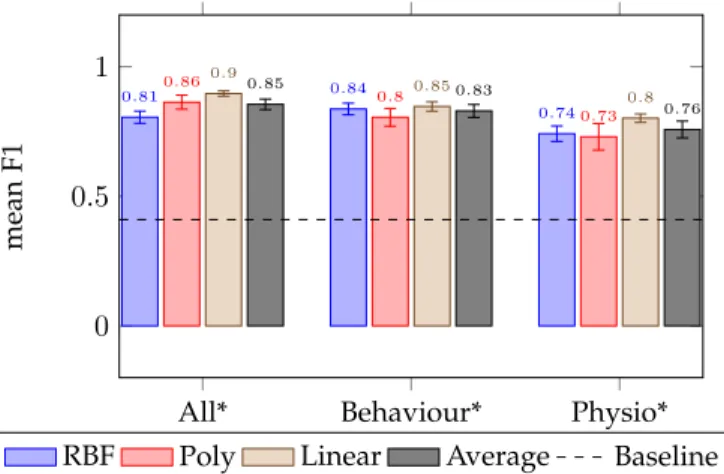
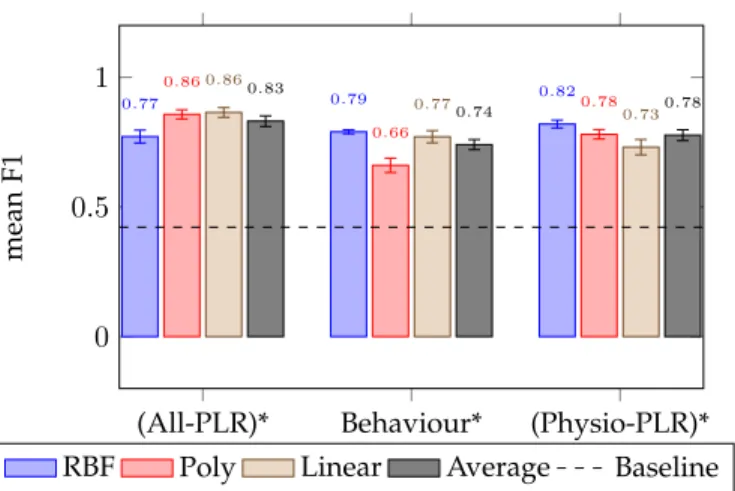
standable since the subjects of the experiment described in Section 2.1 watch their own videos before annotating them. Thus, their answers are the result of both their personal experiences and their behaviour analysis. The subset All* obtains a mean F1 score of 0.795 (± 0.028) and is composed of 32 features: 21 physiological features and 11 behavioural ones. When we use all features and we include the feature transformation and the feature subset selection in the train-ing phase, we obtain a mean F1 score of 0.691 (± 0.034). Figure 11 displays the results obtained for the prediction of PEA. As expected, physiological features obtain a good classification performance with an average F1 score of 0.777 (± 0.021) for the first condition (i.e. no features related to the heart-rate variability) and of 0.810 (± 0.026) for the second condition (i.e. no features related only to the low frequency in the heart-rate variability). As expected, using the features related to the heart-rate variability significantly improve the results (p = 0.0059) since these features are related to the one we used to compute PEA labels. Overall, both conditions significantly outperforms behavioural fea-tures (p < 0.05). It is however surprising to see that using only behavioural features also provides a good average F1 score of 0.740 (± 0.020). The selected subset Behaviour* is composed of 10 features: 7 features related to action units, 2 features related to body movement and the mean duration of face touching (FTMD). Regarding the combination of be-havioural and physiological features, there is no significant difference between the results obtained by both conditions: 0.831 (± 0.020) and 0.833 (± 0.021) for the first and second condition respectively. However, it is noteworthy that the best subset selected for the second condition is smaller - 17 features (12 physiological and 5 behavioural ones) against 25 features (16 physiological and 9 behavioural ones) for the first condition - and contains 3 features related to HRV:
(All-PLR)* Behaviour* (Physio-PLR)* 0 0.5 1 0.77 0.79 0.82 0.86 0.66 0.78 0.86 0.77 0.73 0.83 0.74 0.78 mean F1
RBF Poly Linear Average Baseline Fig. 11: Performances of each kernel for each modality for the prediction of PEA without using features related to HRV. The baseline average F1 score obtained by a random classifier is 0.422 (± 0.080).
Features selected in All*: AU1-mean, AU2-std, AU15-mean, AU17-std, AU25-mean, AU25-std, AU26-mean, BVPA-mean, BVPA-min, BVPA-var, EMGA-BVPA-mean, EMGMF-max, EMGMF-mean, EMG-min, GRS-max, HR-max, HR-mean, HRVA-max, HRVA-var, RSPA-max, RSPA-min, RSPA-var, RSPR-var, FTC, FTMD
HRV-RMSSD, HRV-SDNN and RSP+HR-Mean. When we use the features of the first condition and we include the feature transformation and the feature subset selection in the training phase, we obtain a mean F1 score of 0.705 (± 0.020).
5.2 Evaluation of the predictive power of each feature
We use the evaluation process described in Section 4.4 using only one feature at a time in order to better understand the classification performance of each feature for each as-sessment set. We compute the F1 score obtained by the three kernel functions. The average F1 score is used to rank features. In order not to overload the charts, we present only the five best features of each assessment set. The average F1 scores for each feature are presented in Tables A1 and A2. Regarding EOA, the results obtained by the 5 best features are shown in Table 9. We can see that these features achieve good classification performances even when used alone. Among these 5 features, there are 4 behavioural features and one physiological one, which is not surprising since the external observers had only access to the participants’ behaviour. The 4 behavioural features are all related to movement: 2 features are related to head movement (HeM and HeMZ), one to hand movement (HM) and one to body movement (IQoM). The best physiological feature is the minimum of the Blood Volume Pulse (BVP - Min). It is noteworthy that the 5 best physiological features for the prediction of EOA are all related to the BVP: 3 are related to the raw BVP signal (BVP-Min, Mean and Var) and 2 are related to the amplitude of the BVP signal (BVPA-Var and Max).
Table 10 displays the 5 best features for the prediction of SA. We can notice that these features achieve lower F1 scores than the best features for EOA and PEA. Added to the fact that, as shown in Figure 10, only a combination of
HeM 0.780 0.016
IQoM 0.723 0.025
HeMZ 0.716 0.021
BVP-Min 0.705 0.029
HM 0.696 0.024
TABLE 9: Five best features according to their average F1 score for the prediction of EOA. The Stdev column repre-sents the standard deviation over 10 runs.
physiological and behavioural features achieved good clas-sification performances, it tends to show that the prediction of SA is more complex, is based on both behavioural and physiological cues, and requires more information than the prediction of EOA and PEA. Among the 5 best features, 3 are behavioural and 2 are physiological. 2 features are related to body movement (IQoM and HeM), 2 to blood volume pulse (BVP - Min and Var) and one to periods of high activity (HAPC).
Feature Average F1 Stdev IQoM 0.621 0.028
HAPMV 0.617 0.028
SQoM 0.616 0.025
HeM 0.614 0.038
RSP-Min 0.609 0.031
TABLE 10: Five best features according to their average F1 score for the prediction of SA. The Stdev column represents the standard deviation over 10 runs.
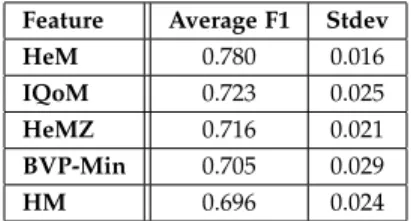
The 5 best features for the prediction of PEA are all related to the heart: 3 are related to the heart rate (HR- Mean, Max and Var) and 2 are related to the amplitude of the heart rate variablity (HRVA - Max, Mean). Their average F1 scores range from 0.711 ± 0.047 for HR-Mean to 0.652 ± 0.024. These results are coherent with what we described in Section 1.1.1 for the biological perspective: activating the HPA pathway and the ANS leads to an increased heart rate, which impacts the heart rate variability. Thus, it is not surprising to see these features perform well.
However, it is also interesting to see which non cardiac features are relevant for the prediction of a heart-related annotation. Thus, Table 11 presents the 5 best non heart-related features for the prediction of PEA. 3 features are related to respiration (RSP-Mean, RSPR-Max and Min) and 2 are related to action units (AU4-Mean, AU2-Std). It is also noteworthy that 4 of the 5 best behavioural features for the prediction of PEA are facial features (AU4-Mean and Std, AU2-Std and AU9-Std).
6 D
ISCUSSIONIn this section, we interpret and discuss the results obtained and discuss the strengths and limitations of the current study. We look at both the composition of the best selected feature subsets and the classification performances of each feature in order to better evaluate the relevance of each modality/feature for automatic stress detection.
RSP-Mean 0.621 0.028
RSPR-Max 0.617 0.033
AU4-Mean 0.600 0.031
RSPR-Min 0.590 0.043
AU2-Std 0.590 0.030
TABLE 11: Five best non heart-related features according to their mean F1 score for the prediction of PEA. The Stdev column represents the standard deviation over 10 runs.
6.1 Results interpretation
It was expected to see behavioural features perform better than physiological ones for the prediction of the assessment of external observers (EOA) and to see physiological fea-tures achieve better performances than behavioural ones for the prediction of the assessment of a physiology expert (PEA). However, it is interesting to notice that behavioural features still achieved good performances for PEA predic-tion (Figure 11, mean F1 score = 0.74), and that physio-logical features also provided good performances for EOA prediction (Figure 9, mean F1 score = 0.78). The fact that we can predict both the assessment of a physiology expert from behavioural features and the assessment of external observers from physiological features shows that there is some coherence between behavioural and physiological cues when one is experiencing stress despite the lack of agreement between EOA and PEA annotations (Tables 6 and 7). This interplay between physiology and behaviour that we observe in our results is coherent with several works on facial expressions [64], [65], [66], emotions [67], and stress [36], [68].
However, for all 3 assessment sets considered, the combi-nation of behavioural and physiological features provided the best results. It is especially true for SA, for which mul-timodal features outperform behavioural features by +31% and physiological features by +27%, as shown in Figure 10. Overall, we think that when the obtrusiveness of physiologi-cal sensors is acceptable, it is preferable to use a combination of behavioural and physiological features for automatic stress detection. Nonetheless, when unobtrusiveness is re-quired, using only behavioural features still provide good classification performances. These results are coherent with those presented by Giakoumis et al. in [1].
We also investigate whether some features provide relevant information for more than one assessment. The results ob-tained for SA and EOA are similar in some aspects (Tables 9 and 10). Indeed, the 5 best features for these 2 assessment sets are mainly related to body or body part movement (HeM, HeMZ, HM, IQoM, SQoM and HAPMV). The 5 best features for the prediction of PEA are all related to the heart and belong to 2 categories: heart rate (HR - max and HR var) and amplitude of the heart rate variability (HRVA -max, HRVA - mean, HRVA - var).
If we look at both the composition of the best subset for each assessment set and the predictive power of each feature (cf. Tables A1 and A2), it appears that some features provide relevant information for a multi-perspective stress detection. In particular, IQoM achieves good F1 scores for the 3
assess-ment sets and is present in the best subsets selected for SA and EOA. In general, features related to body or body part movement (IQoM, HeM, HeMZ, HM) provide good results for both SA and EOA prediction. Then, features related to the amplitude of blood volume pulse are present in all of the 3 best select subsets, and features related to the raw signal of blood volume pulse provide good classification performances for EOA prediction. Finally, the maximum of the heart rate achieves reasonably good performances and is present in the subsets selected for SA and PEA. These results and the fact that several works report the effect of stress on BVP [53], [69] and heart-rate [13], [21] lead us to conclude that these 2 categories of features, along with body movement, provide valuable information when designing automatic stress detection systems.
6.2 Strengths and limitations
This work should be interpreted within the context of its strengths and limitations. The strengths include (i) the multi-perspective approach of the stress phenomenon; (ii) the introduction of new behavioural features for stress detection: face-touching and fingers-rubbing, (iii) the high number of features evaluated and (iv) the high classification scores that allow us to interpret the predictive power of some features.
The limitations include (i) the sample size; (ii) the bias regarding participants being all volunteer medical students; and (iii) the experimental stimulus that elicits stress in a specific context.
7 C
ONCLUSION AND PERSPECTIVESIn this paper, we have studied the classification perfor-mances of modalities and features for the automatic detec-tion of a multi-perspective stress. The definidetec-tion of stress is still debated and can be studied from different perspectives. We have looked at this phenomenon from 3 perspectives: the phenomenological, the behavioural and the biological ones. For the classification task, we have collected 3 different assessments:
• external oberservers assessment from annotators
re-cruited on a crowdsourcing platform for the be-havioural perspective;
• self-assessment from the subjects for the
phenomeno-logical perspective;
• assessment from a physiology expert for the
biologi-cal perspective;
The low agreement between the different annotations dis-played in Tables 6 and 7 show that it is important to consider the 3 annotations in order to get a broader view on the performances of stress detection systems. We have extracted 3 categories of features from different sources: body features from Kinect data, facial features from HD video and physiological features from signals provided by the Nexus-10. In total, 101 features have been automatically extracted. We performed binary classification on the 3 as-sessment sets to evaluate our features. Overall, it appears that it is preferable to use a combination of behavioural and physiological features for automatic stress detection and that there is an interplay between physiology and behaviour
in stressful situations that could be used to enhance the performance of stress detection. By investigating the compo-sition of the best selected feature subsets and the individual feature classification performances, we show that features related to body movement, blood volume pulse and heart-rate provide valuable information for the classification of the 3 assessments.
Future works include studying how we can use the in-terplay between physiology and behaviour to enhance the performance of automatic stress detection, investigating the feasibility of aggregating the introduced assessments, using a multi-label classification task and applying this method-ology to other mental states or disorders such as anxiety disorders.
R
EFERENCES[1] Dimitris Giakoumis, Anastasios Drosou, Pietro Cipresso, Dim-itrios Tzovaras, George Hassapis, Andrea Gaggioli, and Giuseppe Riva. Using activity-related behavioural features towards more effective automatic stress detection. PloS one, 7(9):e43571, January 2012.
[2] Iulia Lefter, Gertjan Burghouts, and Leon Rothkrantz. Recognizing stress using semantics and modulation of speech and gestures. IEEE Transactions on Affective Computing, 3045(c):1–1, 2015. [3] Y Lutchyn, Gloria Mark, Akane Sano, Paul Johns, Mary
Czerwin-ski, and Shamsi Iqbal. Stress is in the eye of the beholder. In Affective Computing and Intelligent Interaction, 2015.
[4] Armando Barreto, Jing Zhai, and Malek Adjouadi. Non-intrusive Physiological Monitoring for Automated Stress Detection in Human-Computer Interaction. In Human-Computer Interaction, pages 29–38, 2007.
[5] Tong Chen, Peter Yuen, Mark Richardson, Guangyuan Liu, Zhishun She, and Senior Member. Detection of Psychological Stress Using a Hyperspectral Imaging Technique. IEEE Transac-tions on Affective Computing, 5(4):391–405, 2014.
[6] Raul Fernandez and Rosalind W Picard. Modeling drivers’ speech under stress. Speech communication, 40(1):145–159, 2003.
[7] Andrea Gaggioli, Giovanni Pioggia, Gennaro Tartarisco, Giovanni Baldus, Marcello Ferro, Pietro Cipresso, Silvia Serino, Andrei Popleteev, Silvia Gabrielli, Rosa Maimone, and Giuseppe Riva. A system for automatic detection of momentary stress in naturalistic settings. Studies in health technology and informatics, 181:182–6, January 2012.
[8] J.a. Healey and R.W. Picard. Detecting Stress During Real-World Driving Tasks Using Physiological Sensors. IEEE Transactions on Intelligent Transportation Systems, 6(2):156–166, 2005.
[9] Kurt Plarre, Andrew Raij, Syed Monowar Hossain, Amin Ah-san Ali, Motohiro Nakajima, Mustafa Absi, Emre Ertin, Thomas Kamarck, Santosh Kumar, Marcia Scott, Daniel Siewiorek, Asim Smailagic, and Lorentz E Wittmers. Continuous Inference of Psychological Stress from Sensory Measurements Collected in the Natural Environment. Information Processing in Sensor Networks (IPSN), pages 97–108, 2011.
[10] Yuan Shi, Minh Hoai Nguyen, Patrick Blitz, Brian French, Scott Fisk, Fernando De Torre, Asim Smailagic, Daniel P Siewiorek, Mustafa Absi, Emre Ertin, Thomas Kamarck, and Santosh Kumar. Personalized Stress Detection from Physiological Measurements. In Internation Symposium on Quality of Life Technology, 2010. [11] Jacqueline Wijsman, Bernard Grundlehner, Hao Liu, Hermie
Her-mens, and Julien Penders. Towards mental stress detection using wearable physiological sensors. In IEEE Engineering in Medicine and Biology Society, volume 2011, pages 1798–801, 2011.
[12] Guojun Zhou, John H L Hansen, Senior Member, and James F Kaiser. Nonlinear Feature Based Classification of Speech Under Stress. IEEE Transactions on speech and audio processing, 9(3):201– 216, 2001.
[13] J M Koolhaas, a Bartolomucci, B Buwalda, S F de Boer, G Fl ¨ugge, S M Korte, P Meerlo, R Murison, B Olivier, P Palanza, G Richter-Levin, a Sgoifo, T Steimer, O Stiedl, G van Dijk, M W¨ohr, and E Fuchs. Stress revisited: a critical evaluation of the stress concept. Neuroscience and biobehavioral reviews, 35(5):1291–301, 2011.
[14] H Selye. A syndrome produced by diverse nocuous agents. Nature, 1936.
[15] Sandor Szabo, Yvette Tache, and Arpad Somogyi. The legacy of Hans Selye and the origins of stress research: A retrospective 75 years after his landmark brief “Letter” to the Editor # of Nature. Stress, 15(5):472–478, September 2012.
[16] Hans Selye. Stress without Distress. In Psychopathology of Human Adaptation, pages 137–146. Springer US, Boston, MA, 1976. [17] Luiz Pessoa and Ralph Adolphs. Emotion processing and the
amygdala: from a ’low road’ to ’many roads’ of evaluating bio-logical significance. Nature Reviews Neuroscience, 11(11):773–783, November 2010.
[18] Joseph LeDoux. Rethinking the Emotional Brain. Neuron, 73(4):653–676, February 2012.
[19] E Elenko, L Underwood, and D Zohar. Defining digital medicine. Nature biotechnology, 2015.
[20] Sue C Jacobs, Richard Friedman, John D Parker, Geoffrey H Tofler, Alfredo H Jimenez, James E Muller, Herbert Benson, and Peter H Stone. Use of skin conductance changes during mental stress testing as an index of autonomic arousal in cardiovascular research. American Heart Journal, 128(6):1170–1177, December 1994. [21] Joachim Taelman, S Vandeput, A Spaepen, and S Van Huffel. In-fluence of Mental Stress on Heart Rate and Heart Rate Variability. In 4th European Conference of the International Federation for Medical and Biological Engineering, pages 1366–1369. 2009.
[22] M Traina, A Cataldo, F Gallulo, and G Russo. Effects. of anxiety due to mental stress on heart rate variability in healthy subjects. Minerva psichiatrica, 2011.
[23] Fred Shaffer, Rollin McCraty, and Christopher L Zerr. A healthy heart is not a metronome: an integrative review of the heart’s anatomy and heart rate variability. Frontiers in psychology, 5, 2014. [24] A Moriguchi, A Otsuka, K Kohara, H Mikami, K Katahira, T Tsunetoshi, K Higashimori, M Ohishi, Y Yo, and T Ogihara. Spectral change in heart rate variability in response to mental arithmetic before and after the beta-adrenoceptor blocker, carte-olol. Clinical Autonomic Research, 2(4):267–270, 1992.
[25] Walter B Cannon. The James-Lange Theory of Emotions: A Critical Examination and an Alternative Theory. The American journal of psychology, 39(1/4):106–124, 1927.
[26] Tim Dalgleish. The emotional brain. Nature Reviews Neuroscience, 5(7):583–589, July 2004.
[27] Andr´e Schulz and Claus V¨ogele. Interoception and stress. Frontiers in psychology, 6:993, 2015.
[28] R S Lazarus. Psychological stress and the coping process. 1966. [29] R S Lazarus. From psychological stress to the emotions: a history
of changing outlooks. Annual review of psychology, 44:1–21, 1993. [30] Sheldon Cohen, Tom Kamarck, and Robin Mermelstein. A Global
Measure of Perceived Stress. Journal of health and social behavior, 24(4):385, December 1983.
[31] Kenneth B Matheny, David W Aycock, William L Curlette, and Gary N Junker. The coping resources inventory for stress: A mea-sure of perceived resourcefulness. Journal of Clinical Psychology, 49(6):815–830, November 1993.
[32] Ian McDowell. Measuring health: a guide to rating scales and ques-tionnaires. Oxford University Press, 2006.
[33] F X Lesage, S Berjot, and F Deschamps. Clinical stress assessment using a visual analogue scale. Occupational medicine, 62(8):kqs140– 605, September 2012.
[34] Alfonso Troisi. Displacement Activities as a Behavioral Measure of Stress in Nonhuman Primates and Human Subjects. Stress, 5(1):47– 54, July 2009.
[35] Changiz Mohiyeddini and Stuart Semple. Displacement be-haviour regulates the experience of stress in men. Stress, 16(2):163– 171, September 2012.
[36] O. Weisman, M. Chetouani, C. Saint-Georges, N. Bourvis, E. Dela-herche, O. Zagoory-Sharon, D. Cohen, and R. Feldman. Dynamics of non-verbal vocalizations and hormones during father-infant interaction. IEEE Transactions on Affective Computing, 2016. to appear.
[37] MRA Chance. An interpretation of some agonistic postures; the role of ”cut-off” acts and postures. Symposia of the Zoological Society of London, 1962.
[38] Changiz Mohiyeddini, Stephanie Bauer, and Stuart Semple. Dis-placement Behaviour Is Associated with Reduced Stress Levels among Men but Not Women. PloS one, 8(2):e56355–9, February 2013.
[39] Sally S Dickerson and Margaret E Kemeny. Acute stressors and cortisol responses: a theoretical integration and synthesis of laboratory research. Psychological bulletin, 130(3):355–91, May 2004. [40] Egon Brunswik. Perception and the representative design of
psycholog-ical experiments. Univ of California Press, 1956.
[41] Alessandro Vinciarelli and Gelareh Mohammadi. A Survey of Personality Computing. IEEE Transactions on Affective Computing, 5(3):273–291, 2014.
[42] Nguyen Quoc Viet Hung, Nguyen Thanh Tam, Lam Ngoc Tran, and Karl Aberer. An evaluation of aggregation techniques in crowdsourcing. In Web Information Systems Engineering, pages 1– 15. Springer Berlin Heidelberg, 2013.
[43] Hagit Cohen, Jonathan Benjamin, Amir B. Geva, Mike a. Matar, Zeev Kaplan, and Moshe Kotler. Autonomic dysregulation in panic disorder and in post-traumatic stress disorder: Application of power spectrum analysis of heart rate variability at rest and in response to recollection of trauma or panic attacks. Psychiatry Research, 96(1):1–13, 2000.
[44] Sansanee Boonnithi and Sukanya Phongsuphap. Comparison of heart rate variability measures for mental stress detection. In Computing in Cardiology, volume 38, pages 85–88, 2011.
[45] Djordje Bozovic, Maja Racic, and Nedeljka Ivkovic. Salivary cortisol levels as a biological marker of stress reaction. Medical archives, 67(5):374, 2013.
[46] J R Landis and G G Koch. The measurement of observer agreement for categorical data. Biometrics, 33(1):159–174, 1977.
[47] G Caridakis, A Raouzaiou, K Karpouzis, and S Kollias. Synthe-sizing Gesture Expressivity Based on Real Sequences. In Workshop Multimodal Corpora. From Multimodal Behaviour Theories to Usable Models. In: International Conference on Language Resources and Eval-uation, pages 19–23, 2006.
[48] Tom Giraud, David Antonio G´omez J´auregui, Jiewen Hua, Brice Isableu, Edith Filaire, Christine Le Scanff, and Jean Claude Martin. Assessing postural control for affect recognition using video and force plates. In International Conference on Affective Computing and Intelligent Interaction and Workshops, pages 109–115, 2013. [49] D. Glowinski, N. Dael, a. Camurri, G. Volpe, M. Mortillaro, and
K. Scherer. Toward a Minimal Representation of Affective Ges-tures. IEEE Transactions on Affective Computing, 2(2):106–118, 2011. [50] Jinni Harrigan. Self-touching as an indicator of underlying affect and language processes. Social Science and medicine, 20(11):1161– 1168, 1985.
[51] Paul Ekman and Wallace V. Friesen. Facial action coding system, 1977.
[52] J´er´emie Nicolle, Kevin Bailly, and Mohamed Chetouani. Facial Ac-tion Unit Intensity PredicAc-tion via Hard Multi-Task Metric Learning for Kernel Regression. IEEE International Conference and Workshops on Automatic Face and Gesture Recognition, 2015.
[53] L Finsen, K Søgaard, C Jensen, V Borg, and H Christensen. Muscle activity and cardiovascular response during computer-mouse work with and without memory demands. Ergonomics, 44(14):1312–1329, 2001.
[54] Devy Widjaja, Michele Orini, Elke Vlemincx, and Sabine Van Huf-fel. Cardiorespiratory dynamic response to mental stress: a mul-tivariate time-frequency analysis. Computational and mathematical methods in medicine, 2013, 2013.
[55] Yu Shi, Natalie Ruiz, Ronnie Taib, Eric Choi, and Fang Chen. Galvanic skin response (GSR) as an index of cognitive load. In Extended abstracts on Human factors in computing systems, pages 2651–2656, 2007.
[56] Katherine A Herborn, James L Graves, Paul Jerem, Neil P Evans, Ruedi Nager, Dominic J McCafferty, and Dorothy EF McKeegan. Skin temperature reveals the intensity of acute stress. Physiology & behavior, 152:225–230, 2015.
[57] Jacqueline Wijsman, Bernard Grundlehner, Julien Penders, and Hermie Hermens. Trapezius muscle emg as predictor of mental stress. In Wireless Health 2010, pages 155–163. ACM, 2010. [58] Daniel Bernhardt and Peter Robinson. Detecting affect from
non-stylised body motions. International Conference on Affective Computing and Intelligent Interaction and Workshops, pages 59–70, 2007.
[59] R M Sakia. The Box-Cox Transformation Technique: A Review. Journal of the Royal Statistical Society, 41(2):169–178, 1992.
[60] Ron Kohavi and George H. John. Wrappers for feature subset selection. Artificial Intelligence, 97:273–324, 1997.