HAL Id: inserm-02492717
https://www.hal.inserm.fr/inserm-02492717
Submitted on 27 Feb 2020
HAL is a multi-disciplinary open access
archive for the deposit and dissemination of
sci-entific research documents, whether they are
pub-lished or not. The documents may come from
teaching and research institutions in France or
abroad, or from public or private research centers.
L’archive ouverte pluridisciplinaire HAL, est
destinée au dépôt et à la diffusion de documents
scientifiques de niveau recherche, publiés ou non,
émanant des établissements d’enseignement et de
recherche français ou étrangers, des laboratoires
publics ou privés.
exhausted CD8+ T cells in HCV infection
Valeria Barili, Paola Fisicaro, Barbara Montanini, Greta Acerbi, Anita
Filippi, Giovanna Forleo, Chiara Romualdi, Manuela Ferracin, Francesca
Guerrieri, Giuseppe Pedrazzi, et al.
To cite this version:
Valeria Barili, Paola Fisicaro, Barbara Montanini, Greta Acerbi, Anita Filippi, et al.. Targeting p53
and histone methyltransferases restores exhausted CD8+ T cells in HCV infection. Nature
Commu-nications, Nature Publishing Group, 2020, 11 (1), pp.604. �10.1038/s41467-019-14137-7�.
�inserm-02492717�
Targeting p53 and histone methyltransferases
restores exhausted CD8
+ T cells in HCV infection
Valeria Barili
1,2
, Paola Fisicaro
2
, Barbara Montanini
3,4
, Greta Acerbi
1,2
, Anita Filippi
2
, Giovanna Forleo
2
,
Chiara Romualdi
5
, Manuela Ferracin
6
, Francesca Guerrieri
7
, Giuseppe Pedrazzi
8
, Carolina Boni
2
,
Marzia Rossi
1,2
, Andrea Vecchi
1,2
, Amalia Penna
2
, Alessandra Zecca
2
, Cristina Mori
2
, Alessandra Orlandini
2
,
Elisa Negri
2
, Marco Pesci
1,2
, Marco Massari
9
, Gabriele Missale
1,2
, Massimo Levrero
7,10,11
,
Simone Ottonello
3,4
& Carlo Ferrari
1,2
*
Hepatitis C virus infection (HCV) represents a unique model to characterize, from early to
late stages of infection, the T cell differentiation process leading to exhaustion of human
CD8
+ T cells. Here we show that in early HCV infection, exhaustion-committed
virus-speci
fic CD8+ T cells display a marked upregulation of transcription associated with impaired
glycolytic and mitochondrial functions, that are linked to enhanced ataxia-telangiectasia
mutated (ATM) and p53 signaling. After evolution to chronic infection, exhaustion of
HCV-speci
fic T cell responses is instead characterized by a broad gene downregulation associated
with a wide metabolic and anti-viral function impairment, which can be rescued by histone
methyltransferase inhibitors. These results have implications not only for treatment of
HCV-positive patients not responding to last-generation antivirals, but also for other chronic
pathologies associated with T cell dysfunction, including cancer.
https://doi.org/10.1038/s41467-019-14137-7
OPEN
1Department of Medicine and Surgery, University of Parma, Parma, Italy.2Unit of Infectious Diseases and Hepatology, Laboratory of Viral Immunopathology, Azienda Ospedaliero–Universitaria of Parma, Parma, Italy.3Biomolecular, Genomic and Biocomputational Sciences Unit, Department of Chemistry, Life Sciences and Environmental Sustainability, University of Parma, Parma, Italy.4Biopharmanet-Tec, University of Parma, Parma, Italy.5Department of Biology, University of Padova, Padova, Italy.6Department of Experimental, Diagnostic and Specialty Medicine—DIMES, University of Bologna, Bologna, Italy.7Cancer Research Center of Lyon (CRCL)-INSERM U1052, Lyon, France.8Unit of Neuroscience, Department of Medicine and Surgery, Robust Statistics Academy (Ro.S.A.), University of Parma, Parma, Italy.9Unit of Infectious Diseases, IRCCS–Azienda Ospedaliera S. Maria Nuova, Reggio Emilia, Italy.10Université Claude Bernard Lyon 1, Service d’Hepatologie et Gastroenterologie Hopital de la Croix-Rousse, Hospices Civils de Lyon, Lyon, France.11Center for Life Nano Science, Istituto Italiano di Tecnologia, Rome, Italy. *email:carlo.ferrari@unipr.it
123456789
H
epatitis C virus (HCV) infection can progress to
resolu-tion in around 20–40% of the cases; conversely, in
60–80% of infected patients the virus persists and the
infection becomes chronic. Therefore, patients with different
disease outcomes can be identified at early stages of infection
making hepatitis C an ideal model to study the process of
dif-ferentiation from early exhaustion-committed to late fully
exhausted CD8+ T cells in humans. Spontaneous viral clearance
is associated with efficient CD8+ T cell responses, whereas
cytotoxic T cells are functionally impaired in chronically infected
patients
1,2. In chronic viral infections, including hepatitis C,
persistent antigen stimulation is believed to represent a major
determinant of CD8+ T cell dysfunction, which is characterized
by upregulation of multiple inhibitory receptors, repressive
transcriptional reprogramming, broad metabolic alterations and
defective T cell effector function and memory development
3–9.
To improve exhausted T cell functions, regulatory pathway
manipulation has been attempted in various experimental
set-tings, but a full restoration has not been achieved so far
5,10–12. It
is thus becoming increasingly clear that T cell exhaustion results
from a broader cellular alteration with an extensive involvement
of crucial T cell functions, including metabolism and epigenetic
regulation
13–16. Indeed, the role of metabolic reprogramming in
T cell differentiation is now well appreciated
6,15,17. In particular,
differentiation of naïve into effector T cells is accompanied by a
marked upregulation of aerobic glycolysis, to meet the increased
energetic demands associated with this transition
18–20. Following
successful control of infection, glycolysis is turned down, and
mitochondrial fatty acid oxidation (FAO) becomes the major
provider of metabolic energy to support memory CD8+ T cell
generation, survival, and antigen recall responsiveness
21,22.
Severe defects in HBV-specific CD8+ T cell mitochondrial
function (e.g., impaired FAO, ROS overproduction and
mito-chondrial depolarization) and the positive effect of their
correc-tion on CD8+ T cell exhauscorrec-tion have recently been reported in
chronic HBV infection
23,24. In the LCMV mouse model of
chronic infection, glycolysis downregulation and OXPHOS
impairment are hallmarks of exhaustion and are more evident in
the PD1
hithan in the PD1
intsubset of exhausted CD8+ T cells
25.
A dysregulated gene expression profile consistent with these
metabolic changes has recently been described in human
HCV-specific CD8+ T cells committed to exhaustion
26, but a
func-tional assessment of the actual contribution of metabolic and
epigenetic state alteration to CD8+ T cell dysfunction and its
causal association with exhaustion is still lacking
27.
To further delineate and functionally validate key dysregulated
pathways associated with the development of exhausted T cell
responses, we applied genome-wide transcriptome profiling,
coupled with multiple functional validation assays and targeted
rescue strategies, to virus-specific CD8+ T cells from chronically
evolving or resolved HCV infections. We show, here, that
dif-ferentiation from early exhaustion-committed to late fully
exhausted CD8+ T cells is marked by a transition from a
pre-dominantly upregulated early gene expression profile to a massive
late downregulation with global repression of core cellular
pro-cesses and an extensive histone methylation-dependent repressive
chromatin remodeling. Targeting dysfunctional signaling,
meta-bolic and chromatin remodeling pathways can efficiently improve
CD8+ T cell metabolism and antiviral function, and may thus
represent a novel rational immunomodulatory strategy, perhaps
complementary to PD-1 or other checkpoint inhibitor blockade,
to correct T cell exhaustion. This may positively impact HCV
infection, especially in
‘Direct Acting Antivirals’ (DAA)
non-responder patients who still require effective therapies, but also
other chronic diseases, including cancer, displaying T cell
dys-function caused by persistent CD8+ T cell stimulation.
Results
Early dysregulated metabolic and signaling pathways in
HCV-speci
fic CD8+ T cells. We characterized CD8+ T cell gene
expression profiles associated with either spontaneous HCV
control and T cell memory generation or virus persistence and T
cell exhaustion. HCV-specific CD8+ T cells were collected and
sorted (Supplementary Fig. 1) from patients with T1/early
self-limited or chronically evolving acute HCV infection immediately
after clinical presentation (HCV RNA-positive patients, within
one month from the ALT peak; T1/early time-point) and at later
stages of resolution (HCV RNA-negative patients, at least
12 months after the ALT peak; T2/late time-point) or chronic
evolution of infection (HCV RNA-positive patients, followed for
at least one year after the
first detection of ALT elevation; T2/late
time-point). Patients were thus subdivided into four groups,
designated as T1/early self-limited (n
= 5), T1/early chronic (n =
8), T2/late resolved (late resolution phase of T1 self-limited
patients; n
= 4) and T2/late-chronic (n = 7).
Principal-component analysis of ANOVA-filtered expression
data (Fig.
1
a) revealed a significant overlap between the two groups
at the T1/early-stage time-point and a substantial separation
between T2 late-stage patients belonging to either the chronic (i.e.,
T cell-exhausted) or the fully resolved groups. This was confirmed
by the statistical clustering of gene expression data shown in Fig.
1
b,
where the dysfunctional profiles of early and late exhausted CD8+
T cells appear to be distinct from that of FLU-specific CD8+ T cells
from healthy donors, which served as fully functional memory T cell
controls. Altogether, these results suggest a progressive,
outcome-dependent accumulation of divergent gene expression signatures
starting from more comparable acute phase transcriptional profiles.
A topology-based analysis, which relies not only on the
assignment of dysregulated genes to a given pathway but also on
gene connections derived from pathway annotation, was then
applied to the T1 and T2 datasets. Twenty-nine dysregulated
pathways (Benjamini-Hochberg corrected q-value
≤ 0.05) were
identified by this analysis in T1/early HCV-specific CD8+ T cells
from chronically evolving compared to self-limited acute patients
(Fig.
1
c and Supplementary Data 1). By contrast, 277
dysregu-lated pathways were retrieved by the same analysis from the T2/
late comparison of HCV-specific exhausted and memory CD8+
T cells from chronic and resolved patients, respectively. Fifteen of
these pathways were shared by the T1 and the T2 time-points
(Fig.
1
c). Most of them (14 out of 15) were upregulated at the T1/
early-stage of chronically evolving infection but downregulated
(13 out of 15) at the T2/late-stage time-point (Fig.
1
c). The
15 shared dysregulated pathways (Fig.
1
c) include intracellular
signaling downstream to TCR activation, NF-kB/TNF activation,
DNA damage response and mitochondrion (MT)-related
meta-bolic functions as the most represented cellular processes (see
Supplementary Data 1). Half of the 14 T1/early-dysregulated
pathways, which were not shared with the T2/late time-point,
were downregulated. These comprised genes related to glucose
transport (GLUT1 and GLUT4, also known as SLC2A1 and
SLC2A4) and cytokine signaling, including the T cell-specific,
glycolysis-regulatory CD28 signaling pathway (Fig.
1
d). Other
genes related to glucose homeostasis, including genes coding for
gluconeogenesis enzymes known to be involved in the production
of glycolytic intermediates under low glucose conditions
28(see
Supplementary Data 1), also emerged as enriched from
topology-based analysis.
The entire T1 dataset was then subjected to unsupervised
gene-set enrichment analysis (GSEA), which allows to reveal gene-sets of
differentially regulated, functionally related genes, rather than
individual high-scoring genes, above an arbitrarily set cut-off. As
shown in Fig.
1
e and Supplementary Fig. 2 (see also the T1 sheets
in Supplementary Data 2), all dysregulated pathways and gene
ontology categories identified by GSEA were upregulated in
HCV-specific CD8+ T cells from T1/early chronic patients.
In particular, GSEA confirmed a strong upregulation of multiple
DNA damage response, intracellular signaling and cell-cycle
control genes, including immune-checkpoint inhibitors, such
as PD-1 (also known as PDCD1), CD160, CTLA4 and TIGIT
(see the T1 sheets in Supplementary Data 2). Notably, GSEA
also confirmed the upregulation of a large set of genes coding
for mitochondrial oxidative phosphorylation (OXPHOS) and
electron transport, reactive oxygen species (ROS) detoxification
and fatty acid oxidation (FAO) components (see Fig.
1
e and
Supplementary Data 2). Further analysis of GSEA data using
the KEGG Reactome and GO databases allowed to group
T1 upregulated genes into eight distinct functional categories
matching the above mentioned dysregulated processes
(Supple-mentary Fig. 2).
A generalized upregulation thus appears to be the predominant
but not exclusive feature of acute-phase dysregulation.
Impaired CD8
+ T cell glucose and mitochondrial metabolism
in early infection. To gain insight into the relationship between
a
c
b
FLU healthy
Acute HCV chronic evolution (T1)
HCV resolved (T2) HCV chronic (T2)
FLU healthy
Acute HCV chronic evolution (T1)
Acute HCV self-limited (T1)
HCV resolved (T2)
HCV chronic (T2) Signal
Cell cycle
DNA damage
DNA repair Cell signaling Mitochondrion
-mTOR signaling -Downstream TCR signaling -NFkB activation -Jnk C-Jun Kinases phosphorylat. and activation -Activation of ATR in response to replication stress -Telomere maintenance -p53 dependent G1 DNA damage response -DNA repair
-TCA cycle and respiratory electron transport -Oxidative phosphoryl. -Mitochon. protein import -Lipid oxidation -DNA replication -Cell cycle checkpoints -Mitotic M-G1 phases HCV self-limited HCV chr. evol. HCV self-limited HCV chr. evol. HCV self-limited HCV chr. evol. HCV self-limited HCV chr. evol. Signal
d
e
15 T1 = 29 T2 = 277Adipocytokine signaling pathway Alcoholism
Cell adhesion molecules (CAMs)
DNA damage/telomere stress induced senescence Hepatitis C
Herpes simplex infection Hypertrophic cardiomyopathy (HCM) Metabolism of vitamins and cofactors
Metabolism of water-soluble vitamins and cofactors NF-kappa B signaling pathway
RIG-I-like receptor signaling pathway Shigellosis
Signaling by retinoic acid T cell receptor signaling pathway TNF signaling pathway
-T1 (Chronic-evol vs. self-lim) = 29 dysregulated pathways
Y-axis X-axis –40 –20 0 20 40 60 40 20 0 –40 –20 –60 –50 0 50 100 60 40 20 0 –20 –40 –60 –40 –20 0 20 40 100 50 0 –50
-T2 (Chronic vs. resolved) = 277 dysregulated pathways
T1 T2
Biotin transport and metabolism CD28 co-stimulation
CD28 dependent PI3K/Akt signaling Complement and coagulation cascades Defensins
Epithelial cell signaling in helicobacter pylori infection Glyoxylate and dicarboxylate metabolism Metal ion SLC transporters
Mitochondrial fatty acid beta-oxidation
O-glycosylation of TSR domain-containing proteins Propanoate metabolism
Regulatory RNA pathways Scavenging by class A receptors Synthesis of PA T1 Up (red) Down (blue) 14 T1 = 29 T2 = 277 –2.5 0 2.8 –2.0 0 2.0 Acute HCV self-limited (T1) –40 –20 –60 –50 Z-axis
the dysregulation of metabolism-related genes and progression
toward the exhaustion phenotype, GSEA analysis was applied
using the molecular signature identified in the murine model
of chronic LCMV infection
25, obtained by merging the
leading-edge genes belonging to the different metabolic KEGG pathways.
As shown in Supplementary Fig. 3a, a significant overlap was
observed between metabolism-related genes that appear to be
dysregulated in early exhausted LCMV-specific lymphocytes and
in T1/early exhausted HCV-specific CD8+ T cells. Importantly,
in the case of the
‘glycolysis and gluconeogenesis’ and ‘oxidative
phosphorylation’ pathways, and of the ‘glucose deprivation
signature
25,29, the correlation of the two datasets was confirmed
also when all genes (not only those restricted to the leading-edge
set) were considered (Supplementary Fig. 3b).
Particularly evident was a parallel enrichment in upregulated
genes related to mitochondrial metabolism and a concomitant
enrichment in downregulated, glycolysis-related genes at the T1
time-point, both of which were significantly correlated with the
relative expression levels of the same sets of genes in the LCMV
model of chronic infection (Pearson p-values < 0.05). Based on
these
findings and on similar data reported for other models of
lymphocyte exhaustion
29, we hypothesized that HCV-specific
CD8+ T cells from chronically evolving T1/early patients are in
shortage of glucose, which is required to meet the energy and
biosynthetic demands of T cell expansion.
To functionally verify T1/early metabolic gene dysregulation,
we initially focused on glucose metabolism and measured glucose
import, the
first limiting step of glycolysis, as well as glucose
transporter 1 (GLUT1) protein levels. As shown in Fig.
2
a–c,
glucose uptake and GLUT1 levels were both significantly reduced
in T1/early HCV-specific CD8+ T cells from chronically evolving
compared to self-limited patients and FLU-specific CD8+
controls. In line with these
findings, also glucose consumption
was diminished in T1/early chronic CD8+ T cells compared to
control CD8+ T cells (Supplementary Fig. 4a).
The basal extracellular acidification rate (ECAR), a quantitative
indicator of glycolytic activity, as well as the maximum glycolytic
capacity and glycolytic reserve were also reduced in HCV
peptide-stimulated CD8+ T cells from chronically evolving T1/
early patients compared to control peptide (FLU, CMV and
EBV)-stimulated cells (see Fig.
2
d and the cell energy phenotype
plots in Supplementary Fig. 4b). Conversely, NS3-HCV peptide
stimulated CD8+ T cells from T1/early acute self-limited patients
displayed higher ECAR values, both at basal and maximal
respiration levels, compared to CD8+ T cells derived from T1/
early chronically-evolving patients (see Fig.
2
e and the cell energy
phenotype plots in Supplementary Fig. 4c).
Interestingly, in the same set of cells, expression levels of the
PD-1 co-inhibitor were inversely related to glucose uptake capacity
and were maximal in CD8+ T cells from T1/early chronically
evolving patients, thus suggesting a possible link between PD-1
upregulation and altered glucose metabolism (Supplementary
Fig. 4d).
HCV-specific CD8+ T cells from T1/early chronic patients also
displayed an impaired mitochondrial function. In fact, a markedly
reduced mitochondrial membrane potential (Fig.
3
a) and
abnor-mally elevated mitochondrial ROS levels (Fig.
3
b, c) were detected
in CD8+ T cells from chronically evolving patients. Further
confirming a depressed mitochondrial respiratory capacity, a
significantly lower basal oxygen consumption rate (OCR) and
similarly reduced maximal and spare respiratory capacities were
measured in purified HCV peptide-stimulated CD8+ T cells from
chronically evolving patients (see Fig.
3
d and the cell energy
phenotype plots in Supplementary Fig. 4b). Again, NS3-HCV
peptide stimulated CD8+ T cells from T1/early acute self-limited
patients displayed higher OCR values, both at basal and maximal
respiration levels, compared to CD8+ T cells from T1/early
chronically-evolving patients (see Fig.
3
e and the cell energy
phenotype plots in Supplementary Fig. 4c).
Evidence that this difference in glycolytic and mitochondrial
efficiency was not merely due to a lack of T cell activation was
provided by the increased cytokine production detected in HCV
peptide-stimulated compared to unstimulated cells
(Supplemen-tary Fig. 4e). Multiple lines of evidence also indicate that the
observed metabolic differences cannot be simply ascribed to
different frequencies of virus-specific CD8+ T cells within the
total CD8+ population or to an insufficient sensitivity of the
Seahorse analysis at the low HCV-specific CD8+ T cell
frequencies commonly found in HCV infected patients. In fact,
a similar difference in metabolic profiles between early
self-limited and chronically evolving acute infections was observed
when Seahorse analysis was performed in patients with different
disease outcomes but comparable numbers of IFN-γ producing
CD8+ T cells following HCV peptide stimulation (e.g., patient
# 1 vs. # 7 in Supplementary Fig. 5). Moreover, when similar
frequencies of IFN-γ producing CD8+ T cells were detected after
overnight stimulation of individual patients lymphocyte samples
with control and HCV-specific peptides, a better metabolic
performance was again detected in control compared to HCV
peptide-stimulated cells (e.g., patient #1 in Supplementary Fig. 5).
Finally, when tested with graded frequencies of FLU matrix
58-66-specific CD8+ T cells, Seahorse sensitivity appeared to be
sufficient to detect metabolic differences down to frequencies
lower than 0.5% FLU-specific T cells with respect to total CD8+
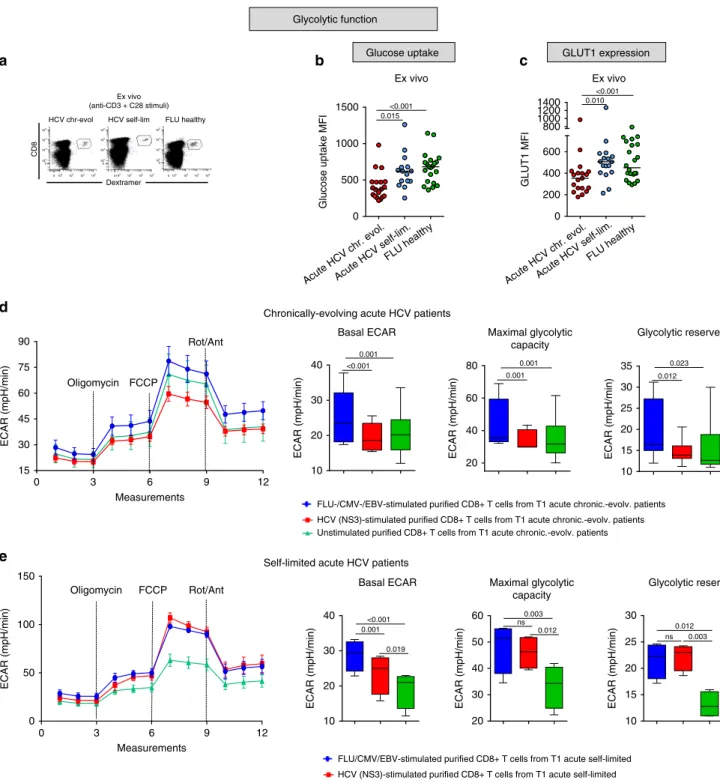
Fig. 1 Gene-expression profiling of virus-specific CD8+ T cells in HCV infection. a Principal-component analysis (PCA) of 4766 differentially expressed genes (DEGs) identified by ANOVA (q-value ≤ 0.05) in HCV-specific CD8+ T cells from patients with acute (n = 13), chronic (n = 7) and resolved (n = 4) HCV infections, as well as FLU-specific CD8+ T cells from healthy controls (n = 5). Data were normalized with the quantile method and filtered for probes detected in at least two-third of replicates for each condition.b Hierarchical-clustering representation of the 4766 DEGs. Data were median-normalized before clustering and expressed as single patient profiling. In red upregulated and in blue downregulated genes. c Transcriptome profiles of HCV-specific CD8+ T cells from chronically evolving and self-limited acute patients were compared by topological analysis at two different time-points (time of diagnosis/T1 and several months later/T2). Twenty-nine and 277 pathways were significantly dysregulated (Benjamini-Hochberg corrected q-value ≤ 0.05) at the T1/early and T2/late time-points, respectively. Venn-diagram distribution of pathways identified as dysregulated by comparative topological analysis of acute chronically-evolving vs. self-limited and chronic vs. resolved patients. The 15 pathways found to be significantly dysregulated in both comparisons, but with a largely predominant trend toward upregulation (red) at T1/early and the opposite trend (blue) at T2/late, are listed in the bottom panel; these include genes related to TCR signaling, DNA damage response and metabolism at the T1 comparison (each column shows the enrichment in upregulated or downregulated genes in each pathway derived from the calculation of the median gene expression fold change in the comparison of chronically evolving vs. self-limited–T1/early–and of late chronic vs. spontaneously resolved patients–T2/late). d List of the 14 T1/early-specific dysregulated pathways, half of which are upregulated (red), while the remaining half is downregulated (blue).e Heat-map of differentially expressed genes derived from GSEA (Molecular Signature Database, C2 canonical pathways and C5 gene ontology sets) at T1/early time-point, related to cell cycle, DNA damage/DNA repair, cell signaling, mitochondrion and metabolism. Upregulated genes in red; downregulated genes in blue.
Dextramer
CD8
HCV chr-evol HCV self-lim FLU healthy
a
Glucose uptake MFI
b
GLUT1 MFI
Ex vivo
c
Basal ECAR Maximal glycolytic
capacity
Glycolytic reserve
ECAR (mpH/min) ECAR (mpH/min) ECAR (mpH/min)
ECAR (mpH/min) 0 3 6 9 12 15 30 45 60 75 90 Oligomycin FCCP Rot/Ant Measurements Glycolytic function
Glucose uptake GLUT1 expression
Ex vivo (anti-CD3 + C28 stimuli)
Ex vivo
FLU-/CMV-/EBV-stimulated purified CD8+ T cells from T1 acute chronic.-evolv. patients HCV (NS3)-stimulated purified CD8+ T cells from T1 acute chronic.-evolv. patients Unstimulated purified CD8+ T cells from T1 acute chronic.-evolv. patients
0 500
Acute HCV chr. evol.Acute HCV self-lim. FLU healthy
Acute HCV chr. evol.Acute HCV self-lim. FLU healthy 1000 1500 0.015 <0.001 0 200 400 600 800 1000 1200 1400 0.010 <0.001 Oligomycin FCCP Rot/Ant
d
Measurements 0 3 6 9 12 0 50 100 150 ECAR (mpH/min)FLU/CMV/EBV-stimulated purified CD8+ T cells from T1 acute self-limited HCV (NS3)-stimulated purified CD8+ T cells from T1 acute self-limited Unstimulated purified CD8+ T cells from T1 acute self-limited
e
Chronically-evolving acute HCV patients
Self-limited acute HCV patients
0.001 0.001 0.023 10 20 30 40 <0.001 20 40 60 80 0.001 10 15 20 25 30 35 0.012 10 20 30 40 <0.001 0.001 0.019
Basal ECAR Maximal glycolytic capacity ECAR (mpH/min) 20 30 40 50 60 0.003 ns 0.012 0.012 ns 0.003 ECAR (mpH/min) 10 15 20 25 30 Glycolytic reserve ECAR (mpH/min) 105 104 103 102 102 103 104 105 0 0 105 104 103 102 102 103 104 105 0 0 105 104 103 102 102 103 104 105 0 0
Fig. 2 Glucose metabolism is impaired in HCV-specific CD8+ T cells from chronically evolving acute patients. a Representative examples of virus-specific CD8+ T cells stained with HLA-A2+ dextramers ex vivo after overnight anti-CD3/anti-CD28 stimulation. Glucose uptake (b), measured by the incorporation of the glucose analog 2-NBDG (MFI), and Glut1 expression levels (c) in virus-specific CD8+ T cells from T1/early HCV patients and healthy controls stimulated as ina. Data are presented as medianfluorescence intensity (MFI) values; median values are indicated by horizontal lines. Different numbers of patients (represented by individual dots) were tested in each assay depending on dextramer-positive cell frequencies.b–c Differences between multiple groups were evaluated with the non-parametric Kruskal-Wallis test;p-values were corrected for pairwise multiple comparisons with the Dunn’s test.d metabolicflux profiling of purified CD8+ T cells from 6 T1/early chronically-evolving (acute) patients. Cells were stimulated overnight with either HCV-NS3 (red) or control (FLU-specific, CMV-specific and EBV-specific) peptides (blue), or were not stimulated (green). The extracellular acidification rate (ECAR) was measured in real-time ex vivo before (basal level) and after oligomycin treatment in order to determine the maximum glycolytic capacity (MGC) and glycolytic reserve (difference between MGC and baseline ECAR) (see Methods section for details on Seahorse analysis).e Metabolicflux profiling of purified CD8+ T cells from T1/early self-limited (acute) patients (n = 4) stimulated overnight as in d. ECAR, maximum glycolytic capacity and glycolytic reserve were measured as ind. In d and e, ECAR values are given as the mean ± SD in the left-side and are presented as box-and-whisker plots (with median and 5–95 percentile) in the right-side. d–e Statistical analysis was performed with the Friedman test to compare different stimuli; p-values have been corrected for pair-wise multiple comparisons with the Conover’s test.
T cells, which are comparable to, or even lower than, the
frequencies typically found in our acute HCV patients cohorts
(data not shown).
p53 drives early metabolic dysregulation in HCV-speci
fic
CD8+ T cells. We then sought to elucidate the mechanisms
responsible for glycolytic impairment and the functionally
inef-fective transcriptional upregulation of OXPHOS genes. To this
end, we extracted a list of candidate regulatory genes (i.e., genes
upregulated in at least
five of the eight functional categories
reported in Supplementary Fig. 2; see also the T1 sheets in
Sup-plementary Data 2) and performed a mutual interaction
rela-tionship analysis. As shown by the interaction map in Fig.
4
a, p53
(also known as TP53), a known negative regulator of glycolysis
and an enhancer of OXPHOS
30,31, was central to this network of
dysregulated genes. p53 upregulation, as well as enhanced
expression of its phospho-activated (p-Ser15) form in
HCV-specific CD8+ T cells from T1/early chronic compared to T1/
early self-limited patients were confirmed at the protein level
a
b
% Depolarized Dextr+ CD8+ cells (anti-CD3 CD28 stimulated– unstimulated cells)
Ex vivo JC1 staining Maximal respiration Basal OCR OCR (pmol/min) ATP production OCR (pmol/min) OCR (pmol/min) OCR (pmol/min) 0 3 6 9 12 10 20 30 40 50 60 100 200 300 Oligomycin FCCP Rot/Ant Measurements Fold change anti-CD3 CD28 stimulated/
unstimulated Ex vivo Mitochondrial ROS (mitosox) DHE MFI Cytoplasmic ROS (DHE) H2DCFDA MFI Cytoplasmic H2O2 (H2DCFDA) Ex vivo Ex vivo 0 2000 4000 6000 ns ns 0 200 400 600 800 0.052 0.5 1.0 1.5 2.0 2.5 3.0 0.002 <0.001
FLU-/CMV-/EBV-stimulated purified CD8+ T cells from T1 acute chronic.-evolv. patients
HCV (NS3)-stimulated purified CD8+ T cells from T1 acute chronic.-evolv. patients
Unstimulated purified CD8+ T cells from T1 acute chronic.-evolv. patients Proton leak OCR (pmol/min) Spare respiratory capacity (%) Coupling efficiency (%) Spare respiratory
capacity Coupling efficiency
–20
Acute HCV chr. evol.Acute HCV self-lim. FLU healthy
Acute HCV chr. evol.Acute HCV self-lim. FLU healthy
Acute HCV chr. evol.Acute HCV self-lim. FLU healthy
Acute HCV chr. evol.Acute HCV self-lim. FLU healthy –10 0 10 20 30 0.018 0.001 Oligomycin FCCP Rot/Ant Measurements 0 3 6 9 12 0 200 400 600 OCR (pmol/min)
c
d
e
Mitochondrial functionFLU-/CMV-/EBV-stimulated purified CD8+ T cells from T1 acute self-limited patients
HCV (NS3)-stimulated purified CD8+ T cells from T1 acute self-limited patients
Unstimulated purified CD8+ T cells from T1 acute self-limited patients
Chronically evolving acute HCV patients
Self-limited acute HCV patients
0.008 0.001 Spare respiratory capacity (%) Spare respiratory capacity Proton leak 0.032 ns ns ns ns ns CouplIng efficiency (%) Coupling efficiency 0.038 15 30 45 0.008 15 20 25 30 35 0.001 –2 0 2 4 6 8 10 0.001 0.001 80 160 240 320 400 <0.001 400 600 800 1000 0.004 0.034 70 80 90 100 110 120 0.012 0.023 15 30 45 60 ns ns ns Basal OCR OCR (pmol/min) 0.010 ns 0.010 20 30 40 50 ATP production OCR (pmol/min) 0 5 10 15 100 200 300 400 500 600 ns 0.003 0.012 Maximal respiration OCR (pmol/min) 600 800 1000 1200 <0.001<0.001 <0.001 70 80 90 100 OCR (pmol/min) 0.038 ns
(Fig.
4
b, c). The Ataxia Telangiectasia Mutated (ATM) kinase, an
upstream regulator of p53
32,33, was also upregulated in T1/early
chronically evolving patients (Supplementary Data 1 and 2) and
the phospho-activated (p-Ser1981) ATM protein was significantly
increased in CD8+ T cells from T1/early chronic compared to
T1/early self-limited HCV patients (Fig.
4
d). ATM is responsible
for the AMP-activated protein kinase (AMPK)-dependent
acti-vation of the stress-sensor MAPK p38a
34,35. Interestingly, p38a
(also known as MAPK14) and the AMPK subunits PRKAA1,
PRKAB1 and PRKAG1 were also upregulated at the
transcrip-tional level (Supplementary Data 1 and 2) and increased levels of
the phospho-activated (p-Thr180) form of p38a were detected in
CD8+ T cells from T1/early chronically evolving HCV patients
(Fig.
4
e).
ATM is activated by DNA damage, ROS overproduction and
oxidative stress
36,37. Notably, treatment with the ROS scavenger
resveratrol
38,39resulted in a reduction of mitochondrial reactive
oxygen species, which was accompanied by a significant decrease
of phospho-ATM and a smaller reduction of phosho-p53 and
phospho-p38a (Fig.
5
a). Similar results were obtained with the
antioxidant N-acetyl-L-cysteine (NAC) in a smaller cohort of
patients (data not shown). Conversely, no significant
phospho-ATM decrease was observed when resveratrol was applied
to CD8+ T cells from T1/early chronically-evolving patients
stimulated with control viral peptides (Supplementary Fig. 6a).
To further probe the signal transduction network operating in
T1/early-exhausted HCV-specific CD8+ T cells, we assessed the
effect of different chemical inhibitors targeting ATM, p53,
AMPK, and p38 on the metabolic profile and anti-viral function
of CD8+ T cells (see Methods section for details). ATM, p53, and
p38a blockade strongly increased GLUT1 expression and glucose
uptake capacity, whereas a smaller effect was elicited by AMPK
inhibition (Fig.
5
b, c). Treatment with ATM, p53 and p38a
inhibitors also reduced PD-1 levels (Fig.
5
d), suggesting that PD-1
expression can be at least partially modified at an early stage of
chronically evolving infection.
Interestingly, treatment with specific transducer inhibitors
also enhanced the antiviral capacity of HCV-specific CD8+
T cells from T1/early chronically evolving patients, as revealed
by the increased cytokine (IFN-γ, TNF-α, and IL-2) production
observed in both ex vivo (Fig.
5
e) and post 10-day culture
(Fig.
5
f). Instead, only a modest effect was induced by the
same inhibitors on FLU-stimulated, CMV-stimulated, or EBV
peptide-stimulated PBMC from T1/early chronically-evolving
patients (Supplementary Fig. 6b–e), as well as on
NS3-HCV-peptide-stimulated PBMC from T1/early patients with an acute
self-limited infection (Supplementary Fig. 7a, b). The above data
suggest that transducer inhibitors may represent promising
therapeutic tools to prevent progression and worsening of T cell
exhaustion.
Global transcriptional repression in T2/late HCV-speci
fic
CD8+ T cells. To delineate the dysfunctional features of the
T2/late-chronic stage, we focused on the comparison between
HCV-specific CD8+ T cells from established chronic and
late-resolved patients. Most functional categories identified as
dysre-gulated in the T2/late stage by GSEA were downredysre-gulated, as
indicated by the negative Normalized Enrichment Score (NES)
values reported in Supplementary Data 2 (T2 sheets). Gene sets
significantly enriched at both T1/early and T2/late time-points
but oppositely regulated (i.e., upregulated at T1 and
down-regulated at T2) are outlined in Fig.
6
a. T2/late-downregulated
gene sets include genes coding for genome safeguard, cell cycle/
checkpoint regulation, proteasomal degradation, mitochondrial
metabolism and OXPHOS components, as well as multiple signal
transducers acting downstream to TCR activation (Fig.
6
a, b and
T2 Sheets in Supplementary Data 2). qPCR validation, applied to
the comparison of T2/late-chronic vs. resolved HCV patients and
healthy FLU controls, confirmed the expression trends revealed
by microarray analysis for a subset of T cell effector (e.g., ZAP70,
LAT, AKT1, and Tbet, also known asTBX21) and regulator genes
(e.g., ADCY4, BATF), whereas basal expression levels or a weak
upregulation were observed for the TCR regulators PD-1 and
CTLA-4, respectively (Supplementary Fig. 8)
4,40,41. To further
investigate these signaling pathways at the protein level, all
patient categories were analyzed longitudinally (see
Supplemen-tary Fig. 9). Phosphorylated-ATM levels did not change in CD8+
T cells from T2/late chronic patients (Supplementary Fig. 9a),
whereas total p53 levels increased in T2/late chronic compared to
T2/late resolved patients and healthy controls (Supplementary
Fig. 9b, on the left). In contrast, we did not observe any significant
increase in Ser15 phosphorylated p53 levels (Supplementary
Fig. 9b, lower graph), as it may be expected considering that
phosphorylation at this position is mediated by the ATM, ATR,
and AMPK kinases, all of which are transcriptionally
down-regulated in T2/late chronic patients (see T2 sheets in
Supple-mentary Data 2). However, since p53 can be phosphorylated by
other protein kinases at different sites
42—e.g., Ser46
phosphor-ylation by p38, whose phosphorylated form did not change
appreciably between T2/late chronic and resolved patients
(Sup-plementary Fig. 9c)—we cannot conclude that p53-dependent
signaling is necessarily depressed.
Fig. 3 Mitochondrial metabolism is impaired in HCV-specific CD8+ T cells from chronically evolving acute patients. a Percentage of mitochondrial depolarized virus-specific CD8+ T cells, detected with HLA-A2+ dextramers ex vivo after overnight anti-CD3/anti-CD28 stimulation, by staining with the mitochondrial membrane potential (MMP) sensitive dye JC-1 (see Methods section for details). Dextramer-positive virus-specific depolarized cells were quantified by subtracting the percentage of FL1high/FL2low cells (JC-1 staining) detected in the unstimulated samples from the percentage of the corresponding cellular subsets detected in the stimulated samples, as previously reported23.b Mitochondrial superoxide levels determined ex vivo as in a with the MitoSOX Red dye.c Cytoplasmic reactive oxygen species (ROS) determined ex vivo, as in a, with the superoxide-specific dye DHE and the intracellular H2O2specific dye H2DCFDA are shown on the left and on the right, respectively. a–c Data are presented as median fluorescence intensity
(MFI) values; median values are indicated by horizontal lines. Different numbers of patients (represented by individual dots) were tested in each assay depending on dextramer-positive cell frequencies.a–c Differences between multiple groups were evaluated with the non-parametric Kruskal-Wallis test; p-values were corrected for pairwise multiple comparisons with the Dunn’s test. d Oxygen consumption rate (OCR) data determined on the same samples (n = 6 T1/early chronically evolving acute patients) utilized for ECAR analysis (see Fig.2d) before (basal level) and after addition of the mitochondrial stressors oligomycin, FCCP and rotenone/antimycin A, which were used to calculate ATP production, maximal respiration capacity, spare respiratory capacity, coupling efficiency and proton leak, as indicated. e, OCR, ATP production, maximal respiration capacity and spare respiratory capacity were determined on the same samples (n = 4 T1/early self-limited acute patients) utilized for ECAR analysis in Fig.2e, and were calculated as ind. In d and e, OCR values are given as the mean ± SD in the left-side and are presented as box-and-whisker plots (with median and 5–95 percentile) in the right-side. d–e Statistical analysis was performed with the Friedman test to compare different stimuli; p-values have been corrected for pair-wise multiple comparisons with the Conover’s test.
Furthermore, a significant reduction of mitochondrial
polarization (Fig.
6
c, left panel) and a marked accumulation
of proteasome-undegraded aggregated proteins (Fig.
6
c, right
panel) were detected ex vivo in HCV-specific CD8+ T cells
from T2/late chronic compared to T2/late resolved patients
and healthy controls. Further investigation of cellular
metabo-lism at the T1 and T2 time-points, revealed sustained glucose
uptake and GLUT1 expression levels in T2/late chronic patients
(Supplementary Fig. 10a), associated with elevated PD-1
protein expression (Supplementary Fig. 10b), dysfunctional
mitochondria and excess mitochondrial (but not cytoplasmic)
ROS levels (Supplementary Fig. 10c, d). Mitochondrial defects
were already evident in the T1/early acute phase of chronically
evolving infection (Supplementary Fig. 10c). Proteasomal
dysfunction, instead, was not detectable in the same group
of T1/early chronically evolving patients at the T1 time-point
b
Cellular response to DNA damage stimulus Cellular response to stress
Mitochondrial DNA metabolic process Regulation of cell cycle Cellular senescence
Cellular response to glucose starvation Negative regulation of transcription from RNA polymerase II promoter
c
p53 MFI Total p53 Unstimulated samplesa
100Acute HCV chr. evol.Acute HCV self-lim.
FLU healthy
Acute HCV chr. evol.Acute HCV self-lim.
FLU healthy
Acute HCV chr. evol.Acute HCV self-lim.
FLU healthy
Acute HCV chr. evol.Acute HCV self-lim.
FLU healthy
Acute HCV chr. evol.Acute HCV self-lim.
FLU healthy
Acute HCV chr. evol.Acute HCV self-lim.
FLU healthy
Acute HCV chr. evol.Acute HCV self-lim.
FLU healthy
Acute HCV chr. evol.Acute HCV self-lim.
FLU healthy
Acute HCV chr. evol.Acute HCV self-lim.
FLU healthy
Acute HCV chr. evol.Acute HCV self-lim.
FLU healthy 200 300 400 500 0.003 0.003 Anti-CD3/CD28 stimulated samples Ratio stimulated vs unstimulated 0.5 1.0 1.5 2.0 2.5 0.007 ns 1.0 1.5 2.0 0.002 0.011 0.8 1.6 2.4 0.003 0.007 100 200 300 400 0.011 0.002 p-p38 MFI 400 600 800 1000 1200 0.019 <0.001 p-p53 MFI p-ATM MFI 1000 2000 3000 4000 0.013 0.062 100 200 300 400 0.001 0.001 0 500 1000 1500 2000 0.003 0.016 2000 4000 6000 <0.001 0.011 pATM p-p53 p-p38
d
e
p53 p-ATM p-ATM p-p53 p-p53 p-p38 p-p38Fold change stimulated/unstimulated
dextramer+ CD8+ T cells (MFI)
Fold change stimulated/unstimulated
dextramer+ CD8+ T cells (MFI)
Fold change stimulated/unstimulated
dextramer+ CD8+ T cells (MFI)
102 103 104 102 103 104 0 104 105 102 103 104 0 104 105 102 101 103 104 102 101 103 104
(Supplementary Fig. 10e, red circles), in accordance with
transcriptome data indicating a strong upregulation of
protea-somal subunits genes at this stage of infection (Fig.
6
a,
Supplementary Fig. 2 and T1 sheets in Supplementary Data 2).
Taken together these results indicate that mitochondrial and
proteasomal functions, despite their divergent behavior in the
early phase of infection (T1), are profoundly impaired in
HCV-specific CD8+ T cells from T2/ chronic patients.
Epigenetic repressive mechanisms in fully exhausted
HCV-specific CD8+ T cells. To explain the massive transcriptional
downregulation that accompanies and likely contributes to the
chronic outcome of HCV infection, we hypothesized the
invol-vement of chromatin-based silencing mechanisms. To test this
hypothesis, we used the EpiFactors database of epigenetic
reg-ulators
43as a reference to interrogate the T1/early and the T2/late
transcriptome datasets for dysregulated chromatin modifiers.
Genes comprised in the histone H2A/H2B deubiquitination
(DUB) and the histone methyltransferases (HMT) complex
denominations were consistently upregulated in chronic patients
compared to resolvers and healthy controls (Fig.
6
d). We focused
on the HMTs G9a (also known as EHMT2), which methylates
lysine 9 of histone 3, and EZH2, which methylates lysine 27 of
histone 3, because of their repressive effects
44–46. As shown in
Fig.
6
e, significantly higher levels of H3 K9 di-methylation were
detected in HCV-specific CD8+ T cells from T2/late chronic
patients compared to T2/late resolvers and healthy controls.
Interestingly, under the same short-term culture conditions, H3
K9 di-acetylation, which marks relaxed, transcriptionally active
chromatin and is mutually exclusive with the repressive H3
K27me3 mark, displayed an opposite behavior, being significantly
more represented in CD8+ T cells from T2/late resolvers and
healthy controls compared to T2/late chronic patients (Fig.
6
e).
Interestingly, repressive chromatin marks were already detectable
in the early phase (T1) of chronically evolving infections
com-pared to healthy controls (Supplementary Fig. 10f).
To further investigate the relationship between repressive
histone methylation and T cell functionality, we used four
different inhibitors to selectively target the T2/late-chronic phase
upregulated HMTs G9a (UNC0638 and BIX01294) and EZH2
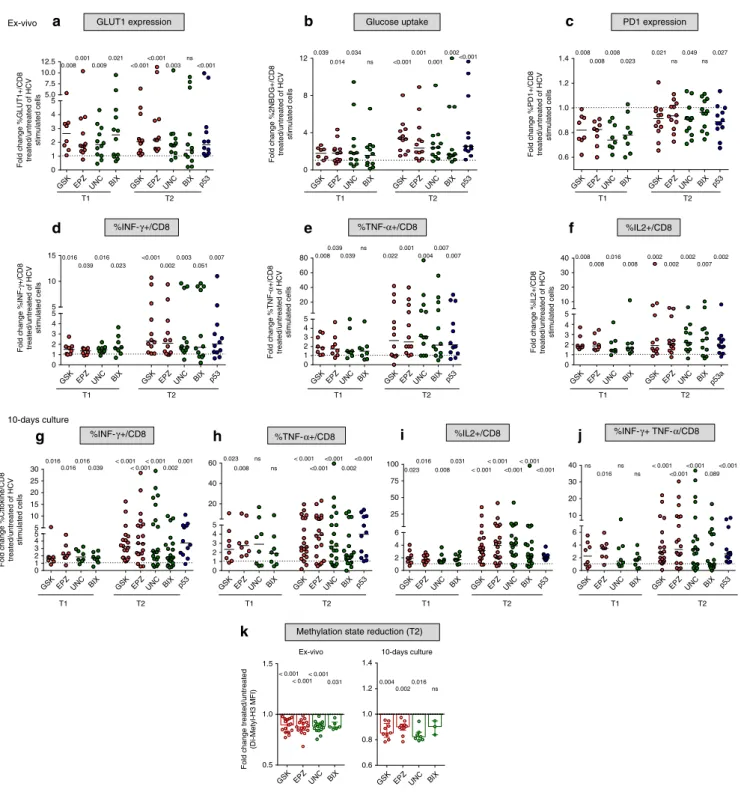
(GSK126 and EPZ005687). Treatment with HMT inhibitors
increased GLUT1 levels and glucose import in HCV
peptide-stimulated PBMC from T2/late chronic patients (Fig.
7
a, b). HMT
inhibitors also reduced PD-1 expression levels in T1/early but less
efficiently in T2/late HCV-specific CD8+ T cells (Fig.
7
c).
Moreover, the number of single-positive and double-positive
IFN-γ/TNF-α-producing CD8+ T cells was markedly increased
by HMT inhibitor treatment upon peptide stimulation both
ex vivo (Fig.
7
d–f) and after short-term culture (Fig.
7
g–j and
Supplementary Fig. 11), with a particularly significant effect
on T2/late-chronic CD8+ T cells. As shown by the increased
frequency of HCV dextramer-positive CD8+ T cells upon
stimulation with HLA-A2 restricted peptides, HMT inhibitors,
which caused a reduction of H3 K9 di-methylation detectable
both ex vivo and after 10 days of culture in CD8+ T cells from
T2/late chronic patients (Fig.
7
k), also improved the expansion
capacity of these late-exhausted cells (Supplementary Fig. 12).
This effect was appreciably more potent on T2/late exhausted
specific CD8+ T cells than on fully functional
HCV-specific CD8+ T cells from T2/late resolved patients
(Supple-mentary Fig. 13a) and functional CD8+ T cells of different
virus-specificities (FLU, CMV, EBV in Supplementary Fig. 13b).
Given the persistent upregulation of p53 throughout the
different phases of HCV infection, the effect of p53 inhibition on
cytokine production, glucose uptake and PD-1 expression levels
was also tested on T2/late chronic HCV-specific CD8+ T cells. As
in the case of HMT inhibitors, all the tested parameters were
positively affected by p53 blockade, with an increase in glucose
uptake, a decline of PD-1 levels and an increased cytokine
production (Fig.
7
b, c, d–j, blue dots and Supplementary Fig. 11),
thus pointing again to a key role of p53 as a central regulator of T
cell exhaustion.
CD8
+ T cell function in DAA-treated chronic hepatitis C
patients. We
finally asked if and to what extent HCV replication
blockade and antigen decline may affect the metabolic and
epi-genetic dysregulation marks documented in CD8+ T cells from
T2/late chronic patients. To address this question, we investigated
glucose import, mitochondrial depolarization, PD-1 expression,
proteasomal activity and repressive histone methylation in CD8+
T cells from T2/late chronic patients treated with direct acting
antivirals (DAA; see Supplementary Data 3a, b). After HCV
clearance, glucose import was significantly reduced (Fig.
8
a), even
though it did not reach the levels found in spontaneous resolvers.
Mitochondrial depolarization declined in T2/late HCV-specific
CD8+ T cells from some but not all patients at the
end-of-therapy (EOT) (Fig.
8
a), with a behavior similar to what we
observed in the case of PD-1 expression levels (Fig.
8
a). This
contrasts with the recovery of proteasomal function revealed by
the significant reduction in unfolded protein aggregates (Fig.
8
a).
Variable results were obtained with the repressive H3K9me2
mark, which at EOT remained higher than in spontaneous T2/
late resolvers and healthy controls (Fig.
8
a).
We also compared the effect of histone methylation and p53
inhibition on the antiviral activity of CD8+ T cells from T2/late
chronic patients before and after DAA therapy (see
Supplemen-tary Data 3a, b). Treatment with p53 and HMTs inhibitors
(pifithrin-alfa for p53, GSK126 and EPZ005687 for EZH2,
Fig. 4 ATM and p53 pathways are activated in T1/early HCV-specific CD8+ T cells. a Interaction network of genes involved in at least five of the eight dysregulated processes identified by GSEA (outlined in Supplementary Fig. 2). The network was generated using STRING v. 10.5. Node colors refer to enriched pathways associated with the proteins represented in the network. Line thickness indicates the degree of confidence prediction of the interactions. b Intracellular staining for total p53 of dextramer positive virus-specific CD8+ T cells from patients in the acute phase of HCV infection (chronically evolving T1/earlyn = 19 and HCV self-limited T1/early n = 14) or from healthy controls (n = 14), performed after overnight stimulation with anti-CD3/anti-CD28 (ex vivo staining).c Intracellular staining for phospho-p53 (Ser15) of dextramer positive virus-specific CD8+ T cells from PBMCs derived from patients in the acute phase of HCV infection or from healthy controls was performed with no stimulation and after overnight anti-CD3/anti-CD28 stimuli (left and middle panels, respectively). The plot on the right represents the ratio between anti-CD3/anti-CD28 stimulated and unstimulated virus-specific CD8+ T cells. d Intracellular staining for phospho-ATM (Ser1981) of dextramer positive virus-specific CD8+ T cells as in c. e Phospho-p38 (Thr180) intracellular staining of dextramer positive virus-specific CD8+ T cells as in c. Data in panels from b to e are presented as median fluorescence intensity (MFI), with median values indicated by horizontal lines. Different numbers of patients (represented by individual dots) were tested in each assay depending on dextramer-positive cell frequencies. Representative overlay histograms are shown next to each plot in panels fromb to e. All data were analyzed with the Kolmogorov-Smirnov test. Differences between multiple groups were evaluated with the nonparametric Kruskal-Wallis test;p-values were corrected for pairwise multiple comparisons with the Dunn’s test (JASP software).
UNC0638 and BIX01294 for G9a) markedly increased the
frequency of single-positive and double-positive
IFNγ/TNFα-producing CD8+ T cells upon peptide stimulation both ex vivo
(Fig.
8
b) and after 10 days of culture (Fig.
8
c). Conversely, the
same set of inhibitors had a modest effect when supplied after
therapy withdrawal (EOT), with a significant increase of anti-viral
cytokine production only observed after 10 days of culture but
not under ex vivo conditions (Fig.
8
b, c and Supplementary
Fig. 11).
Discussion
Knowledge of the molecular and cellular features of the T cell
responses associated with self-limited compared to persistent viral
CD8
a
Antioxidant treatment 0.6 0.8 1.0 1.2 0.033 Mitoch. ROS p-ATM p-p53 p-p38 0.031 ns ns Fold change MFI treated/untreatedb
c
d
0.0 0.5 1.0 1.5 <0.001 <0.001 0.039 <0.001 PD-1 expression Glucose uptake 0 1 2 3 4 5 20 40 60 0.003 <0.001 0.027 <0.001 Fold change %2NBDG+/CD8 treated/untreated GLUT1 expression 0 1 2 3 4 5 5 10 15 20 25 <0.001 <0.001 0.008 0.001 Fold change %GLUT1+/CD8 treated/untreated Fold change %PD1+/CD8 treated/untreated EX VIVO % IFN-γ/CD8 % TNF-α/CD8 % IL2/CD8e
Fold change %Cytokine/CD8 treated/untreated 0 2 4 6 8 0.006 0.001 0.008 <0.001 0.002 <0.001 0.002 0.002 <0.001 ns ns ns Inhibitors of Inhibitors ofInhibitors of Inhibitors of Inhibitors of
Inhibitors of 10-day culture
f
0 2 4 6 8 10 20 40 60 80 100 0.001 <0.001 <0.001 <0.001 0.001 <0.001 <0.001 0.004 <0.001 0.001 0.001 0.010 0.002 0.002 0.006 0.001 Fold change %Cytokine/CD8 treated/untreated% IFN-γ/CD8 % TNF-α/CD8 % IL2/CD8 % IFN-γTNF-α/CD8
Inhibitors of Inhibitors of Inhibitors of Inhibitors of
CD8 Untreated Treated Untreated Treated Untreated Treated Untreated Treated 6.34% 1.93% 2.46% 2.91% GLUT1 Untreated
ATM inhibitory treatment
AMPK inhibitory treatment
p53 inhibitory treatment p38 inhibitory treatment CD8 0.96% GLUT1 Mitosox CD8 p-ATM CD8 p-p53 CD8 p-p38 101 103 105 101 102 103 104 103 104 105 104 103 104 103 104 103 104 103 104 103 0 0 0 0 0 –1030 103 104 105 –103 0 103 104 105 –103 0 103 104 105 –103 0 103 104 105 –103 0 103 104 105 –103 0 104 105 ATM p53 AMPK p38 ATM p53 AMPK p38 ATM p53 AMPK p38 ATM p53
AMPK p38 ATM p53 AMPK p38 ATM p53 AMPK p38
ATM p53 AMPK p38 ATM p53 AMPK p38 ATM p53 AMPK p38 ATM p53 AMPK p38 –104 0
infections has greatly advanced in recent years
1,6,12,13,17,19.
However, our understanding of the regulatory mechanisms
responsible for these different outcomes remains largely
incom-plete, especially in the case of human infections
13,25. Here, we
combined transcriptome profiling, cell metabolic analyses and
selective targeting of newly identified dysregulated pathways, to
examine and compare the functional features of HCV-specific
CD8+ T cells at different time-points along the transition from
acute hepatitis to a resolved (memory T cell generation) or a
chronic (exhausted T cells) outcome of infection. Short-term
culture conditions in the presence of either HCV-specific peptides
or anti-CD23/anti-CD28 antibodies were set-up in order to
cir-cumvent the strong limitations inherent to the extremely low
frequency of HCV-specific CD8+ T cells. These conditions,
which differ from the much more prolonged stimulation
com-monly applied in human studies of virus-specific CD8+ T cells,
were also aimed to limit possible artifactual metabolic alterations
associated with long-term culture and in vitro expansion.
We found that a predominantly upregulated gene expression
profile marks HCV-specific CD8+ T cells committed to
exhaustion at early times of infection, in patients who will
ulti-mately develop chronic hepatitis C. However, this extensive
upregulation, which involves DNA damage stress responses and
multiple intracellular signaling pathways, including T cell
recep-tor downstream effecrecep-tors, the CD28-dependent PI3K/Akt
ana-bolic pathway and several mitochondrial components, does not
lead to an improved antiviral function but rather translates into a
deep functional impairment at both the energetic and metabolic
level. Such a dissociation between transcriptional and functional/
metabolic outputs was particularly evident for OXPHOS
impairment, which was associated with an altered MT membrane
potential and ROS accumulation.
While OXPHOS was transcriptionally upregulated but
func-tionally depressed, glucose utilization and related glycolytic
functions were downregulated at both the gene expression and the
functional level in T1/early chronic CD8+ T cells committed to
exhaustion. Reduced glycolytic activity and inefficient OXPHOS
have recently been reported for exhausted CD8+ T cells in the
mouse LCMV model of persistent viral infection
25. Thus, a
common metabolic alteration with divergent transcriptional and
functional responses likely reflecting a failed compensatory
attempt, is shared by exhausted CD8+ T cells across different
species. This profound metabolic derangement is expected to
impact on the capacity of T cells to express efficient anti-viral
effector functions
18–20and to generate protective memory
21,22suggesting that its selective targeting may provide new avenues for
novel rational therapeutic interventions.
p53 is known to negatively affect glycolysis and to promote
OXPHOS, thus resulting in ROS production
30,31. In the case of
prolonged stimulation and/or irreparable DNA damage, p53
activation induces a sustained pro-oxidative state that may result
in the repression of mitochondrial biogenesis and mitochondrial
dysfunction
30,31. Different lines of evidence point to p53 as a
highly plausible driver of the initial transition to the exhaustion
program in HCV infected patients. p53, which was found to be
upregulated at both the transcript and protein level (including its
phospho-activated form) in HCV-specific CD8+ T cells from
early-chronic patients, emerged as a central hub in the network
of regulatory genes retrieved from interaction analysis of our
transcriptome data. Indeed, p53 is modulated transcriptionally
by type I interferons (IFN)
31that are actively engaged in the
initial phase of HCV infection
47,48, as also indicated by the
multiple IFN-stimulated genes we found to be upregulated in T1/
early-exhausted HCV-specific CD8+ T cells. Notably, the DNA
damage sensor kinase ATM, which activates p53 by Ser15
phosphorylation, was also upregulated at the transcript and
protein level in T1/early exhaustion-committed CD8+ T cells.
Despite the present lack of direct supporting evidence, it is
con-ceivable to imagine that the DNA replication stress caused by
elevated viral loads and the resulting persistent TCR signaling are
responsible for ATM upregulation. Accordingly, transcripts
coding for T cell receptor downstream effectors, as well as cell
cycle machinery and DNA replication components were also
found to be upregulated in T1/early-exhausted HCV-specific
CD8+ T cells.
In addition to a role in the cellular metabolic homeostasis, p53
is primarily known to play a general role in promoting apoptosis
and permanently blocking cell proliferation under various stress
conditions
30. In our study, only a very limited proportion of
p53
highHCV-specific CD8+ T cells from chronically evolving
acute patients were found to be positive for Caspase 9, which has
been reported to play a major role in apoptosis induction in the
acute phase of HCV infection
49. Conversely, nearly half of the
p53
highHCV-specific CD8+ T cells in our study expressed the
anti-apoptotic BCL2 regulator at high levels (data not shown),
thus suggesting that only a minor fraction of the p53-positive
HCV-specific CD8+ T cell population we used for our functional
analyses was actually undergoing apoptosis. Moreover, the actual
amount of pre-apoptotic cells might have been further lowered by
overnight stimulation of dextramer-positive CD8 T cells with
anti-CD3 and anti-CD28 antibodies, a treatment that is expected
to drive apoptosis-committed T cells toward apoptotic death
50,51.
Altogether, the above data strongly suggest that the p53 increase
observed in chronically evolving HCV patients is related to less
conventional (e.g., metabolic adaptation) p53-mediated functions,
rather than to apoptosis promotion.
Importantly, a key role of p53 in the initial triggering of
exhaustion is also supported by the restoration of both metabolic
Fig. 5 Blocking dysregulated intracellular signaling pathways can reverse early metabolic and functional CD8+ T cell defects. a PBMC from T1/early chronically-evolving patients were stimulated overnight with HCV-NS3 peptides in the presence or absence of the ROS scavenger resveratrol38,39(treated vs. untreated) and then stained with MitoSOX Red to assess mitochondrial superoxide content and with anti-phospho-ATM (Ser1981), phospho-p38 (Thr180), and phospho-p53 (Ser15) antibodies. Bars represent mean fold-change values+ SEM derived from 6 patients. Representative overlay histograms are illustrated on the right.b PBMCs from T1/early chronically-evolving patients were stimulated for 40 h with HCV-NS3 peptides in the presence or absence of specific ATM (KU-55933), p53 (Pifithrin-α), AMPK (Dorsomorphin), and p38a (SB203580) inhibitors, followed by flow cytometry determination of GLUT-1 expression levels. Representative dot plots are illustrated on the right. Glucose uptake studied via incorporation of the glucose analog 2-NBDG (c) and PD-1 expression (d) have been measured as in b. e IFN-γ, TNF-α, and IL2 production by CD8+ T cells cultured as in b. Data are presented as the ratio between the percentage of cytokine positive CD8+ T cells detected in inhibitor-treated vs. untreated cultures (fold-change). f IFN-γ, TNF-α, IL2 single positive, as well as double-positive IFN-γ+/TNF-α+CD8+ T cells generated in short-term T cell lines upon 10-days stimulation with HCV-NS3 peptides in the presence or absence of the inhibitors specified in the legend to panel b. Data shown in all panels are presented as fold-change of treated vs. untreated CD8+ T cells. Horizontal lines in panels b to f represent median values; data were analyzed statistically with the Wilcoxon signed-rank test; NS= not significant.
and antiviral functions, and the concomitant reduction of PD-1
levels, elicited by treatment with a specific p53 inhibitor. A link
between p53 and immune-checkpoint regulators has recently
been described in human cancer cells, which respond to
geno-toxic stress and DNA damage via p53-dependent upregulation of
PD-1 and its PD-L1 ligand
52. The effect of p53 inhibition on PD-1
expression levels we observed in T1/early exhaustion-committed
HCV-specific CD8+ T cells, thus provides further support to the
existence of a regulatory link between p53 and PD-1, which may
play an as yet unappreciated role in T cell exhaustion. The
c
% Depolarized dextr+CD8+ cells (anti-CD3 CD28 stimulated –
unstimulated cells) MFI stim. – unstim. dextr+CD8+ cells
by proteostat staining
d
e
10-day culture
Ex vivo 10-day culture
Di-acetyl-H3 MFI
Di-metyl-H3 MFI Di-metyl-H3 MFI
Permissive mark H3K9ac2 Repressive mark
H3K9me2
Avg (log2FC)
APOB mRNA editosome CAF-1 CoREST CRREST-BRG1 DUB Exosome FACT HAT HDAC HMT Ino80 ISWI L3MBTL1 MLL PcG and PcG-like PP SRCAP SWI/SNF SWR –0.5 0 0.5 Mitochondrial function
(JC1 staining) Proteasomal function
a
DNA damage
DNA repair Metabolism Cell signaling
b
Chronic Resolved Chronic Resolved Chronic Resolved Signal –2 0 2 Category T1 up T2 downCell cycle regulation 246 61
Pathway names NES p value
p value p value p value p value p value FDR NES p value p value p value p value p value p value FDR Cell cycle checkpoints 1.84 <0.0001 0.017 –1.90 <0.0001 0.019 Cyclin E associated events during G1 S transition 2.00 <0.0001 0.012 –1.83 <0.0001 0.024 SCFSKP2 mediated degradation of P27 P21 2.05 <0.0001 0.008 –1.80 <0.0001 0.029
DNA repair/cell cycle maintenance 452 161
Pathway names NES FDR NES FDR
PID E2F pathway 1.60 0.006 0.077 –1.60 0.008 0.077
E2F mediated regulation of dna replication 1.78 0.006 0.024 –1.70 0.007 0.044 P53 dependent g1 dna damage response 1.76 <0.0001 0.029 –2.03 <0.0001 0.011 Regulation of apoptosis 1.69 <0.0001 0.041 –1.92 <0.0001 0.015
Mitochondrial function 321 333
Pathway names NES FDR NES FDR
Oxidative phosphorylation 1.71 <0.0001 0.037 –1.74 <0.0001 0.038 Mitochondrial protein import 1.75 <0.0001 0.029 –1.58 0.009 0.085 Respiratory electron transport 2.10 <0.0001 0.011 –2.04 <0.0001 0.014 TCA cycle and respiratory electron transport 1.94 <0.0001 0.009 –2.01 <0.0001 0.014
Ubiquitin proteasome system 316 244
Pathway names NES FDR NES FDR
Proteasome 1.84 <0.0001 0.017 –2.09 <0.0001 0.018 Antigen processing ubiquitination proteasome degradation 2.07 <0.0001 0.007 –1.98 <0.0001 0.013 Class I MHC mediated antigen processing presentation 1.95 <0.0001 0.009 –2.01 <0.0001 0.013 Unfolded protein response 1.78 <0.0001 0.026 –2.05 <0.0001 0.014
Signalling/T-cell activation 269 272
Pathway names NES FDR NES FDR
CDC42RAC pathway 1.59 0.016 0.084 –1.75 <0.0001 0.035 FAS pathway 1.82 0.002 0.019 –1.83 <0.0001 0.025 Adaptive immune system 1.76 <0.0001 0.028 –1.84 <0.0001 0.023 Signaling by the B cell receptor BCR 1.82 <0.0001 0.019 –1.72 <0.0001 0.042 Signaling by WNT 1.87 <0.0001 0.015 –1.90 <0.0001 0.019 TAK1 activates NFKB by phosphorylation and activation of IKKS complex 1.61 0.0162 0.073 –1.62 0.018 0.072 TCR signaling 1.73 <0.0001 0.034 –1.70 0.005 0.042
Transcription 232 219
Pathway names NES FDR NES FDR
Spliceosome 1.83 <0.0001 0.017 –1.97 <0.0001 0.012 MRNA processing 1.74 <0.0001 0.032 –1.86 <0.0001 0.021 RNA POL II transcription 1.94 <0.0001 0.009 –2.03 <0.0001 0.010 Transcription 1.80 <0.0001 0.022 –1.82 <0.0001 0.028
–15
HCV chronic (T2)HCV resolved (T2)FLU healthy HCV chronic (T2)HCV resolved (T2) FLU healthy HCV chronic (T2)HCV resolved (T2) FLU healthy HCV chronic (T2)HCV resolved (T2) FLU healthy HCV chronic (T2)HCV resolved (T2) FLU healthy
Acute HCV chr. evol./acute self-lim. (T1) HCV chronic/resolved (T2)HCV chronic/FLU healthy
–10 –5 0 5 10 15 < 0.001 0.001 –60 –30 0 30 60 80 100 120 0.007 0.011 0 500 1000 1500 2000 0.0110.003 0 500 1000 1500 2000 2500 0.019 0.005 200 400 600 800 1200 1600 0.020 <0.001
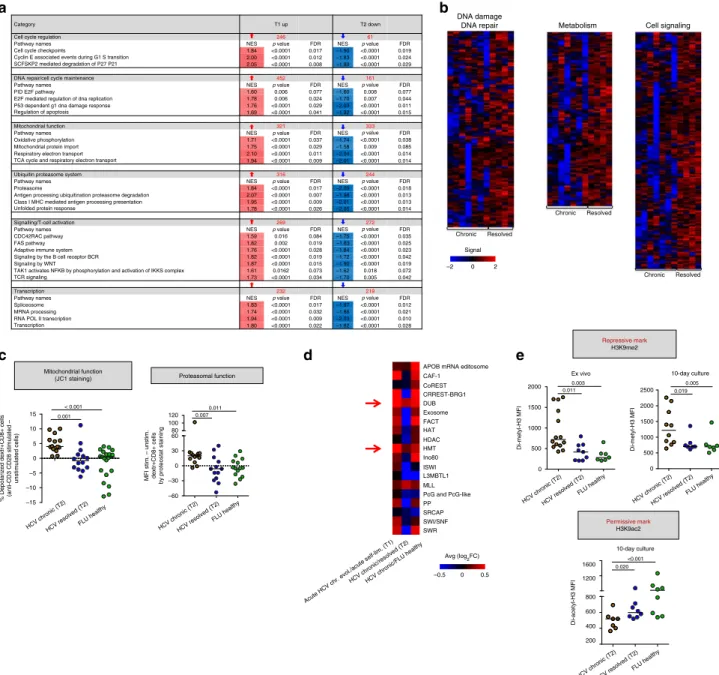
Fig. 6 Epigenetic transcriptional repression in exhausted HCV specific CD8+ T cells from chronic patients. a Six distinct functional groups of pathways enriched in upregulated genes (red) in T1/early and displaying the opposite trend (blue) in T2/late identified by GSEA (MSigDB, C2 canonical pathways and C5 Gene Ontology sets) in HCV-specific CD8+ T cells from chronically evolving patients. NES = normalized enrichment score; FDR = False Discovery Rate. In red, above thep-value columns, is shown the total number of genes significantly upregulated in T1/early and downregulated in T2/late in each group of pathways.b Heat-maps comparing the expression profiles of leading genes belonging to the DNA repair/damage response, metabolism and cell signaling pathways in chronic and resolved infections (see also the T2 sheets in Supplementary Data 2).c Mitochondrial (left panel, JC-1 staining) and proteasomal (right panel, ProteoStat staining) functions were assessed in dextramer-stained HCV-specific CD8+ T cells from T2/late chronic and T2/late self-limited HCV infection and in healthy controls following PBMC overnight stimulation with anti-CD3/CD28. MFI, Median Fluorescence Intensity.d Heat-map comparing the expression levels (average log2fold change) of epigenetic regulatory complexes (derived from the EpiFactors database as detailed in
Methods section) in chronic vs. self-limited infection (T1/early), chronic vs. resolved infection (T2/late) and chronic (T2/late) vs. healthy controls. e Repressive H3K9me2 (upper panels) and permissive H3K9ac2 (lower panel) histone marks determined byflow cytometry in dextramer-stained HCV specific CD8+ T cells from T2/late chronic and T2/late resolved HCV patients or healthy controls. PBMC were stimulated overnight with anti-CD3/CD28 (ex vivo staining) or for 10 days with HLA-A2-restricted HCV-specific or FLU-specific peptides. Horizontal lines in panels c and e represent median values. Differences between multiple groups in panelsc and e were evaluated with the non-parametric Kruskal-Wallis test;p-values were corrected for pairwise multiple comparisons with the Dunn’s test.