HAL Id: inserm-01284956
https://www.hal.inserm.fr/inserm-01284956
Submitted on 8 Mar 2016
HAL is a multi-disciplinary open access
archive for the deposit and dissemination of
sci-entific research documents, whether they are
pub-lished or not. The documents may come from
teaching and research institutions in France or
abroad, or from public or private research centers.
L’archive ouverte pluridisciplinaire HAL, est
destinée au dépôt et à la diffusion de documents
scientifiques de niveau recherche, publiés ou non,
émanant des établissements d’enseignement et de
recherche français ou étrangers, des laboratoires
publics ou privés.
Tulane Virus as a Potential Surrogate To Mimic
Norovirus Behavior in Oysters
Najoua Drouaz, Julien Schaeffer, Tibor Farkas, Jacques Le Pendu, Françoise
Le Guyader
To cite this version:
Najoua Drouaz, Julien Schaeffer, Tibor Farkas, Jacques Le Pendu, Françoise Le Guyader. Tulane
Virus as a Potential Surrogate To Mimic Norovirus Behavior in Oysters. Applied and Environmental
Microbiology, American Society for Microbiology, 2015, 81 (15), pp.5249. �10.1128/AEM.01067-15�.
�inserm-01284956�
in Oysters
Najoua Drouaz,aJulien Schaeffer,aTibor Farkas,bJacques Le Pendu,cFrançoise S. Le Guyadera
IFREMER, Laboratoire de Microbiologie, LSEM-SG2M, Nantes, Francea; Laboratory of Specialized Clinical Studies, Division of Infectious Diseases, Cincinnati Children’s Hospital Medical Center, Cincinnati, Ohio, USAb; INSERM, U892, CNRS, UMR6299, Université de Nantes, Nantes, Francec
Oyster contamination by noroviruses is an important health and economic problem. The present study aimed to compare the
behaviors of Norwalk virus (the prototype genogroup I norovirus) and two culturable viruses: Tulane virus and mengovirus.
After bioaccumulation, tissue distributions were quite similar for Norwalk virus and Tulane virus, with the majority of viral
par-ticles detected in digestive tissues, while mengovirus was detected in large amounts in the gills and mantle as well as in digestive
tissues. The levels of persistence of all three viruses over 8 days were comparable, but clear differences were observed over longer
periods, with Norwalk and Tulane viruses displaying rather similar half-lives, unlike mengovirus, which was cleared more
rap-idly. These results indicate that Tulane virus may be a good surrogate for studying norovirus behavior in oysters, and they
con-firm the prolonged persistence of Norwalk virus in oyster tissues.
S
hellfish are filter feeders that can accumulate different types of
pathogens from human fecal pollution and were identified as
vectors for human enteric pathogen transmission more than a
century ago. We have known for almost 40 years that bacteria and
viruses show differences in terms of concentration and
accumu-lation in and depuration from contaminated shellfish (
1
).
Nowa-days the problem of viral contamination has become dominant,
and over the last 10 years about 40% of RASFF (Rapid Alert
Sys-tem for Food and Feed) notifications are related to the detection of
norovirus (NoV) in oysters (
2
). Improvements in detection
meth-ods, increased epidemiological surveillance, and efforts by
author-ities to improve the quality of products put on the market have
contributed to better recognition of viral contamination. These
improvements have assisted in identifying that increases in
hu-man populations in coastal areas, as well as climate change,
induc-ing heavy rainfall and associated sewage overflows, constitute risk
factors for shellfish contamination (
3
,
4
).
Among human enteric viruses, NoVs are recognized as the
leading cause of epidemics and sporadic cases of gastroenteritis in
all age groups of humans (
5
,
6
). NoVs of human origin are
ex-creted in large quantities by ill people, but they may also be present
in asymptomatic, healthy individuals (
7
). As a consequence, they
are discharged in large numbers into sewage, and due to their
resistance to inactivation, they are frequently detected in
waste-water treatment plant effluent and in surface waste-waters (
8–10
).
Sew-age treatment which incorporates new technologies, such as
membrane filtration, contributes to decreasing the numbers of
microorganisms discharged into the coastal environment (
11
,
12
),
but this does not prevent accidental contamination. Depuration
of shellfish, which was developed to eliminate bacteria, does not
efficiently eliminate viruses that persist for several weeks or
months in bivalve tissues (
13
,
14
). As a consequence, in most cases
of contamination, the only risk management option to prevent
consumer infections is the closure of production areas, with viral
testing of shellfish to evaluate the level and type of contamination.
NoVs are nonenveloped, single-stranded, positive-sense RNA
viruses belonging to the Caliciviridae family. The short genome,
which is organized into three open reading frames (ORFs), is
highly variable (
15
). Importantly, NoVs were the first viruses for
which it was shown that there is genetic sensitivity to infection
through the recognition of histo-blood group antigens (HBGAs)
(
16
). HBGAs, which are complex glycans present on many cell
types, are synthesized from a series of precursor structures by
step-wise addition of monosaccharide units via a set of
glycosyltrans-ferases (
17
). Evidence accumulated from volunteer studies and
from analysis of outbreaks indicates that binding to these
carbo-hydrates is required for infection (
18
,
19
). Moreover, various
hu-man NoV strains that bind to HBGAs present distinct specificities
for HBGAs. As a result, most strains infect only a subset of the
population, based on HBGA expression (
20
,
21
).
Specific binding of NoVs to the oyster digestive tract through
an A-like carbohydrate structure (which is indistinguishable from
the human blood group A antigen) and other ligands has been
described (
22–24
). It was also demonstrated that these ligands
have an impact on bioaccumulation efficiency, and a seasonal
ef-fect was observed for some strains (
25
,
26
). A field study
con-firmed the preferential selection of genogroup I (GI) NoVs over
GII and GIII NoVs by Pacific oysters (
27
). These observations
suggest that oysters have the ability to specifically accumulate and
concentrate a human pathogen based on the presence of a shared
ligand between the two species rather than through nonspecific
interactions only (
28
). Since different NoV strains show different
specificities for HBGAs in humans, all strains may not be captured
equally well by oysters. We also hypothesize that such specific
ligands have an impact on NoV persistence in oysters.
Tulane virus (TV) is the prototype strain of the genus Recovirus
Received 1 April 2015 Accepted 20 May 2015 Accepted manuscript posted online 29 May 2015
Citation Drouaz N, Schaeffer J, Farkas T, Le Pendu J, Le Guyader FS. 2015. Tulane virus as a potential surrogate to mimic norovirus behavior in oysters. Appl Environ Microbiol 81:5249 –5256.doi:10.1128/AEM.01067-15.
Editor: K. E. Wommack
Address correspondence to Françoise S. Le Guyader, [email protected]. Copyright © 2015, American Society for Microbiology. All Rights Reserved.
(ReCV) within the Caliciviridae family. The ReCV genome is
or-ganized into three ORFs, like the genome of NoV, and also
exhib-its large genetic variability. Similar to the case for NoVs, the route
of ReCV transmission is fecal-oral, and ReCVs are shed in large
quantities in the stools of infected animals. Moreover, ReCVs also
recognize HBGAs and can be grown to high titers in cultured cells,
making them a valuable surrogate for the uncultivable human
NoVs (
29
). Considering these features, in this study, we selected
TV as a potential NoV surrogate and mengovirus (MgV) as a virus
control to investigate NoV persistence in oysters. MgV, a member
of the Picornaviridae family, is very stable in the environment, can
be propagated in cell culture, and recognizes some sialic acids on
red blood cells. This may contribute to the efficient
bioaccumula-tion of MgV in oysters, which are rich in sialic acid (
30–33
).
The objectives of the present study were to evaluate the
persis-tence of Norwalk virus (NV; the NoV GI prototype) in oysters and
to compare it with those of two potential surrogates: TV and MgV.
MATERIALS AND METHODS
Viruses and cell culture. TV strain M033 was propagated in confluent
monolayers of LLC-MK2 cells (ATCC CCL-7; ATCC, Manassas, VA) as previously described (34). MgV strain pMC0 (kindly provided by A. Bosch, University of Barcelona) was propagated in HeLa cells as previ-ously described (30). When cytopathic effects (CPE) were complete, cul-tures were frozen and then thawed (⫺20°C) three times, and cell debris was removed by centrifugation at 1,000⫻ g for 30 min. The supernatant, which contained viral particles, was stored at⫺80°C in aliquots.
Aliquots of a fecal sample containing the Norwalk virus 8FIIa strain (GI.1) were kept at⫺20°C.
Virus stability in seawater. One-milliliter samples of TV and MgV
were diluted in 9 ml of seawater and kept at 12°C. One-milliliter samples were collected at 1 h, day 1, and day 8.
Oysters. Live oysters (Crassostrea gigas) were purchased directly from
a producer. Environmental data were recorded, including water temper-ature and salinity. Upon arrival at the laboratory, oysters were immedi-ately rinsed and transferred to large seawater aquariums equipped with constant aeration. After 24 h of immersion at the designated temperature, oysters were individually checked, and only live oysters showing filtration activity were included in the experiments. Before all bioaccumulation experiments, oysters were tested for preexisting GI and GII NoVs, MgV, and TV.
Biometry parameters, such as total weight and flesh weight, were re-corded. In addition, for the virus persistence experiments, the dry weights of 30 individual oysters per aquarium (including the control aquarium) were measured on day 0, day 28, and day 56 (35).
Bioaccumulation experiments. Bioaccumulation of the three
differ-ent viruses was evaluated in both small and large batches, in separate aquariums. Natural seawater, collected from a single clean area in which turbidity and ammonium, nitrate, phosphate, and chlorophyll A concen-trations were measured (data not shown), was used for all bioaccumula-tion experiments.
Small-batch bioaccumulation experiments were conducted between January and April 2013, with the seawater temperature adjusted according to the season (8 to 10°C). Four aquariums were filled with 20 liters of seawater each, and 3 of them were seeded with the virus suspensions, at 7.2⫾ 0.5 log10RNA copies/aquarium for NV, 8.5⫾ 0.2 log10RNA copies/ aquarium for TV, and 9.1⫾ 0.4 log10RNA copies/aquarium for MgV. The remaining aquarium was not seeded and served as a control. Forty-five oysters were added to each aquarium, including the control one, yielding a ratio of 5 liters of water/kg of oysters (including the shell weight) (35). Fifteen oysters were collected from each aquarium at 1 and 24 h postseed-ing and were immediately dissected and frozen. At 24 h postseedpostseed-ing, the remaining oysters were transferred to clean aquariums, in which the
sea-water was changed daily for 8 days. The experiments for all viruses were conducted at the same time and were repeated five times.
Large-batch bioaccumulation experiments were conducted sepa-rately for each of the three viruses, using 500 to 600 oysters that were contaminated under the same conditions as those described for the small batches. After 24 h of bioaccumulation, virus concentrations were checked by randomly selecting and testing six oysters; if the con-centration was less than 5⫻ 104RNA copies/g digestive tissue (DT), more virus was added to the seawater (the amount added was esti-mated based on the concentration detected in DT), and bioaccumula-tion was continued for an addibioaccumula-tional 12 h.
Persistence experiments. Following bioaccumulation, the oysters
were rinsed and transported to an experimental farm located on the coast, with direct access to natural seawater and facilities to maintain oysters for prolonged periods. Oysters were placed in clean seawater in large tanks (500 liters) located in a temperature-controlled room (11⫾ 1°C) and supplied with constantly circulating (200 liters/h/tank) aerated and fil-tered natural seawater. Oysters were fed the phytoplankton Skeletonema costatum (about 1012cells/h/aquarium). Parameters such as temperature, salinity, and pH were routinely measured. Two control tanks, one with uncontaminated oysters and one without oysters, were included in all experiments.
Twenty to 30 oysters were collected for analysis weekly from each tank, for up to 8 weeks. During sampling, the tanks were cleaned and particles that had settled onto the bottom of the tanks were removed. Prior to release into the environment, seawater was treated according to the safety rules of the experimental farm (which included acidification, filtration, and UV treatment). These persistence experiments were repeated three times between 13 November 2013 and 4 April 2014.
Shellfish processing. Harvested oysters were shucked immediately
af-ter collection, and the oysaf-ter bodies were weighed. To avoid any delays or differences with subsequent assays, oysters were dissected at the same time for each virus treatment group, by different laboratory members. To de-termine viral distribution, the DT, gills, and mantle were collected from at least 10 oysters per assay. Corresponding tissues were pooled, finely chopped using a scalpel, and mixed before preparation of 1.5-g aliquots that were stored at⫺20°C. For the persistence studies, only DT were processed as described above.
Virus recovery. Samples of each tissue type were extracted together
(e.g., all gills together), and all tissues were extracted in triplicate as de-scribed previously (25,36). Briefly, MgV (2⫻ 106RNA copies) was added as an extraction efficiency control to each dissected tissue (1.5 g) before homogenization, except to oysters contaminated with MgV. Tissues were homogenized, extracted with equal volumes of chloroform-butanol for 30 s, and subjected to Cat-Floc T (173l per tube; Calgon, Ellwood City, PA) flocculation before centrifugation for 15 min at 13,500⫻ g. The resulting supernatant was precipitated with polyethylene glycol 6000 (PEG 6000) (Sigma, St. Quentin, France) for 1 h at 4°C and centrifuged for 20 min at 11,000⫻ g at 4°C as described previously (33).
NA extraction and purification. Nucleic acids (NAs) from oyster
samples and viral inocula, including cell culture supernatant and 10% stool suspensions, were extracted using a NucliSens extraction kit and an automatic easyMAG extractor (bioMérieux, Lyon, France) according to the manufacturer’s instructions, with minor modifications, as described previously (33). NAs were recovered in 100l of elution buffer (bioMéri-eux) and analyzed immediately or stored at⫺80°C.
Primers, probes, and rRT-PCR. For NoV and MgV, real-time reverse
transcription-PCR (rRT-PCR) was conducted as previously described (37). Primers TVIFf (5=-CTGGGATACCCACAACATC-3=) and TVIFr (5=-GCCAGTTAACAGCTTCAGC-3=) and probe TVIFp (6-carboxyflu orescein [FAM]-TGTGTGTGCCACTGGATAGCTAGCACC-BHQ) were used to amplify the region from nucleotides 3775 to 3884 of the TV ge-nome (GenBank accession numberEU391643.1).
rRT-PCR was carried out by using an UltraSense One-Step quantita-tive RT-PCR system (Life Technologies, France) with 5l of extracted NA
per well (in a 25-l reaction mixture) as described previously (33). Am-plifications were performed in an Mx3000P quantitative PCR (qPCR) system (Agilent Technologies, France). All samples were analyzed undi-luted and after 10-fold dilution. Undiundi-luted NA extracts were analyzed in triplicate.
rRT-PCR controls and quantification. Filter tips and dedicated
rooms were used to prevent sample contamination. Two negative controls (sterile, RNase-free water) were included in each amplification series.
(i) Extraction efficiency. MgV was used to evaluate the extraction
efficiency. The threshold cycle (CT) value for the undiluted samples (seeded with 2⫻ 106RNA copies of MgV) was compared to the C
Tvalue for the positive control used in the extraction series and to a standard curve made by endpoint dilution. The difference in CTvalues between the controls and samples (⌬CT) was used to determine the extraction effi-ciency, using the formula 100e⫺0.6978⌬CT, and the extraction efficiency was expressed as a percentage for each tissue. Only samples with extrac-tion efficiencies above 10% were considered for quantificaextrac-tion. Given that the oysters used in each experiment were from the same initial batch, the extraction efficiencies obtained for NoV, TV, and the negative control were used to estimate the extraction efficiency of oysters contaminated with MgV.
(ii) Quantification. The absence of inhibitors of virus detection (for
NV, TV, or MgV) was verified for each sample by comparing the CTvalues for undiluted and 10-fold-diluted extracts, which were corrected for the dilution factor by using the standard curve coefficient. A difference of⬍1 CTunit indicated the absence of significant inhibition, and all extracts were checked by using this control. In the virus persistence experiments, in which triplicate amplifications were performed, all CTvalues were com-pared. If a variation of⬎1 CTunit was observed, then the amplification was repeated. If the difference persisted (for concentrations close to the limit of quantification), this was considered in the quantification step. Otherwise, all three CTvalues were averaged. After these verification steps, the number of RNA copies in each positive sample was estimated by com-paring the CTvalue for the sample to standard curves derived from plas-mids containing nucleotides 146 to 6935 of Norwalk virus (GenBank ac-cession no.M87661), nucleotides 3300 to 4299 of Tulane virus M33 (GenBank accession no.EU391643.1), or nucleotides 209 to 1061 of men-govirus isolate M (GenBank accession no.L22089).
(iii) Standard curve validation. After completion of all rRT-PCR
runs, all standard curves for one virus were compared, and quality criteria were applied (38). Only standard curves with amplification efficiencies of 85 to 110% were kept. Average values were calculated for each point of the standard curves and were used to estimate the uncertainty of quantifica-tion for TV (0.21 log), NV (0.14 log), and MgV (0.14 log).
(iv) Quantification. The final concentration was then back calculated
based on the volume of NA and expressed per gram of tissue. Triplicate extractions were calculated separately, and then the geometric mean con-centration was calculated. rRT-PCR runs showing aberrant standard curves were checked to see if the CTvalues for the samples were compa-rable to those for other extractions from the same series (as all tissues were extracted three times). If the CTvalues were in the same range, the con-centration was calculated based on the average standard curve values. If not, the run was repeated.
Data calculation and statistical analysis. The geometric mean titer
(GMT) was calculated for each sample. For statistical analysis, the Mann-Whitney test was applied to assess the impact of feeding, and a nonlinear regression with a two-phase decay was used to calculate the half-life, using Prism 5 (GraphPad Software, Inc.).
RESULTS
Controls and bioaccumulation conditions. The stability of TV
and MgV in the seawater that was used for bioaccumulation was
verified in two separate experiments. Over 8 days, the variation
observed was 0.78
⫾ 0.9 C
Tunit for TV and 1.39
⫾ 0.54 C
Tunits
for MgV. The stability of NV was 0.43
⫾ 0.5 C
Tunit, as
deter-mined in our previous study (
26
).
Subsamples of the same stool suspension for NV or cell culture
supernatants for TV and MgV were frozen and used for the first
five experiments. Because of the differences observed in the
con-centrations of the different viruses (up to 2 log), new subsamples
were prepared for the three persistence experiments.
All experiments were performed during the colder months
(December to the beginning of April), using adult oysters of
com-mercial size. The allometric coefficient (body weight divided by
DT weight) was 14
⫾ 1.79 for oysters used in the six experiments
on tissue distribution and 15
⫾ 2.58 for the three experiments on
persistence. For the three persistence experiments, because the
oysters were fed plankton, oyster flesh weight was measured at the
beginning of the experiment (day 1), on day 28 (week 4), and on
day 56 (week 8). The body weight did not change for experiment 2
(4.9
⫾ 1.2, 5.6 ⫾ 1.3, and 5.3 ⫾ 1.5 g, respectively) or experiment
3 (4.5
⫾ 1, 5.4 ⫾ 1.2, and 4.8 ⫾ 1.2 g, respectively), but it changed
for experiment 1 (6.3
⫾ 1.3, 7.8 ⫾ 1.7, and 9.9 ⫾ 2, respectively).
The body weight increase during the last 3 weeks was correlated
with plankton feeding, which was accidentally increased for 10
days.
Tissue distribution. Five separate experiments were
per-formed to compare NV, TV, and MgV concentrations in the DT,
gills, and mantle following bioaccumulation periods of 1 and 24 h.
The extraction efficiencies were acceptable and varied from 13 to
19% for DT, 55 to 67% for gills, and 51 to 61% for mantles. For
comparison of the different viruses, the maximal theoretical
bio-accumulation (MTB) was calculated for each virus, using the
fol-lowing assumptions: (i) 1 log of virus would be lost (by adsorption
to aquarium walls, shell, etc.), as demonstrated using radioactive
virus (
39
); (ii) 90% of the viruses would be concentrated in the
DT, as observed during preliminary experiments and
demon-strated for norovirus and hepatitis A virus (HAV) (
40
); and (iii)
the level of bioaccumulation could be based on the weight of the
DT recovered. For example, for NV, the dose seeded in the
aquar-ium was 1.5
⫻ 10
7RNA copies, and 24 g of DT was recovered.
Therefore, 1.5
⫻ 10
6RNA copies were available for uptake
(as-suming a 1-log loss), of which 90% were assumed to be present in
the DT (1.35
⫻ 10
6). Considering the weight of the DT recovered
(24 g), this gave an MTB of 5.6
⫻ 10
4RNA copies/g of DT. The
MTB was calculated for each virus and was found to be 1.2
⫻ 10
6RNA copies/g of DT for TV and 5
⫻ 10
6RNA copies/g of DT for
MgV. These MTB values were useful for evaluating the efficiency
of bioaccumulation in the DT for each virus (
Table 1
). However,
as MgV is distributed equally in all tissues, the MTB for all tissues
(MBT-AT) was calculated by considering the loss of 1 log of virus
and then dividing this concentration by the total weight of the
oyster tissues (oyster weight without shell).
For greater confidence in quantification, all tissues were
ex-tracted three times in independent extraction runs, and all NA
extracts were amplified in duplicate; each data point represents a
total of 7 to 10 oysters. Results presented are based on the
geomet-ric mean concentrations obtained for five separate experiments
(each of which was quantified using three independent
concentra-tion values) (
Table 1
).
NV accumulated rapidly in the DT and in other tissues, such
as the gills and mantle, and it reached a concentration of about
100 copies/g after 1 h. After a bioaccumulation period of 24 h,
concentrations in the DT increased about 100 times, while they
decreased or remained stable in the other tissues, confirming
previous observations (
26
) (
Table 1
). Considering the MBT,
the bioaccumulation efficiency was about 1% after 1 h and
reached 25% after 24 h. With the assumption that NV is equally
distributed in all tissues, the bioaccumulation efficiency
reached 13% after 1 h and 350% after 24 h, confirming that NV
is indeed more concentrated in DT.
TV displayed slightly lower concentrations than those of NV
in all tissues after 1 h of bioaccumulation, but the results
showed that TV accumulated preferentially in DT. After 24 h,
TV concentrations increased in the three tissues, but to a larger
extent in the DT (the geometric mean concentration in the DT
was 10 times greater than the concentration detected in the
gills). Nevertheless, the bioaccumulation efficiency was poor
(0.5%), even after 24 h. If we considered that TV was equally
distributed in all tissues, the bioaccumulation efficiency reached 7%
(
Table 1
).
MgV was seeded at a higher concentration than those of the
other two viruses, which explains the higher concentrations
de-tected. However, the tissue distribution was clearly different from
that for NV or TV. Concentrations were comparable in all three
tissues analyzed after 1 h and increased in all tissues after 24 h. The
bioaccumulation efficiency was in the same range as that observed
for TV after 1 h and increased to 2% after 24 h. As MgV
concen-trations detected in the gills and mantle were in the same range as
concentrations recorded in the DT, we calculated the
bioaccumu-lation efficiency based on an equal distribution of MgV in all
tis-sues. In this case, the bioaccumulation efficiency was less than 1%
after 1 h and increased to 30% after 24 h.
Persistence over 8 days. The second step of this study was to
evaluate the persistence of these three viruses in the DT over 8
days. Two different approaches were undertaken: oysters were
kept in filtered seawater (with very low nutrient levels) or in
fil-tered seawater supplemented with phytoplankton. Experiments
were repeated five times for trials in which no food was added and
three times for those in which plankton was added. A statistical
difference was found for TV, with a more rapid decline in the
concentration in the DT when oysters were fed (P
⫽ 0.035) (
Table
2
). For both NV and MgV, the impact of feeding was not
signifi-cant over 8 days (P
⫽ 0.25 and P ⬎ 0.99, respectively).
Persistence over 2 months. Oysters contaminated with 4.58
⫾
0.42 log RNA copies/g DT for NV, 4.83
⫾ 0.23 for TV, and 5.18 ⫾
0.34 for MgV were relocated to a scientific farm to closely mimic
normal commercial environmental conditions, albeit in a secure
facility. Seawater entering the farm was filtered and was treated
following experiments to prevent contamination of the
environ-ment through seawater release. An uncontaminated batch of
oys-ters was added for each experiment and was analyzed every week.
None of the viruses were detected in the control oysters. Because
the seawater used was filtered, we added plankton at a
concentra-tion normally found in seawater to feed the oysters.
Unfortu-nately, during the first experiment, overfeeding occurred and led
to an increase in oyster weight. Nevertheless, this had no impact
on virus concentrations, and the results were comparable to those
of the other two experiments, even for TV, for which a statistical
difference was associated with feeding over 8 days.
NV concentrations decreased slowly in the DT and reached the
limit of quantification of the method by week 8 (1.85
⫾ 0.48 log
RNA copies/g DT) (
Fig. 1
). TV concentrations decreased faster,
with the limit of quantification being reached by week 5 (1.78
⫾
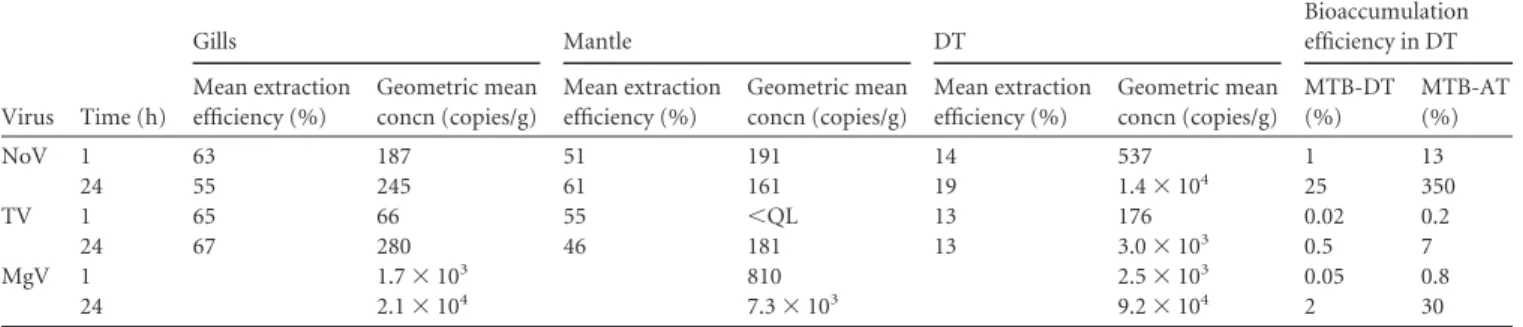
TABLE 1 Tissue distributions of NV, TV, and MgV after 1 or 24 h of bioaccumulationa
Virus Time (h) Gills Mantle DT Bioaccumulation efficiency in DT Mean extraction efficiency (%) Geometric mean concn (copies/g) Mean extraction efficiency (%) Geometric mean concn (copies/g) Mean extraction efficiency (%) Geometric mean concn (copies/g) MTB-DT (%) MTB-AT (%) NoV 1 63 187 51 191 14 537 1 13 24 55 245 61 161 19 1.4⫻ 104 25 350 TV 1 65 66 55 ⬍QL 13 176 0.02 0.2 24 67 280 46 181 13 3.0⫻ 103 0.5 7 MgV 1 1.7⫻ 103 810 2.5⫻ 103 0.05 0.8 24 2.1⫻ 104 7.3⫻ 103 9.2⫻ 104 2 30
aThe mean extraction efficiencies represent the average values for three extractions each from five experiments (so 15 values). The geometric mean concentrations were calculated for five experiments, with each concentration determined on the basis of three separate extractions. The bioaccumulation efficiency in DT was calculated based on the assumptions of a 1-log loss of virus and that 90% of the contamination was in DT (MTB-DT) or equally distributed in all tissues (MTB-AT). QL, quantitation limit.
TABLE 2 Persistence of NV, TV, and MgV in oyster DT over 8 daysa
Virus
No feeding Feeding
Mean extraction efficiency (%)
Geometric mean concn (copies/g)
Mean extraction efficiency (%)
Geometric mean concn (copies/g)
1 day 8 days 1 day 8 days
NV 16 1.4⫾ 104 4.6⫾ 103 40 5.9⫾ 104 7.6⫾ 103
TV 13 3.0⫾ 103 1.2⫾ 103 59 6.9⫾ 104 1.1⫾ 104
MgV 9.2⫾ 104 3.3⫾ 104 1.6⫾ 105 5.9⫾ 104
aConcentrations expressed here are the geometric means for five experiments conducted under “no feeding” conditions and for three experiments conducted under “feeding” conditions. Extraction efficiencies are average values. No statistical difference was observed for NV (P⫽ 0.25) and MgV (P ⬎ 0.99), but the difference was found to be statistically significantly different for TV (P⫽ 0.03).
0.22 log RNA copies/g DT) (
Fig. 1
). MgV concentrations
de-creased quite rapidly and reached the limit of quantification by
week 6 (1.90
⫾ 0.34 log RNA copies/g DT) (
Fig. 1
). The data
allowed for calculations of half-lives, which were 7.56 days for NV,
4.65 days for TV, and 2.17 days for MgV.
DISCUSSION
Viral contamination of oysters is a challenging problem because
classical indicators, such as Escherichia coli or fecal coliforms, are
not satisfactory and depuration is not efficient. Human NoVs
can-not be cultivated easily in cell culture systems (
41
,
42
), but in
recent years, our understanding of the prevalence and impact of
NoV infections has greatly increased, with the advent of molecular
diagnostics and by the use of some surrogate animal caliciviruses
to improve the knowledge on basic virus biology (
43
). The
com-bined use of molecular diagnostics and surrogate viruses is an
approach that should also help to improve our understanding of
NoV behavior, especially persistence, in shellfish.
One important point to consider when studying viral behavior
in shellfish is the mode of contamination. For example, a virus that
bioaccumulates in shellfish may be protected against heat by the
surrounding tissue, in contrast to the same virus artificially seeded
into a shellfish homogenate (
44–46
). However, large amounts of
viruses are needed for bioaccumulation studies. Obtaining
suffi-cient amounts of material containing a particular NoV strain is a
significant challenge due to the genetic variability of NoVs and
because the viruses can be isolated only from human stools. The
search for an appropriate surrogate to study NoV behavior has
been intensive (
47
). Phages have been used in some studies as
potential indicators of human enteric viruses in shellfish, and they
were shown to persist longer than bacteria (
48
,
49
). More recently,
bioaccumulation of an F-specific RNA bacteriophage and NoV in
mussels demonstrated that a high temperature is needed to reduce
phage infectivity and the amount of NoV RNA present (
46
).
Cul-turable enteric viruses, such as hepatitis A virus (HAV), have also
been used to study the effect of cooking on virus infectivity in
shellfish (
45
). HAV was also compared to poliovirus (PV) in
de-puration experiments with artificially contaminated oysters over 5
days, and both viruses were very stable in the oyster DT (
50
).
Oysters that had bioaccumulated HAV, NoV, and PV displayed
almost no decrease in HAV or NoV over 1 day of depuration; in
contrast,
⬎90% of the PV was eliminated (
51
). Animal
calicivi-ruses, including feline calicivirus (FCV) and murine NoV (MNV),
have been used widely as human NoV surrogates. FCV was used to
evaluate the stability of NoV in marinated mussels and following
thermal inactivation (
52
,
53
). A study comparing the
bioaccumu-lation levels of MNV, a bacteriophage, and HAV in two oyster
species reported the superiority of MNV over the other two
sur-rogates in mimicking human NoV behavior (
54
). MNV offered
the possibility of studying NoV infectivity in an animal model and
provided information on the potential infection risks in electron
beam-irradiated oysters (
55
). Previous studies using a mouse
model demonstrated the inactivation of MNV in contaminated
oysters after high-pressure treatment, while NoV stayed
infec-tious, suggesting that MNV might not have been a good model for
NoV in this case (
56
,
57
).
Considering the specificity issues associated with human NoV
bioaccumulation, including HBGA binding, in this study we
eval-uated TV as a potential surrogate to mimic NoV persistence in
oysters. MgV, a sialic acid-binding virus, was included in the study
as a control. However, it is not permissible to place contaminated
oysters into the open environment in France, even if the
contam-ination is with animal viruses (TV infects monkeys not naturally
present in France) or the avirulent strain of murine MgV (vMC0).
To overcome this limitation, oysters were placed in an
experimen-tal farm where the quality of intake seawater was controlled and
discharge was treated prior to release into the environment. The
ability to control experimental conditions in the farm, including
plankton feeding, enabled us to closely mimic conditions
experi-enced by oysters in the natural environment. Despite the
signifi-cant impact of feeding found for TV over 8 days, we chose to add
phytoplankton because the seawater entering the farm was
fil-tered. Starving was recently demonstrated to be efficient to
elim-inate viral particles through autophagy, but oysters have access to
food under natural conditions (
58
). During the first experiment,
accidental overfeeding occurred, but this did not affect the final
virus concentrations. To avoid variations due to physiological
dif-ferences between animals, all experiments were repeated over a
short time and during the period of the year when the maximum
contamination of oysters occurs in France and the HBGA-like
ligand expression in oysters is the highest (
25
,
26
).
Based on our experience in viral quantification, and following
FIG 1 Decreases of NV, TV, and MgV concentrations in oyster DT over 8
weeks. NV, Norwalk virus (half-life, 7.56 days); TV, Tulane virus (half-life, 4.65 days); MgV, mengovirus (half-life, 2.17 days).
steps to verify the efficiency of the extraction step, the
concentra-tions expressed are based on triplicate extracconcentra-tions, with each
ex-traction being analyzed in triplicate by rRT-PCR. We found this
approach to be more accurate, as it minimized extraction and
amplification variations (
36
). Based on quality criteria that were
developed to validate standard curves for animal diseases, we
val-idated or removed all standard curves that did not fit the criteria
(
38
). For standard curves that were removed, the C
Tvalues for
replicate samples were compared to those for other extractions of
the same sample, and eventually the rRT-PCR was repeated. This
improved the quantitative aspects of the assays, as it allowed us to
estimate the uncertainty of quantification, which was found to be
higher for TV than for the other two viruses. This may suggest that
the rRT-PCR assay needs to be optimized further for TV; however,
the level of uncertainty was far lower than the difference observed
in the tissue distributions of TV compared to NV and MgV, and
also lower than the loss of TV observed in the persistence study.
The difference in ligand recognition may explain the variance
observed in tissue distribution; for example, sialic acid residues
are detected in all organs, including the gills, mantle, and DT,
which is consistent with the poorly selective accumulation of MgV
in these three tissues (
59
). In contrast, NV does not recognize sialic
acid but binds to neutral carbohydrates of the HBGA type that are
exclusively located in the DT, consistent with the selective
bioac-cumulation of NV in this organ. TV also recognizes neutral
HBGAs and displayed a tissue distribution that was more closely
aligned with that of NV than with that of MgV, although it did not
bioaccumulate as efficiently as NV. Since there are significant
dif-ferences in the tissue distribution and retention of different NoV
strains in oysters (
26
), the availability of diverse, cell
culture-adapted ReCVs representing different HBGA binding patterns
makes this surrogate even more attractive for modeling NoV
bio-accumulation in shellfish (
29
,
60
). The TV bioaccumulation
effi-ciency obtained here is more comparable to those obtained for GII
NoVs in our previous study, where the bioaccumulation efficiency
of a GII.3 NoV was 0.1 to 0.5% at 1 h and 0.9 to 4.1% at 24 h.
Moreover, a GII.4 NoV strain (
⬍0.1%) bioaccumulated very
poorly in oysters over 24 h (
26
), consistent with the recent
dem-onstration that TV recognizes the A type 3 and B HBGAs (
61
).
Previous studies investigating NoV persistence in oysters in the
open environment are rare, and comparisons of data should be
made with caution, as uncontrolled events may influence the
out-come. After a sewage contamination event, we monitored the
con-centrations of GI and GII NoVs in the DT of oysters over 4 weeks,
and the concentrations decreased from 8.2
⫻10
3RNA copies/g of
DT to 4.2
⫻ 10
3RNA copies/g of DT (
62
). In a study combining
relaying and depuration, naturally contaminated oysters at an
ini-tial concentration of around 2.9
⫻10
3RNA copies/g of DT
dis-played a decrease to 1.4
⫻ 10
2RNA copies/g of DT in 28 days (
63
).
One study performed under laboratory conditions with artificial
seawater reported the persistence of NoV, MNV, and HAV over a
1-month period (
54
). Our study, which was performed for a
lon-ger period, confirmed the persistence of NV, as concentration in
the oyster DT decreased only 50% over an 8-day period.
In conclusion, this study demonstrated similar tissue
distribu-tions and half-lives of TV and NV in oysters, strongly indicating
that TV is an adequate surrogate for studying NoV behavior
dur-ing shellfish contamination. Although further studies are needed
to improve our understanding of the comparative behavior of
ReCVs and NoVs, it is important to emphasize that infectivity
studies can be undertaken with cell culture-adapted ReCVs. Such
studies may provide useful information for risk analysis and
deci-sion-making by authorities during shellfish contamination, lead
to improved public safety, and help to identify the mechanisms of
NoV persistence in shellfish.
ACKNOWLEDGMENTS
This work was supported by the French Government (DGAL; grant 2014-13/1210720/NF) and by grant 2010 CESA 01003 (HEVECoDyn) from the Agence Nationale pour la Recherche (ANR). N.D. was supported by a fellowship from IFREMER and the Conseil Régional des Pays de la Loire, France.
We are grateful to J. Haure (IFREMER SG2M) for helpful advice on shellfish physiology and to P.-J. Hatt, H. Palvado, and their colleagues (IFREMER SG2M Bouin) for taking care of oysters and for help in dissec-tion. We thank Catherine McLeod (Seafood Safety Assessment) for a crit-ical review of the manuscript.
REFERENCES
1. Metcalf TG, Mullin B, Eckerson D, Moulton E, Larkin EP. 1979. Bioaccumulation and depuration of enteroviruses by the soft-shelled clam, Mya arenaria. Appl Environ Microbiol 38:275–282.
2. EFSA. 2011. Scientific opinion on an update on the present knowledge on the occurrence and control of foodborne viruses. EFSA J 9:1–96. 3. Grodzki M, Ollivier J, Le Saux J-C, Piquet J-C, Noyer M, Le Guyader
FS. 2012. Impact of Xynthia tempest on viral contamination of shellfish.
Appl Environ Microbiol 78:3508 –3511.http://dx.doi.org/10.1128/AEM .07604-11.
4. Johnson WE, Kimbrough KL, Lauenstein GH, Christensen J. 2009. Chemical contamination assessment of Gulf of Mexico oysters in response to hurricanes Katrina and Rita. Environ Monit Assess 150:211–225.http: //dx.doi.org/10.1007/s10661-008-0676-9.
5. Vega E, Barclay L, Gregorius N, Shirley H, Lee D, Vinje J. 2014. Genotypic and epidemiologic trends of norovirus outbreaks in the United States, 2009 –2013. J Clin Microbiol 52:147–155. http://dx.doi.org/10 .1128/JCM.02680-13.
6. Ahmed S, Hall AJ, Robinson AE, Verhoef L, Premkumar P, Parashar
UD, Koopmans M, Lopman BA. 2014. Global prevalence of norovirus in
cases of gastroenteritis: a systematic review and meta-analysis. Lancet In-fect Dis 14:725–730.http://dx.doi.org/10.1016/S1473-3099(14)70767-4. 7. Teunis PFM, Sukhrie FHA, Vennema H, Bogerman J, Beersma MFC,
Koopmans MPG. 2015. Shedding of norovirus in symptomatic and
asymptomatic infections. Epidemiol Infect 143:1710 –1717.http://dx.doi .org/10.1017/S095026881400274X.
8. Campos JA, Lees DN. 2014. Environmental transmission of human no-roviruses in shellfish waters. Appl Environ Microbiol 80:3552–3561.http: //dx.doi.org/10.1128/AEM.04188-13.
9. Kitajima M, Iker BC, Pepper IL, Gerba CP. 2014. Relative abundance and treatment reduction of viruses during wastewater treatment process-es—identification of potential viral indicators. Sci Total Environ 488-489: 290 –296.http://dx.doi.org/10.1016/j.scitotenv.2014.04.087.
10. Yang N, Qi H, Wong MML, Wu RSS, Kong RYC. 2012. Prevalence and diversity of norovirus genogroups I and II in Hong Kong marine waters and detection by real-time PCR. Mar Pollut Bull 64:164 –168.http://dx .doi.org/10.1016/j.marpolbul.2011.10.037.
11. Sima LC, Schaeffer J, Le Saux J-C, Parnaudeau S, Elimelech M, Le
Guyader FS. 2011. Calicivirus removal in a membrane bioreactor
waste-water treatment plant. Appl Environ Microbiol 77:5170 –5177.http://dx .doi.org/10.1128/AEM.00583-11.
12. Simmons FJ, Kuo DHW, Xagoraraki I. 2011. Removal of human enteric viruses by a full-scale membrane bioreactor during municipal wastewater processing. Water Res 45:2739 –2750.http://dx.doi.org/10.1016/j.watres .2011.02.001.
13. Richards GP, McLeod C, Le Guyader FS. 2010. Processing strategies to inactivate enteric viruses in shellfish. Food Environ Virol 2:183–193.http: //dx.doi.org/10.1007/s12560-010-9045-2.
14. Polo D, Alvarez C, Diez J, Darriba S, Longa A, Romalde JL. 2014. Viral elimination during commercial depuration of shellfish. Food Control 43: 206 –212.http://dx.doi.org/10.1016/j.foodcont.2014.03.022.
15. Atmar RL. 2010. Noroviruses: state of the art. Food Environ Virol 2:117– 126.http://dx.doi.org/10.1007/s12560-010-9038-1.
16. Tan M, Jiang X. 2005. Norovirus and its histo-blood group antigen receptors: an answer to a historical puzzle. Trends Microbiol 13:285–293. http://dx.doi.org/10.1016/j.tim.2005.04.004.
17. Ruvoën-Clouet N, Belliot G, Le Pendu J. 2013. Noroviruses and histo-blood groups: the impact of common host genetic polymorphisms on virus transmission and evolution. Rev Med Virol 23:355–366.http://dx .doi.org/10.1002/rmv.1757.
18. Le Pendu J, Nystrom K, Ruvoen-Clouet N. 2014. Host-pathogen co-evolution and glycan interactions. Curr Opin Virol 7:88 –94.http://dx.doi .org/10.1016/j.coviro.2014.06.001.
19. Atmar RL, Opekum AR, Gilger MA, Estes MK, Crawford SE, Neill FH,
Ramani S, Hill H, Ferreira J, Graham DY. 2014. Determination of the
50% human infectious dose for Norwalk virus. J Infect Dis 209:1016 – 1022.http://dx.doi.org/10.1093/infdis/jit620.
20. Tan M, Xia M, Chen Y, Bu W, Hegde R, Meller J, Li X, Jiang J. 2009. Conservation of carbohydrate binding interfaces— evidence of human HBGA selection in norovirus evolution. PLoS One 4:e5058.http://dx.doi .org/10.1371/journal.pone.0005058.
21. Le Pendu J, Ruvoen-Clouet N, Kindberg E, Svensson L. 2006. Mende-lian resistance to human norovirus infections. Semin Immunol 18:375– 386.http://dx.doi.org/10.1016/j.smim.2006.07.009.
22. Le Guyader FS, Loisy F, Atmar RL, Hutson AM, Estes MK,
Ruvoen-Clouet N, Pommepuy M, Le Pendu J. 2006. Norwalk virus specific
binding to oyster digestive tissues. Emerg Infect Dis 12:931–936.http://dx .doi.org/10.3201/eid1206.051519.
23. Tian P, Engelbrektson AL, Jiang X, Zhong W, Mandrell RE. 2007. Norovirus recognizes histo-blood group antigens on gastrointestinal cells of clams, mussels, and oysters: a possible mechanism of bioaccumulation. J Food Prot 70:2140 –2147.
24. Langlet J, Kaas L, Greening G. 2015. Binding-based RT-qPCR assay to assess binding patterns of noroviruses to shellfish. Food Environ Virol
7:88 –95.http://dx.doi.org/10.1007/s12560-015-9180-x.
25. Maalouf H, Zakhour M, Le Pendu J, Le Saux J-C, Atmar RL, Le
Guyader FS. 2010. Norovirus genogroup I and II ligands in oysters: tissue
distribution and seasonal variations. Appl Environ Microbiol 76:5621– 5630.http://dx.doi.org/10.1128/AEM.00148-10.
26. Maalouf H, Schaeffer J, Parnaudeau S, Le Pendu J, Atmar RL, Crawford
SE, Le Guyader FS. 2011. Strain-dependent norovirus bioaccumulation
in oysters. Appl Environ Microbiol 77:3189 –3196.http://dx.doi.org/10 .1128/AEM.03010-10.
27. Zakhour M, Maalouf H, Di Bartolo I, Haugarreau L, Le Guyader FS,
Ruvoen-Clouet N, Le Saux J-C, Ruggeri FM, Pommepuy M, Le Pendu J. 2010. Bovine norovirus ligand, environmental contamination and
po-tential cross-species transmission via oyster. Appl Environ Microbiol 76: 6404 – 6411.http://dx.doi.org/10.1128/AEM.00671-10.
28. Le Guyader FS, Atmar RL, Le Pendu J. 2012. Transmission of viruses through shellfish: when specific ligands come into play. Curr Opin Virol
2:103–110.http://dx.doi.org/10.1016/j.coviro.2011.10.029.
29. Farkas T, Lun CWP, Ley B. 2014. Relationship between genotypes and serotypes of genogroup 1 recoviruses: a model for human norovirus anti-genic diversity. J Gen Virol 95:1469 –1478.http://dx.doi.org/10.1099/vir.0 .064675-0.
30. Martin LR, Duke GM, Osorio JE, Hall DJ, Palmenberg AC. 1996. Mutational analysis of the mengovirus poly(C) tract and surrounding heteropolymeric sequences. J Virol 70:2027–2031.
31. Mann L, Anderson K, Luo M, Bond CW. 1992. Molecular and structural basis of hemagglutination in mengovirus. Virology 190:337–345.http: //dx.doi.org/10.1016/0042-6822(92)91220-O.
32. Shumway SE, Cucci TL, Newell RC, Yentsch CM. 1985. Particles selec-tion, ingestion and absorption in filter feeding bivalves. J Exp Mar Biol Ecol 91:77–92.http://dx.doi.org/10.1016/0022-0981(85)90222-9. 33. Le Guyader FS, Parnaudeau S, Schaeffer J, Bosch A, Loisy F,
Pom-mepuy M, Atmar RL. 2009. Detection and quantification of noroviruses
in shellfish. Appl Environ Microbiol 74:618 – 624.http://dx.doi.org/10 .1128/AEM.01507-08.
34. Farkas T, Sestak K, Wei C, Jiang X. 2008. Characterization of a rhesus monkey calicivirus representing a new genus of Caliciviridae. J Virol 82: 5408 –5416.http://dx.doi.org/10.1128/JVI.00070-08.
35. Bougrier S, Geairon P, Deslous-Paoli JM, Bacher C, Jonquieres G. 1995. Allometric relationships and effects of temperature on clearance and
ox-ygen consumption rates of Crassostrea gigas (Thunberg). Aquaculture
134:143–154.http://dx.doi.org/10.1016/0044-8486(95)00036-2. 36. Grodzki M, Schaeffer J, Piquet J-C, Le Saux J-C, Chevé J, Ollivier J, Le
Pendu J, Le Guyader FS. 2014. Bioaccumulation efficiency, tissue
distri-bution, and environmental occurrence of hepatitis E virus in bivalve shell-fish from France. Appl Environ Microbiol 80:4269 – 4276.http://dx.doi .org/10.1128/AEM.00978-14.
37. ISO. 2012. ISO/TS 15216-1. Microbiology of food and animal feed— horizontal method for determination of hepatitis A virus and norovirus in food using real-time RT-PCR. Part 1. Method for quantification. ISO, Geneva, Switzerland.
38. Afnor. 2011. Methode d’analyse en santé animale, PCR. Part 2. Exigences et recommandations pour le développement et la validation de la PCR en santé animale. XPU47-600-2. Afnor, La Plaine Saint-Denis, France. 39. Bedford AJ, Williams G, Bellamy AR. 1978. Virus accumulation by the
rock oyster Crassotrea glomerata. Appl Environ Microbiol 35:1012–1018. 40. Atmar RL, Neill FH, Romalde JL, Le Guyader F, Woodley CM, Metcalf
TG, Estes MK. 1995. Detection of Norwalk virus and hepatitis A virus in
shellfish tissues with the PCR. Appl Environ Microbiol 61:3014 –3018. 41. Jones M, Watanabe M, Zhu S, Graves CL, Keyes LR, Grau KR,
Gon-zales-Hernandez MB, Iovine NM, Wobus CE, Vinje J, Tibbetts SA, Wallet SM, Karst SM. 2014. Enteric bacteria promote human and mouse
norovirus infection of B cells. Science 346:755–759.http://dx.doi.org/10 .1126/science.1257147.
42. Katayama K, Murakami K, Sharp TM, Guix S, Oka T, Takai-Tokada R,
Nakanishi A, Crawford SE, Atmar RL, Estes MK. 2014. Plasmid-based
human norovirus reverse genetics system produces reporter-tagged prog-eny virus containing infectious genomic RNA. Proc Natl Acad Sci U S A
111:E4043–E4052.http://dx.doi.org/10.1073/pnas.1415096111. 43. Karst SM, Zhu S, Goodfellow IG. 2015. The molecular pathology of
noroviruses. J Pathol 235:206 –216.http://dx.doi.org/10.1002/path.4463. 44. Alfano-Sobsey E, Sweat D, Hall A, Breedlove F, Rodriguez R, Pierce A,
Sobsey M, Davies M, Ledford ASL. 2012. Norovirus outbreak associated
with undercooked oysters and secondary household transmission. Epide-miol Infect 140:276 –282.http://dx.doi.org/10.1017/S0950268811000665. 45. Croci L, De Medici D, Di Pasquale S, Toti L. 2005. Resistance of hepatitis A virus in mussels subjected to different domestic cooking. Int J Food Microbiol 105:139 –144.http://dx.doi.org/10.1016/j.ijfoodmicro.2005.04 .008.
46. Flannery J, Rajko-Nenow P, Winetrbourn JB, Malham SK, Jones DL. 2014. Effectiveness of cooking to reduce norovirus and infectious F-spe-cific RNA bacteriophage concentrations in Mytilus edulis. J Appl Micro-biol 117:564 –571.http://dx.doi.org/10.1111/jam.12534.
47. Kniel K. 2014. The makings of a good human norovirus surrogate. Curr Opin Virol 4:85–90.http://dx.doi.org/10.1016/j.coviro.2014.01.002. 48. Dore W, Henshilwood K, Lees DN. 2000. Evaluation of F-specific RNA
bacteriophage as a candidate human enteric virus indicator for bivalve molluscan shellfish. Appl Environ Microbiol 66:1280 –1285.http://dx.doi .org/10.1128/AEM.66.4.1280-1285.2000.
49. Chung H, Jaykus LA, Lovelace G, Sobsey MD. 1998. Bacteriophages and bacteria as indicators of enteric viruses in oysters and their harvest waters. Water Sci Technol 38:37– 44.
50. Love DC, Lovelace GL, Sobsey MD. 2010. Removal of Escherichia coli, Enterococcus faecalis, coliphage MS2, poliovirus, and hepatitis A virus from oysters (Crassotrea virginica) and hard shell clams (Mercinaria mer-cinaria) by depuration. Appl Environ Microbiol 143:211–217.http://dx .doi.org/10.1016/j.ijfoodmicro.2010.08.028.
51. McLeod C, Hay B, Grant C, Greening G, Day D. 2009. Inactivation and elimination of human enteric viruses by Pacific oysters. J Appl Microbiol
107:1809 –1818.http://dx.doi.org/10.1111/j.1365-2672.2009.04373.x. 52. Hewitt J, Greening GE. 2004. Survival and persistence of norovirus,
hepatitis A virus, and feline calicivirus in marinated mussels. J Food Prot
67:1743–1750.
53. Bozkurt H, Leiser S, Davidson PM, D’Souza D. 2014. Thermal inacti-vation kinetic modeling of human norovirus surrogates in blue mussel (Mytilus edulis) homogenate. Int J Food Microbiol 172:130 –136.http://dx .doi.org/10.1016/j.ijfoodmicro.2013.11.026.
54. Nappier SP, Graczyk TK, Schwab KJ. 2008. Bioaccumulation, retention, and depuration of enteric viruses by Crassostrea virginica and Crassostrea ariakensis oysters. Appl Environ Microbiol 74:6825– 6831.http://dx.doi .org/10.1128/AEM.01000-08.
55. Praveen C, Dancho BA, Kingsley DH, Calci KR, Meade GK, Mena KD,
electron beam irradiation in oysters and quantifying the reduction in po-tential infection risks. Appl Environ Microbiol 79:3796 –3801.http://dx .doi.org/10.1128/AEM.00347-13.
56. Gogal RM, Kerr R, Kingsley DH, Granata LA, LeRoith T, Holliman SD,
Dancho BA, Flick GJ. 2011. High hydrostatic pressure processing of
murine norovirus 1-contaminated oysters inhibits oral infection in STAT-1 deficient female mice. J Food Prot 74:209 –214.http://dx.doi.org /10.4315/0362-028X.JFP-10-235.
57. Leon JS, Kingsley DH, Montes JS, Richards GP, Lyon GM, Abdulhafid
GM, Seitz SR, Fernandez ML, Teunis PF, Flick GJ, Moe CL. 2011.
Randomized, double-blinded clinical trial for human norovirus inactiva-tion in oysters by high hydrostatic pressure processing. Appl Environ Mi-crobiol 77:5476 –5482.http://dx.doi.org/10.1128/AEM.02801-10. 58. Moreau P, Moreau K, Segarra A, Tourbiez D, Travers M-A,
Rubin-sztein DC, Renault T. 2015. Autophagy plays an important role in
protecting Pacific oysters from OsHV-1 and Vibrio aestuarianus infec-tions. Autophagy 11:516 –526.http://dx.doi.org/10.1080/15548627.2015 .1017188.
59. Maalouf H, Pommepuy M, Le Guyader FS. 2010. Environmental con-ditions leading to shellfish contamination and related outbreaks. Food Environ Virol 2:136 –145.http://dx.doi.org/10.1007/s12560-010-9043-4. 60. Tian P, Engelbrektson AL, Mandrell RE. 2008. Seasonal tracking of histo-blood group antigen expression and norovirus binding in oyster gastrointestinal cells. J Food Prot 71:1696 –1700.
61. Zhang D, Hunag P, Zou L, Lowary TL, Tan M, Jiang X. 2015. Tulane virus recognizes the A type 3 and B histo-blood group antigens. J Virol
89:1419 –1427.http://dx.doi.org/10.1128/JVI.02595-14.
62. Le Guyader FS, Le Saux J-C, Ambert-Balay K, Krol J, Serais O,
Par-naudeau S, Giraudon H, Delmas G, Pommepuy M, Pothier P, Atmar RL. 2008. Aichi virus, norovirus, astrovirus, enterovirus and rotavirus
involved in clinical cases from a French oyster-related gastroenteritis out-break. J Clin Microbiol 46:4011– 4017. http://dx.doi.org/10.1128/JCM .01044-08.
63. Dore B, Keaveney S, Flannery J, Rajko-Nenow P. 2010. Management of health risks associated with oysters harvested from a norovirus contami-nated area, Ireland, February-March 2010. Euro Surveill 15:pii/19567.