HAL Id: hal-03117725
https://hal.sorbonne-universite.fr/hal-03117725
Submitted on 21 Jan 2021
HAL is a multi-disciplinary open access
archive for the deposit and dissemination of
sci-entific research documents, whether they are
pub-lished or not. The documents may come from
teaching and research institutions in France or
abroad, or from public or private research centers.
L’archive ouverte pluridisciplinaire HAL, est
destinée au dépôt et à la diffusion de documents
scientifiques de niveau recherche, publiés ou non,
émanant des établissements d’enseignement et de
recherche français ou étrangers, des laboratoires
publics ou privés.
SARS-CoV-2 patients: inflammatory response of
SARS-CoV-2 patients
Jean-Rémi Lavillegrand, Marc Garnier, Agathe Spaeth, Nathalie Mario,
Geoffroy Hariri, Antoine Pilon, Enora Berti, Fabienne Fieux, Sara Thietart,
Tomas Urbina, et al.
To cite this version:
Jean-Rémi Lavillegrand, Marc Garnier, Agathe Spaeth, Nathalie Mario, Geoffroy Hariri, et al..
Ele-vated plasma IL-6 and CRP levels are associated with adverse clinical outcomes and death in critically
ill SARS-CoV-2 patients: inflammatory response of SARS-CoV-2 patients. Annals of Intensive Care,
SpringerOpen, 2021, 11 (1), pp.9. �10.1186/s13613-020-00798-x�. �hal-03117725�
Lavillegrand et al. Ann. Intensive Care (2021) 11:9 https://doi.org/10.1186/s13613-020-00798-x
RESEARCH
Elevated plasma IL-6 and CRP levels are
associated with adverse clinical outcomes
and death in critically ill SARS-CoV-2 patients:
inflammatory response of SARS-CoV-2 patients
Jean‑Rémi Lavillegrand
1,2, Marc Garnier
2,3, Agathe Spaeth
4, Nathalie Mario
4, Geoffroy Hariri
1,2, Antoine Pilon
4,
Enora Berti
2,5, Fabienne Fieux
3, Sara Thietart
1, Tomas Urbina
1,2, Matthieu Turpin
2,5, Lucie Darrivière
3,
Muriel Fartoukh
2,5, Franck Verdonk
3, Guillaume Dumas
1, Alain Tedgui
6, Bertrand Guidet
1,2, Eric Maury
1,2,
Yannick Chantran
7, Guillaume Voiriot
2,5and Hafid Ait‑Oufella
1,2,6*Abstract
Background: SARS coronavirus 2 (SARS‑CoV‑2) is responsible for high morbidity and mortality worldwide, mostly due to the exacerbated inflammatory response observed in critically ill patients. However, little is known about the kinetics of the systemic immune response and its association with survival in SARS‑CoV‑2+ patients admitted in ICU. We aimed to compare the immuno‑inflammatory features according to organ failure severity and in‑ICU mortality. Methods: Six‑week multicentre study (N = 3) including SARS‑CoV‑2+ patients admitted in ICU. Analysis of plasma biomarkers at days 0 and 3–4 according to organ failure worsening (increase in SOFA score) and 60‑day mortality. Results: 101 patients were included. Patients had severe respiratory diseases with PaO2/FiO2 of 155 [111–251] mmHg), SAPS II of 37 [31–45] and SOFA score of 4 [3–7]. Eighty‑three patients (83%) required endotracheal intuba‑ tion/mechanical ventilation and among them, 64% were treated with prone position. IL‑1β was barely detectable. Baseline IL‑6 levels positively correlated with organ failure severity. Baseline IL‑6 and CRP levels were significantly higher in patients in the worsening group than in the non‑worsening group (278 [70–622] vs. 71 [29–153] pg/mL,
P < 0.01; and 178 [100–295] vs. 100 [37–213] mg/L, P < 0.05, respectively). Baseline IL‑6 and CRP levels were signifi‑
cantly higher in non‑survivors compared to survivors but fibrinogen levels and lymphocyte counts were not dif‑ ferent between groups. After adjustment on SOFA score and time from symptom onset to first dosage, IL‑6 and CRP remained significantly associated with mortality. IL‑6 changes between Day 0 and Day 3–4 were not different according to the outcome. A contrario, kinetics of CRP and lymphocyte count were different between survivors and non‑survivors.
Conclusions: In SARS‑CoV‑2+ patients admitted in ICU, a systemic pro‑inflammatory signature was associated with clinical worsening and 60‑day mortality.
Keywords: SARS‑CoV‑2, Covid‑19, Cytokine, Inflammation, Outcome
© The Author(s) 2021. This article is licensed under a Creative Commons Attribution 4.0 International License, which permits use, sharing, adaptation, distribution and reproduction in any medium or format, as long as you give appropriate credit to the original author(s) and the source, provide a link to the Creative Commons licence, and indicate if changes were made. The images or other third party material in this article are included in the article’s Creative Commons licence, unless indicated otherwise in a credit line to the material. If material is not included in the article’s Creative Commons licence and your intended use is not permitted by statutory regulation or exceeds the permitted use, you will need to obtain permission directly from the copyright holder. To view a copy of this licence, visit http://crea‑ tivecommons.org/licenses/by/4.0/.
Background
Coronaviruses are a family of viruses responsible for Middle-East Respiratory Syndrome (MERS) and the Severe Acute Respiratory Syndrome (SARS) outbreaks [1, 2]. SARS coronavirus 2 (SARS-CoV-2) is a member of
Open Access
*Correspondence: hafid.aitoufella@aphp.fr
1 Service de Médecine Intensive‑Réanimation, Hôpital Saint‑Antoine,
Assistance Publique‑Hôpitaux de Paris, 184 rue du faubourg Saint‑Antoine, 75571 Paris cedex 12, France
Coronavirus family, first identified in Wuhan by the Chi-nese Center for Disease. It is currently responsible for the COVID-19 worldwide pandemic, which has resulted in high rates of hospitalisation and intensive care unit (ICU) admission [3].
Most patients with SARS-CoV-2 infection experi-ence mild to moderate respiratory illnesses with various symptoms such as fatigue, fever, dry cough, shortness of breath and recover without requiring special treatment. However, about 5–10% of patients further develop life-threatening acute respiratory distress syndrome [4]. The pathophysiology of SARS-CoV-2 -induced lung dam-age is largely uncharted. The direct cytotoxicity of the virus on pulmonary endothelial and alveolar epithelial cells, associated with the aftermath of an intense sys-temic inflammatory response could cause severe forms. Published studies from China suggest that SARS-CoV-2 strongly modulates the immune response, leading to lym-phopenia and life-threatening systemic release of pro-inflammatory cytokines [4, 5]. More recent studies in Europe [6, 7] and America [8] also found that high IL-6 levels at admission are associated with poor outcome in hospitalized patients with SARS-CoV-2. However, cytokine profiles and kinetics of critically ill patients with severe disease admitted in ICU, as well as the relationship between inflammatory biomarkers and disease course in this population, remain poorly investigated.
In this study, we performed an analysis of a predefined set of inflammatory biomarkers on 101 patients with SARS-CoV-2 infection admitted to 3 French Intensive Care Units. We measured plasma levels of anti-inflam-matory cytokine interleukin 10 (IL-10), and pro-inflam-matory cytokines interleukin 1β (IL-1β), tumor necrosis factor α (TNF-α) and interleukin 6 (IL-6) that could be targeted (directly or through receptor blockade) by com-mercially available neutralizing monoclonal antibod-ies. We tested the hypothesis that pro-inflammatory cytokines are associated with both disease severity and outcome in critically ill patients with SARS-CoV-2 infec-tion and that the dynamics of inflammatory makers over the first 3–4 days of ICU management may provide addi-tional information.
Methods
Study scheme
Patients with confirmed SARS-CoV-2 infection referred to Saint-Antoine hospital and Tenon Hospital (Paris, France), and subsequently admitted to one of the ICUs (N = 3) between 1st March and 15th April 2020 were enrolled. Laboratory confirmation for SARS-CoV-2 was defined as a positive result of real-time reverse tran-scriptase–polymerase chain reaction (RT-PCR) assay of nasal, pharyngeal, or lower respiratory tract samples.
Plasma levels of four cytokines (IL-10, IL-1β, TNF-α and IL-6), C-reactive protein (CRP) and fibrinogen were measured within the first days of ICU admission (Day 0) and 3–4 days later (day 3–4). Cytokines were meas-ured by ELISA (Quantikine ELISA Kit, R&D Systems) on plasma according to the appropriate dilution and following recommendations of the manufacturer. Time between plasma isolation and freezing procedure was less than 2 h. Thresholds detection were 7.8 pg/mL for IL-10, 3.9 pg/mL for IL-1β, 15.6 pg/mL for TNF-α and 3.13 pg/mL for IL-6.
Data collection
We collected and analysed medical history, physi-cal examination, and haematologiphysi-cal, biochemiphysi-cal and immunological data obtained in patients with SARS-CoV-2 infection from electronic medical records. Data collection forms were anonymised and reviewed inde-pendently by two investigators. Data collected at ICU admission included age, gender, cardiovascular risk factors, comorbidities (obesity defined by a body mass index > 30 kg.m−2, hypertension, diabetes,
cardiovas-cular disease, chronic respiratory disease, chronic kid-ney disease defined by a creatinine clearance < 60 ml. min−1.1.73 m−2). Disease severity was evaluated using
Simplifier Acute Physiology Score (SAPS II) [9], Sequen-tial Organ Failure Assessment without neurological points (called SOFA#) [10] and organ support therapy
were measured at Baseline (Day 0). Acute kidney injury was defined according to KDIGO definition (Stage ≥ 2) [11]. Disease severity worsening was defined as an increase of SOFA# score ≥ 1 point between day 0 and
day 3–4. Mortality was evaluated at day 60 after ICU admission.
Statistical analysis
Continuous variables are described as median and inter-quartile range (IQR) and compared using Wilcoxon’s rank sum test or the Kruskal–Wallis test; categorical variables are summarized by counts (percents) and com-pared using exact Fisher test or Pearson’s Chi-square test. Spearman correlation coefficient was used to test corre-lation between baseline cytokines values and others con-tinuous data.
To investigate the relationship between cytokines or inflammatory biomarkers and outcome, we performed the following analyses. First, we studied differences in each cytokine levels (IL-6, IL-1β, TNF-α and IL-10) at baseline (eg Day 0) according to the time from symp-toms onset (as a dummy variable, < 9 days, 9–19 days and > 19 days) and organ failure severity at ICU admis-sion. Second, we studied the relationship between base-line biomarkers values and worsening of organ failure at
Page 3 of 10 Lavillegrand et al. Ann. Intensive Care (2021) 11:9
day 3–4 (defined as an increase of SOFA score ≥ 1 point). Third, we investigated the prognosis value of biomarkers on day 60 mortality. For each biomarkers, we computed Hazard ratio (HR) of mortality using Cox model adjusted on SOFA score and the time from respiratory symptoms onset. Receiver operating characteristics curves (ROC) were plotted for day 60 mortality. The accuracy of these variables was assessed calculating its area under the curve (AUC), assessment of the best cut-off value, sensi-tivity and specificity calculation as well as the likelihood ratios.
To evaluate the relationship between patient status at day 60 and biomarker kinetics, we modeled biomarkers as a function of time, by fitting a linear mixed model, to take into account the clustering aspect of repeated data. These models allowed us to test for differences in average biomarker levels between survivors and non-survivors and investigate trends over time according to vital status. Then, we computed the Delta change for each biomarker (value at day3 minus value at Day 0) and the biomarker ratio (eg the percentage of change per day relative to the first measurement). These variables were used together with SOFA at admission and time from symptom onset in a Cox model for day 60 mortality.
Additionally, to identify variables associated with day-60 mortality, we built univariate Cox regression models. Clinically relevant variables significantly associated with day-60 mortality (p < 0.01) were entered in multivariable model.
For each model, collinearity between variables and pairwise interactions were tested. Linearity of continu-ous variable and proportional Hazards assumption were checked. Multivariate Cox regression selection were per-formed with stepwise selection based on AIC. Because missing value accounted for less than 10%, analyses were performed on complete cases.
All tests were two-sided, and P values less than 0.05 were considered as statistically significant. Statistics were performed using R (https ://www.R-proje ct.org/) software, and graphical representations were performed using GraphPad Prism 5.04 (Graph Pad Software Inc. ®).
Results
Patients
Over a 6-week period, 150 patients with SARS-CoV-2 infection were admitted in 3 ICUs. Cytokine profiles were available in 130 patients. Twenty-nine patients receiving compassionate immunomodulating treat-ments (anti-cytokine neutralizing monoclonal antibod-ies) before ICU admission were excluded. Among the 101 patients which were ultimately included in our analysis (Additional file 1), 82 were men (82%), with a mean age of 59 ± 11 years. Patient characteristics are summarised
in Table 1. At Day 0, patients with SARS-CoV-2 infec-tion admitted in ICU had mainly severe respiratory dis-eases with PaO2/FiO2 of 155 [111–251] mmHg, SAPS II of 37 [31–45] and modified SOFA score of 4 [3–7]. At day 0, Eighty-three patients (83%) required endotracheal intubation/mechanical ventilation, and among them 53 (64%) were treated with prone positioning during ICU stay. Patient biological characteristics are summarised in Additional file 2.
Immuno‑inflammatory profile according to time from symptom onset to dosage
Cytokine baseline plasma levels were measured 14 [11– 20] days after the onset of symptoms. First, we analysed plasma levels of cytokines according to time elapsed from the onset of symptoms and blood sampling. IL-1β was barely detectable (Additional file 3), IL-10 and TNF-α plasma levels were not different according to symptom duration (Additional file 4). IL-6 plasma levels signifi-cantly varied according to symptom duration, being sig-nificantly higher in patients from whom blood samples were collected between days 9 and 19 after symptom onset (P = 0.03) (Fig. 1a).
Immuno‑inflammatory profile according to organ failure severity
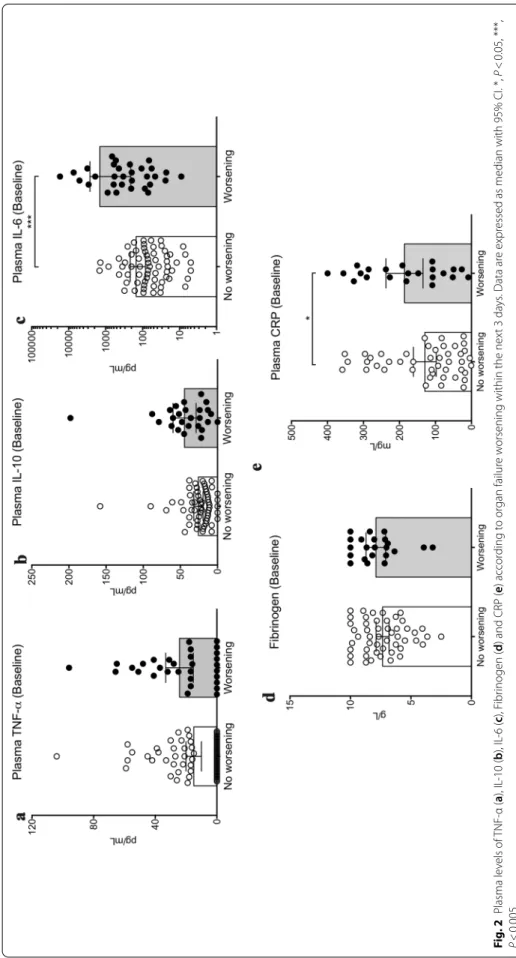
Baseline IL-6 plasma levels positively correlated with organ failure severity (Fig. 1b and Additional file 5) but did not correlate with CRP levels (Additional file 6). Next, we analysed the relationship between baseline plasma levels of inflammation markers and organ failure wors-ening between days 0 and 3–4. Organ failure worsen-ing, defined as an increase of SOFA score ≥ 1 point, was observed in 32 patients (32%) (Additional file 1). Base-line plasma levels of TNF-α (Fig. 2a), IL-10 (Fig. 2b) and fibrinogen (Fig. 2d) were not different between patients in the worsening and non-worsening groups, while IL-6 and CRP plasma levels were significantly higher in the worsening group: 278 [70–622] vs. 71 [29–153] pg/mL,
P = 0.003 for IL-6 (Fig. 2c) and 178 [100–295] vs. 100 [37–213] mg/L, P = 0.04 for CRP (Fig. 2e).
Immuno‑inflammatory profile according to in‑ICU survival
At day 60 after ICU admission, 19 patients (19%) had died, with a median ICU length of stay of 14 [10–19] days (Additional file 7). At admission, non-survivors had significant higher SOFA# score (Table 1) and more
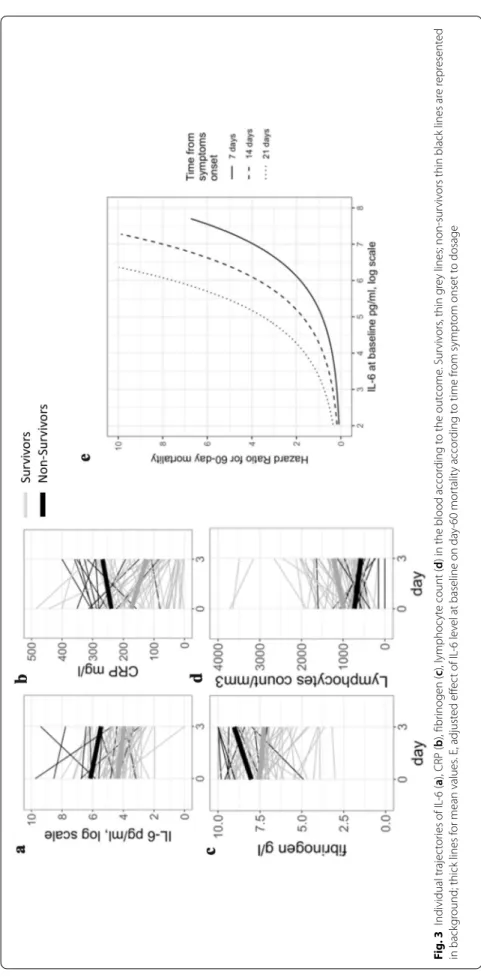
severe hypoxemia (Additional file 2). Plasma levels of inflammatory biomarkers were measured at day 0 and day 3–4. Baseline IL-6 and CRP levels were significantly higher in non-survivors compared to survivors but fibrinogen levels and lymphocyte counts were not dif-ferent between groups (Fig. 3a–d and Additional file 8).
After adjustment on SOFA score and time from symp-tom onset to first dosage, IL-6 and CRP remained sig-nificantly associated with 60-day mortality (Table 2 and Additional file 9). IL-6 level at Day 0 was an interesting tool to identify patients at higher risk for mortality as the area under the curve was 0.80 (CI95% [0.67–0.89]) (Additional file 10), optimal IL-6 threshold was 212 pg/ mL with a sensitivity of 68% (CI 95% [47–89]) and a specificity of 80% (CI95% [71–89]). The prognostic value of IL-6 was influenced by the time from symptom onset to first dosage (Fig. 3e).
IL-6 changes between Day 0 and Day 3–4 were not dif-ferent according to the outcome (Fig. 3a and Table 3). However, kinetics of other studied biomarkers were inter-esting. CRP increased in non-survivors but decreased in survivors (Fig. 3b and Table 3). Blood lymphocyte counts remained low in non-survivors, whereas counts increased at day 3–4 in survivors (Fig. 3d and Table 3).
Impact of chronic corticosteroid treatment on inflammatory profile and outcome
In our cohort, before ICU admission, 19 patients were treated with chronic low doses of glucocorticoids with different doses and molecules. We did not observe any difference in IL-6 plasma levels between patients receiv-ing glucocorticoids and the others (87 [37–310] vs 91 [16–252] pg/ml, P = 0.43). Mortality was not different between groups (3/19 vs 16/66, P = 0.71, Chi-squared test).
Discussion
In this cohort study of critically ill patients with SARS-CoV-2 infection, we found that a systemic pro-inflamma-tory signature was associated with clinical worsening and poor outcome. Baseline high plasma levels of CRP and IL-6 were associated with both organ failure worsening and 60-day mortality, whereas baseline plasma levels of
Table 1 Characteristics of included ICU patients with SARS-CoV-2 infection according to 60-day outcome
Data are expressed as N (%) or median (1st IQR–3rd IQR). ACE Angiotensin-Converting Enzyme, NS non-significant
Characteristics Total
N = 101 SurvivorsN = 82 Non‑survivorsN = 19 P value
Men (N, %) 82 (82%) 68 (83%) 14 (74%) 0.35
Age (years) 59 ± 11 57 ± 10 63 ± 11 0.07
SOFA# score 4 [3–7] 4 [3–6] 6 [4–8] 0.005
SAPS II 37 [31–45] 37 [31–44] 41 [33–48] 0.45
Body mass index (kg/m2)
< 30 63 (63%) 53 (65%) 10 (52%) > 30 38 (38%) 30 (37%) 8 (42%) 0.65 Comorbidity (N, %) Hypertension 51 (51%) 44 (54%) 7 (36%) 0.18 Diabetes mellitus 29 (29%) 23 (28%) 6 (34%) 0.76 Cardiovascular disease 12 (12%) 10 (12%) 2 (11%) 0.84
Chronic respiratory disease 18 (18%) 15 (18%) 3 (16%) 0.81
Chronic kidney disease 14 (14%) 11 (13%) 3 (16%) 0.78
Cirrhosis 2 (2%) 2 (2%) 0 0.49 Previous cancer 2 (2%) 2 (2%) 0 0.49 Haematological malignancy 6 (6%) 5 (6%) 1 (5%) 0.89 Treatment (N, %) Glucocorticoids 19 (19%) 16 (19%) 3 (16%) 0.71 ACE inhibitors 28 (28%) 22 (25%) 6 (31%) 0.67
Organ support therapy at day 0 (N, %)
Sedative drugs 71 (71%) 55 (67%) 16 (84%) 0.14 Neuromuscular blockers 57 (57%) 44 (54%) 13 (68%) 0.24 Mechanical ventilation 83 (83%) 67 (82%) 16 (84%) 0.79 Prone positioning 53 (53%) 42 (51%) 9 (47%) 0.76 Haemodialysis 11 (11%) 10 (12%) 1 (5%) 0.38 Norepinephrine N (%) 33 (33%) 24 (29%) 9 (47%) 0.13 Dosage (mg/h) 0 [0–0.22] 0 [0–0.1] 0.1 [0–0.87] 0.07 Co‑infections at day 3 (N, %) 37 (37%) 30 (36%) 7 (37%) 0.98
Page 5 of 10 Lavillegrand et al. Ann. Intensive Care (2021) 11:9
IL-1β, TNF-α did not differ with patient outcome. Kinet-ics of CRP and lymphocyte count were significantly dif-ferent between survivors and non-survivors.
In this cohort, majority of patients were admitted to the ICU because of acute hypoxemic respiratory failure that required respiratory support. Seventy-nine percent of patients had at least one comorbidity, in agreement with recent reports in China [12], Singapore [13] and Italy [14]. Similar to other previous reports [12], hyper-tension was the most common comorbidity, followed by obesity and diabetes.
Besides cytokines, we measured and analysed several markers of inflammatory response in the blood. First, we measured neutrophil count that did not differ according to patient’s course or outcome. Nevertheless, we found that persistent lymphopenia was associated with in-ICU mortality. Huang et al. [4] have reported in a cohort of 41 patients with SARS-CoV-2 infections in China that blood lymphocyte count was significantly lower in criti-cally ill patients admitted in ICU compared to patients with no-ICU care. Flow cytometry analyses showed that lymphopenia was due to decreased CD4+ and CD8+
T cells in the blood, B cell population being unchanged [5]. Lymphopenia following SARS-CoV and MERS-CoV infection injury has been previously reported [15] and is related to the activation of cell death program through both extrinsic and intrinsic pathways [16]. Experimental studies have highlighted that T lymphocytes, particularly
CD4+ T cells, are involved in controlling and finetuning
pathogenesis and outcome of coronavirus infections [17, 18]. Persistent lymphopenia may promote viral replica-tion, explaining at least partly, the relationship between low lymphocyte blood count and poor outcome.
We measured CRP plasma levels, as a global marker of inflammation produced by the liver in response to IL-6 [19]. However, we did not find any significant correlation between IL-6 and CRP levels. Some authors have sug-gested that other factors modulate CRP production [20, 21]. The absence of association may also be explained by a discrepancy in the kinetics of production between both markers, IL-6 being quickly released by inflammatory cells, whereas CRP production by hepatocytes require a longer period of time [19]. Our finding suggests that CRP cannot be used as a surrogate marker for IL-6 lev-els in patients with SARS-CoV-2 infection. In our cohort, plasma CRP levels were higher (205 [91–263] mg/mL) than previously reported by Huang et al. (108 [28–140] mg/mL) but patient characteristics were different. Huang et al. analysed hospitalised SARS-CoV-2 + patients with and without in-ICU care, whereas we focused on selected critically ill patients with severe respiratory disease. Fibrinogen, a major coagulation factor responsible for blood clotting, is another key component of the inflam-matory response [22]. Fibrinogen production by the liver is upregulated in response to cytokines such as IL-6, and released during sterile inflammation or following
Fig. 1 A, Plasma levels of IL‑6 according to time between symptom onset and cytokine measurement (Kruskal–Wallis Test). B, Plasma levels of IL‑6 according to organ failure severity, evaluated using SOFA# score (SOFA score without neurological points). Data are expressed as median with 95%
Fig . 2 P lasma le vels of TNF ‑α ( a), IL ‑10 ( b), IL ‑6 ( c), F ibr inogen ( d) and CRP ( e) accor ding t o or gan failur e w
orsening within the nex
t 3
da
ys
. Data ar
e expr
essed as median with 95% CI. *,
P < 0.05, ***, P < 0.005
Page 7 of 10 Lavillegrand et al. Ann. Intensive Care (2021) 11:9
Fig . 3 I ndividual trajec tor ies of IL ‑6 ( a), CRP ( b), fibr inogen ( c), lymphoc yt e count (
d) in the blood accor
ding t o the out come . Sur viv ors , thin g re y lines; non ‑sur viv
ors thin black lines ar
e r epr esent ed in back gr
ound; thick lines f
or mean values . E, adjust ed eff ec t of IL ‑6 le vel at baseline on da y‑ 60 mor talit y accor ding t o time fr om sympt om onset t o dosage
bacterial or viral infections. We found that high persis-tent plasma levels of fibrinogen were associated with in-ICU mortality. Based on this observation, we hypoth-esised that fibrinogen might participate in organ damage in SARS-CoV-2 infection, through its pro-inflammatory activity [22] and/or through its well-known pro-coagu-lant functions. High incidence of venous thrombosis and pulmonary embolism has been recently reported as a hallmark of SARS-CoV-2 infections [23].
We measured plasma levels of IL-10, a key anti-inflam-matory cytokine, and 3 pro-inflamanti-inflam-matory cytokines (IL-1β, TNF-α and IL-6). Analysis of the kinetics of plasma levels of these cytokines should help improve our under-standing of SARS-CoV-2 disease and may also pave the way for effective treatment, as these cytokines (or their receptors) can be neutralised in vivo with currently avail-able and well-validated neutralizing antibodies. In our cohort, IL-1β was not detectable in plasma, confirming a previous study in China [5]. However, given that ELISA method was not sensitive enough to detect very low plasma levels of IL-1β (Below 4 pg/mL), a pathogenic role of circulating IL-1β in SARS-CoV-2 disease could not be excluded. We did not find any relationship between TNF-α plasma levels and patient outcome, but this result does not rule out a role of this cytokine in SARS-CoV-2 induced organ failure. Indeed, plasma was analysed sev-eral days after symptom onset and TNF-α, a component
of the acute-phase response, is known to be produced at earlier time points after infection. In sepsis, experimen-tal [24] and clinical studies [25] have shown that TNF-α is produced in large amounts, but only during the first hours after bacterial exposure. Plasma levels of TNF-α are low in patients admitted in ICU later after infection, which might explain, at least in part, why TNF-α block-ade using neutralizing monoclonal antibody failed to improve sepsis outcome in randomised trials [26].
In our study, we found that IL-6 plasma levels were strongly associated with disease severity. Baseline IL-6 levels in patients with SARS-CoV-2 infections were similar to those reported in patients with community acquired bacterial pneumonia [27] but lower than in patients with sepsis [28] or CRS induced by CAR T cell therapy [8]. Baseline IL-6 correlated with SOFA# score
and is associated with worsening organ failure. In addi-tion, IL-6 plasma levels were significantly higher in non-survivors, supporting a pathogenic role for IL-6 in the pathophysiology of SARS-CoV-2 infection. In a retro-spective multicentre study in China, elevated IL-6 plasma levels were identified as a predictive factor of mortality [29]. Such an independent association was confirmed in a large cohort of patients hospitalized in the United States [8]. Based on these results, IL-6 signalling blockade using monoclonal antibodies has been considered as an attrac-tive therapeutic approach in SARS-CoV-2 infections that is currently under investigation in several countries using Tocilizumab [30, 31]. Our results may suggest that antibody treatment should not be based on CRP levels since CRP did not correlate with IL-6 levels. Finally, it is important to underline that possible beneficial effects of reducing inflammation should be carefully weighed up against potential deleterious impairment of anti-micro-bial immunity.
At baseline, IL-6 levels were predictive of poor out-come but changes at day 3–4 did not provide any addi-tional predictive information. A contrario, kinetics of
Table 2 Analysis of predictors for mortality using multivariable Logistic Regression
HR Hazard Ratio, SOFA Sepsis-related Organ Failure Assessment, ICU Intensive
Care Unit
HR [95%CI] p‑value
IL‑6 at Day 0 (log) 2.20 [1.58–3.05] < 0.001
SOFA 1.09 [0.90–1.31] 0.40
Time between symptom onset
and dosage (days) 1.09 [1.00–1.19] 0.04
Table 3 Relationship between biomarkers variations between Day 0 and Day 3–4 and the outcome
Results are given as Median [IQR] and Hazard Ratio (HR) [95%CI], *Ratio: percentage of change from Day 0 value; ** delta between Day0 and Day 3–4 values; ***Adjusted on SOFA at ICU admission and time from symptom onset to first dosage
Survivors Non‑survivors p‑value for univariate
comparison Adjusted***HR [95% CI] p‑value
Lymphocyte ratio* 16.4 [− 4.5, 53.3] − 23.6 [− 54.5, 20.6] 0.02 0.9 [0.8–1.0] 0.05 Delta Lymphocyte** − 160.0 [− 395.0, 65.0] 0 [− 40.0, 460.0] 0.01 1.2 [1.1–1.4] 0.01 CRP ratio − 45.7 [− 62.6, 14.9] 13.9 [− 20.3, 32.1] 0.04 1.0 [0.9–1.1] 0.44 Delta CRP 39.5 [− 12.0, 114.6] − 34.0 [− 68.7, 65.7] 0.05 0.6 [0.4–0.9] 0.01 Fibrinogen ratio − 0.02 [− 0.88, 0.29] 0.16 [− 0.01, 0.35] 0.155 1.41 [0.77–2.57] 0,25 Delta Fibrinogen − 0.11 [− 1.18, 0.54] 0.36 [− 0.03, 1.00] 0.05 1.40 [0.96–2.05] 0.08 IL‑6 ratio − 14.5 [− 29.3, 0.4] − 6.6 [− 21.0, 0.2] 0.55 1.2 [0.8–1.6] 0.37 Delta IL‑6 − 0.7 [− 1.6, 0] − 0.4 [− 1.0, 0] 0.66 0.9 [0.5–1.8] 0.83
Page 9 of 10 Lavillegrand et al. Ann. Intensive Care (2021) 11:9
other inflammatory biomarkers including CRP and lym-phocyte count were different between Day 0 and Day 3–4 in survivors versus non-survivors. However, analysis of these biomarkers at later time points was lacking in our study and should be investigated in the future.
The results of this descriptive study should be analysed with caution. We found a significant correlation between plasma inflammatory markers and COVID-19 severity. However, correlation does not imply causality. It is likely that virus replication drives inflammatory response and subsequent disease severity, the exacerbated inflamma-tion being an inappropriate host response that requires correction. Ongoing immunotherapy trials will be help-ful to confirm the pathogenic role of IL-6 in patients with SARS-CoV-2 infection.
Conclusion
This multicentre study provides an inflammatory profil-ing of critically ill patients hospitalised for SARS-CoV-2 infection and shows associations between plasma inflammatory markers and both patient course and mortality. Our results may suggest a pathogenic role of IL-6 in the pathophysiology of SARS-CoV-2 infection. Future immunotherapy clinical trials will be important to confirm this hypothesis.
Supplementary Information
The online version contains supplementary material available at https ://doi.
org/10.1186/s1361 3‑020‑00798 ‑x. Additional file 1. Flow chart.
Additional file 2. Baseline biological parameters of included ICU patients with SARS‑CoV‑2 infection according to 60‑day outcome. Data are expressed as N (%) or median (1stIQR‑3rdIQR). NS for non‑significant. Additional file 3. Plasma levels of IL‑1β according to organ failure wors‑ ening between day 0 and day 3–4.
Additional file 4. Plasma levels of TNF‑α and IL‑10 according to time between symptom onset and cytokine dosage. Data are expressed as median with 95% CI.
Additional file 5. Correlation between baseline IL‑6 levels and SOFA# score on patients whose time between onset symptoms and blood sampling was 9–19 days.
Additional file 6. No correlation between IL‑6 and CRP plasma levels in ICU patients with SARS‑CoV‑2 infections.
Additional file 7. Survival curve of included patients with SARS‑CoV‑2 infections admitted in ICU (N = 101).
Additional file 8. Biomarker levels at baseline and at day 3–4 according to in‑ICU outcome. Data are expressed as median (1st IQR–3rd IQR). a, survivors Day 0 vs Day 3–4; b non‑survivors day 0 vs Day 3–4.
Additional file 9. Predictive value of biomarkers (Day 0) for in‑ICU mortal‑ ity. For each biomarker, adjustment was done on SOFA at ICU admission and time from symptom onset to measurement. HR, Hazard Ratio. Additional file 10. Biomarker accuracy (at Day 0) for the prediction of mortality. AUC: Area Under Curve, LR: likelihood ratio. *Cut‑off set accord‑ ing to Youden index method.
Abbreviations
CRP: C Reactive Protein; ICU: Intensive care unit; IL: Interleukin; SAPS: Simplifier Acute Physiology Score; SARS: Severe Acute Respiratory Syndrome; SOFA: Sequential Organ Failure Assessment; TNF: Tumor Necrosis Factor. Acknowledgements
We are indebted to Pierre Aucouturier, Guillaume Lefevre, Jerome Gué‑ chot, Michel Vaubourdolle, Jérémie Joffre, Judith Leblanc for their help and l’Entrepôt de Données de Santé de l’Assistance Publique – Hôpitaux de Paris (AP‑HP) for their help in data extraction.
Authors’ contributions
Study concept and design, JRL, MG, GV, NM, YC and HAO. Acquisitions of data JRL, MG, AS, NM, GH, AP, EB, FF, TU, MT, LD, MF, FV, YC, GV and HAO. Drafting of the manuscript JRL, MG, TU, ST, GV, EM, BG and HAO. Critical revision of manuscript, all the authors. Statistical analysis, JRL and HAO. All authors read and approved the final manuscript.
Funding None.
Availability of data and materials
The datasets used and/or analyzed during the current study are available from the corresponding author on reasonable request.
Ethics approval and consent to participate
The study was performed in accordance with Good Clinical Practice and the Declaration of Helsinki principles for ethical research. The study protocol was approved by the Institutional Ethical Review Board of EDS‑Assistance Publique – Hôpitaux de Paris (AP‑HP) (CSE 20–49) and patients’ consent were obtained.
Consent for publication Not applicable. Competing interests
The authors declare that they have no competing interests. Author details
1 Service de Médecine Intensive‑Réanimation, Hôpital Saint‑Antoine,
Assistance Publique‑Hôpitaux de Paris, 184 rue du faubourg Saint‑Antoine,
75571 Paris cedex 12, France. 2 Sorbonne Université, Paris, France. 3 Service
D’Anesthésie‑Réanimation, Hôpital Saint‑Antoine, Assistance Publique‑
Hôpitaux de Paris, Paris, France. 4 Département de Biochimie, Hormonologie
et Suivi Thérapeutique, Hôpital Saint‑Antoine, Assistance Publique‑Hôpitaux
de Paris, Paris, France. 5 Service de Médecine Intensive‑Réanimation, Hôpital
Tenon, Assistance Publique‑Hôpitaux de Paris, Paris, France. 6 Inserm U970,
Cardiovascular Research Center, Université de Paris, Paris, France. 7 Départe‑
ment D’Immunologie Biologique, Hôpital Saint‑Antoine, Assistance Publique‑ Hôpitaux de Paris, Paris, France.
Received: 16 October 2020 Accepted: 29 December 2020
References
1. Drosten C, Gunther S, Preiser W, van der Werf S, Brodt HR, Becker S, Rabenau H, et al. Identification of a novel coronavirus in patients with severe acute respiratory syndrome. N Engl J Med. 2003;20:1967–76. 2. Zaki AM, van Boheemen S, Bestebroer TM, Osterhaus AD, Fouchier RA.
Isolation of a novel coronavirus from a man with pneumonia in Saudi Arabia. N Engl J Med. 2012;19:1814–20.
3. Zhou P, Yang XL, Wang XG, Hu B, Zhang L, Zhang W, Si HR, et al. A pneumonia outbreak associated with a new coronavirus of probable bat origin. Nature. 2020;7798:270–3.
4. Huang C, Wang Y, Li X, Ren L, Zhao J, Hu Y, Zhang L, et al. Clinical features of patients infected with 2019 novel coronavirus in Wuhan China. Lancet. 2020;10223:497–506.
5. Chen G, Wu D, Guo W, Cao Y, Huang D, Wang H, Wang T, et al. Clinical and immunological features of severe and moderate coronavirus disease 2019. J Clin Invest. 2020;5:2620–9.
6. Laguna‑Goya R, Utrero‑Rico A, Talayero P, Lasa‑Lazaro M, Ramirez‑ Fernandez A, Naranjo L, Segura‑Tudela A, et al. IL‑6‑based mortality risk model for hospitalized patients with COVID‑19. J Allergy Clin Immunol. 2020;146:799–807.
7. Giamarellos‑Bourboulis EJ, Netea MG, Rovina N, Akinosoglou K, Antonia‑ dou A, Antonakos N, Damoraki G, et al. Complex immune dysregulation in COVID‑19 patients with severe respiratory failure. Cell Host Microbe. 2020;6:992–1000 e3.
8. Del Valle DM, Kim‑Schulze S, Huang HH, Beckmann ND, Nirenberg S, Wang B, Lavin Y, et al. An inflammatory cytokine signature predicts COVID‑19 severity and survival. Nat Med. 2020.
9. Le Gall JR, Lemeshow S, Saulnier F. A new Simplified Acute Physiology Score (SAPS II) based on a European/North American multicenter study. JAMA. 1993;24:2957–63.
10. Moreno R, Vincent JL, Matos R, Mendonca A, Cantraine F, Thijs L, Takala J, et al. The use of maximum SOFA score to quantify organ dysfunction/ failure in intensive care. Results of a prospective, multicentre study. Work‑ ing Group on Sepsis related Problems of the ESICM. Intensive Care Med. 1999;7:686–96.
11. Chawla LS, Bellomo R, Bihorac A, Goldstein SL, Siew ED, Bagshaw SM, Bittleman D, et al. Acute kidney disease and renal recovery: consensus report of the Acute Disease Quality Initiative (ADQI) 16 Workgroup. Nat Rev Nephrol. 2017;4:241–57.
12. Wang D, Hu B, Hu C, Zhu F, Liu X, Zhang J, Wang B, et al. Clinical character‑ istics of 138 hospitalized patients with 2019 novel coronavirus‑infected pneumonia in Wuhan. China JAMA. 2020;323:1061–9.
13. Young BE, Ong SWX, Kalimuddin S, Low JG, Tan SY, Loh J, Ng OT, et al. Epidemiologic features and clinical course of patients infected with SARS‑CoV‑2 in Singapore. JAMA. 2020;323:1488–94.
14. Grasselli G, Zangrillo A, Zanella A, Antonelli M, Cabrini L, Castelli A, Cereda D, et al. Baseline characteristics and outcomes of 1591 patients infected with SARS‑CoV‑2 admitted to ICUs of the Lombardy Region. Italy JAMA. 2020;323:1574–81.
15. He Z, Zhao C, Dong Q, Zhuang H, Song S, Peng G, Dwyer DE. Effects of severe acute respiratory syndrome (SARS) coronavirus infection on peripheral blood lymphocytes and their subsets. Int J Infect Dis. 2005;6:323–30.
16. Chu H, Zhou J, Wong BH, Li C, Chan JF, Cheng ZS, Yang D, et al. Middle east respiratory syndrome coronavirus efficiently infects human primary T lymphocytes and activates the extrinsic and intrinsic apoptosis pathways. J Infect Dis. 2016;6:904–14.
17. Chen J, Lau YF, Lamirande EW, Paddock CD, Bartlett JH, Zaki SR, Subbarao K. Cellular immune responses to severe acute respiratory syndrome coronavirus (SARS‑CoV) infection in senescent BALB/c mice: CD4+ T cells are important in control of SARS‑CoV infection. J Virol. 2010;3:1289–301.
18. Zhao J, Li K, Wohlford‑Lenane C, Agnihothram SS, Fett C, Zhao J, Gale MJ Jr, et al. Rapid generation of a mouse model for Middle East respiratory syndrome. Proc Natl Acad Sci USA. 2014;13:4970–5.
19. Sproston NR, Ashworth JJ. Role of C‑reactive protein at sites of inflamma‑ tion and infection. Front Immunol. 2018;9:754.
20. Weinhold B, Ruther U. Interleukin‑6‑dependent and ‑independent regula‑ tion of the human C‑reactive protein gene. Biochem J. 1997;327:425–9. 21. Calabro P, Willerson JT, Yeh ET. Inflammatory cytokines stimulated
C‑reactive protein production by human coronary artery smooth muscle cells. Circulation. 2003;16:1930–2.
22. Luyendyk JP, Schoenecker JG, Flick MJ. The multifaceted role of fibrinogen in tissue injury and inflammation. Blood. 2019;6:511–20.
23. Lodigiani C, Iapichino G, Carenzo L, Cecconi M, Ferrazzi P, Sebastian T, Kucher N, et al. Venous and arterial thromboembolic complications in COVID‑19 patients admitted to an academic hospital in Milan Italy.
Thromb Res. 2020. https ://doi.org/10.1016/j.throm res.2020.04.024.
24. Song R, Kim J, Yu D, Park C, Park J. Kinetics of IL‑6 and TNF‑alpha changes in a canine model of sepsis induced by endotoxin. Vet Immunol Immu‑ nopathol. 2012;2:143–9.
25. Neilson D, Kavanagh JP, Rao PN. Kinetics of circulating TNF‑alpha and TNF soluble receptors following surgery in a clinical model of sepsis. Cytokine. 1996;12:938–43.
26. Fisher CJ Jr, Agosti JM, Opal SM, Lowry SF, Balk RA, Sadoff JC, Abraham E, et al. Treatment of septic shock with the tumor necrosis factor receptor: Fc fusion protein. The Soluble TNF Receptor Sepsis Study Group. N Engl J Med. 1996;26:1697–702.
27. Fernandez‑Serrano S, Dorca J, Coromines M, Carratala J, Gudiol F, Manresa F. Molecular inflammatory responses measured in blood of patients with severe community‑acquired pneumonia. Clin Diagn Lab Immunol. 2003;5:813–20.
28. Leisman DE, Ronner L, Pinotti R, Taylor MD, Sinha P, Calfee CS, Hirayama AV, et al. Cytokine elevation in severe and critical COVID‑19: a rapid systematic review, meta‑analysis, and comparison with other inflamma‑
tory syndromes. Lancet Respir Med. 2020. https ://doi.org/10.1016/S2213
‑2600(20)30404 ‑5.
29. Aziz M, Fatima R, Assaly R. Elevated interleukin‑6 and severe COVID‑19: a
meta‑analysis. J Med Virol. 2020. https ://doi.org/10.1002/jmv.25948 .
30. Alzghari SK, Acuna VS. Supportive treatment with tocilizumab for COVID‑ 19: a systematic review. J Clin Virol. 2020;127:104380.
31. Sciascia S, Apra F, Baffa A, Baldovino S, Boaro D, Boero R, Bonora S, et al. Pilot prospective open, single‑arm multicentre study on off‑label use of tocilizumab in severe patients with COVID‑19. Clin Exp Rheumatol. 2020;38:529–32.
Publisher’s Note
Springer Nature remains neutral with regard to jurisdictional claims in pub‑ lished maps and institutional affiliations.