HAL Id: hal-01528507
https://hal.archives-ouvertes.fr/hal-01528507
Submitted on 26 May 2020
HAL is a multi-disciplinary open access
archive for the deposit and dissemination of
sci-entific research documents, whether they are
pub-lished or not. The documents may come from
teaching and research institutions in France or
abroad, or from public or private research centers.
L’archive ouverte pluridisciplinaire HAL, est
destinée au dépôt et à la diffusion de documents
scientifiques de niveau recherche, publiés ou non,
émanant des établissements d’enseignement et de
recherche français ou étrangers, des laboratoires
publics ou privés.
when exposed to microscale turbulence under nutrient
replete conditions
Alberto Amato, Gianluca Dell’aquila, Francesco Musacchia, Rossella
Annunziata, Ari Ugarte, Nicolas Maillet, Alessandra Carbone, Maurizio
Ribera D’alcalà, Remo Sanges, Daniele Iudicone, et al.
To cite this version:
Alberto Amato, Gianluca Dell’aquila, Francesco Musacchia, Rossella Annunziata, Ari Ugarte, et al..
Marine diatoms change their gene expression profile when exposed to microscale turbulence under
nutrient replete conditions. Scientific Reports, Nature Publishing Group, 2016, 7 (1), pp.347A-348A.
�10.1038/s41598-017-03741-6�. �hal-01528507�
Marine diatoms change their gene
expression profile when exposed
to microscale turbulence under
nutrient replete conditions
Alberto Amato
1,4, Gianluca Dell’Aquila
1,5, Francesco Musacchia
1,6, Rossella Annunziata
1,
Ari Ugarte
2, Nicolas Maillet
1,7, Alessandra Carbone
2,3, Maurizio Ribera d’Alcalà
1, Remo
Sanges
1, Daniele Iudicone
1& Maria I. Ferrante
1Diatoms are a fundamental microalgal phylum that thrives in turbulent environments. Despite several experimental and numerical studies, if and how diatoms may profit from turbulence is still an open question. One of the leading arguments is that turbulence favours nutrient uptake. Morphological features, such as the absence of flagella, the presence of a rigid exoskeleton and the micrometre size would support the possible passive but beneficial role of turbulence on diatoms. We demonstrate that in fact diatoms actively respond to turbulence in non-limiting nutrient conditions. TURBOGEN, a prototypic instrument to generate natural levels of microscale turbulence, was used to expose diatoms to the mechanical stimulus. Differential expression analyses, coupled with microscopy inspections, enabled us to study the morphological and transcriptional response of Chaetoceros decipiens to turbulence. Our target species responds to turbulence by activating energy storage pathways like fatty acid biosynthesis and by modifying its cell chain spectrum. Two other ecologically important species were examined and the occurrence of a morphological response was confirmed. These results challenge the view of phytoplankton as unsophisticated passive organisms.
Oceanic plankton are characterised by a huge biodiversity spanning over many phyla. The different life strategies and behaviours displayed by such diverse organisms were selected also to cope with a patchy and variable 3D world driven by water motion1. Key factors for their survival, e.g., light availability, nutrient concentrations, prey
abundance and water temperature, are all strongly tuned by the fluid motion at different scales. Fluid motion introduces kinetic energy in the system and turbulence is the way kinetic energy is transferred, through a dissi-pation cascade, over several eddy-like structures down to the smallest scale. Below this scale, energy is dissipated to heat via the friction of viscosity and water motion cannot prevail over molecular diffusion but can control it by changing local gradients2, 3. This is particularly important for unicellular phytoplankton which are surrounded
by a fluid boundary layer where molecular diffusion is the dominant process and only solute (nutrient) chemical gradients assure cell provisioning. A distortion of the boundary layer would change these gradients, hence nutri-ents would diffuse more rapidly, enhancing the uptake rate4. For non-motile cells, like diatoms, the distortion of
the boundary layer can be produced only by sinking or by the shear generated by the decay of turbulent kinetic energy. Therefore there is no more turbulence, as a random motion of water parcels, but the effects of turbulence which dissipates though sheared flow. Shear stress is what cells below Kolmogorov scale would ultimately perceive
1Stazione Zoologica Anton Dohrn, Villa Comunale, 80121, Naples, Italy. 2Sorbonne Universités, UPMC Univ-Paris 6,
CNRS, UMR 7238, Laboratoire de Biologie Computationnelle et Quantitative, 15 rue de l’Ecole de Médecine, 75006, Paris, France. 3Institut Universitaire de France, 75005, Paris, France. 4Present address: Laboratoire de Physiologie
Cellulaire et Végétale, UMR5168 CNRS-CEA-INRA-Université de Grenoble Alpes, Institut de Recherche en Science et Technologies pour le Vivant, CEA Grenoble, 17 rue des Martyrs, 38054, Grenoble Cédex 9, France. 5Present
address: Zellbiologie Philipps-Universität Marburg, Karl-von-Frisch Str, 8 35043, Marburg, Germany. 6Present
address: Telethon Institute for Genetics and Medicine (TIGEM), Viale Campi Flegrei 34, 80078, Pozzuoli - Naples, Italy. 7Present address: Institut Pasteur – Bioinformatics and Biostatistics Hub – C3BI – CNRS, USR 3756 25-28 Rue
du Dr Roux, 75015, Paris, France. Correspondence and requests for materials should be addressed to M.I.F. (email:
mariella.ferrante@szn.it) Received: 29 June 2016
Accepted: 5 May 2017 Published: xx xx xxxx
in a turbulent environment. Microturbulence may also favour unicellular autotrophs, bringing them into the upper illuminated layer of the ocean, the euphotic zone5. The arguments above, together with cell size and the
ability to produce chains6–10, are frequently invoked to explain why diatoms should be favoured in turbulent
environments11, 12.
Mechanistic studies4, 13 predict that diatoms could profit from turbulent pulses, even without any physiological
adjustment. We note that following these studies some of the necessary conditions for an impact of microtur-bulence on diatoms, i.e., intense turmicrotur-bulence, nutrient depletion and grazing pressure14, are infrequently met in
the oceans15, 16. Thus, on the basis of current theories, diatoms would not specifically be adapted to microscale
turbulence14. Nonetheless, that diatoms can sense mechanical stimuli was demonstrated by shaking a suspension
of a Phaeodactylum tricornutum aequorin transformant with a needle and observing cytosolic calcium increases after 1–2 seconds after application of the stimulus and declining soon after17. Cytosolic calcium waves trigger the
activation of signal transduction18 i.e. a response to a perceived stimulus. This raises the question if turbulence
produces changes on some proximal environmental variables which would initiate diatom response similarly to what happens for light19–21 or if turbulence acts as a signal, carrying information about the environmental context
that diatoms exploit to rearrange their physiology. Considering that the effects of physical forcing can propagate from single cells through populations into marine ecosystems22 and that diatoms are considered among the most
productive phyla in the world ocean23, 24, a controlled response of diatoms to fluid motion would imply that the
whole food web can be affected by small scale turbulence25 with repercussions on the whole ecosystem26.
In the present study, we asked whether turbulence could trigger a response in diatoms when nutrients were in excess and all other environmental parameters were kept identical to control still samples. To this aim we applied measured levels of turbulence, in the order of those found in the field27, to the diatom Chaetoceros decipiens using
a prototypic turbulence generator (TURBOGEN28) and performed both microscopic inspection of chain lengths
and transcriptomic analyses. Chain formation is often put in relation to turbulence13 and C. decipiens displays the
peculiar trait of being able to control chain length29. Moreover this species belongs to the most abundant diatom
genus in ocean waters30. We conducted the experiments in natural cell concentrations and in nutrient replete
condition to rule out responses due to over-crowding and starvation stresses.
Our results showed that C. decipiens responded both morphologically and at the gene expression level to the treatment. The transcriptomic response was mild as expected because turbulence is not a stressor like nutrient starvation31–34, high irradiance35 or chemicals36. Unexpectedly, this species produced shorter chains in turbulence;
in fact chain length is correlated to cell growth and in our experiments, cultures were actively growing. We also extended our morphological analysis to two other centric diatoms, Thalassiosira rotula and Skeletonema
mari-noi, which show different chain formation modes, to assess whether the morphological response observed in C. decipiens followed a general pattern or was species-specific. We hypothesise that diatoms do not just profit from
turbulence pulses, but likely reorganise their physiology and morphology in presence of turbulence.
Results
Reference de novo assembled transcriptome.
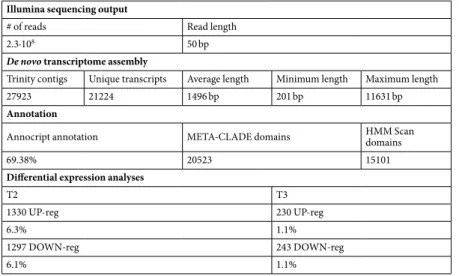
RNA-seq data (Supplementary Fig. 1, Supplementary Information) were used to produce a reference transcriptome for Chaetoceros decipiens. The Illumina sequencing output and de novo transcriptome assembly statistics are summarised in Table 1. The transcriptome contained ∼28,000 contigs and ∼21,000 unique transcripts (Supplementary Information), i.e. twice as many as Thalassiosirapseudonana37 and Phaeodactylum tricornutum38 genomes, but similar to other de novo diatom transcriptomes39,
including Chaetoceros species40. More than half of the transcripts were annotated using different algorithms
(Supplementary Fig. 2, Supplementary Information).
Gene expression changes in cultures exposed to turbulence.
In order to assess whether C. decipiens cells exposed to turbulence experienced changes in their gene expression profile, a low density culture was ali-quoted in the six TURBOGEN cylinders, turbulence was applied to three cylinders and samples were collectedIllumina sequencing output
# of reads Read length
2.3·108 50 bp
De novo transcriptome assembly
Trinity contigs Unique transcripts Average length Minimum length Maximum length
27923 21224 1496 bp 201 bp 11631 bp
Annotation
Annocript annotation META-CLADE domains HMM Scan domains
69.38% 20523 15101
Differential expression analyses
T2 T3
1330 UP-reg 230 UP-reg
6.3% 1.1%
1297 DOWN-reg 243 DOWN-reg
6.1% 1.1%
from still and turbulent cylinders at 48 and 72 hours from the beginning of the experiment (time points T2 and T3, respectively, Supplementary Fig. 1).
About 12% (T2) and ∼2% (T3) of the total C. decipiens transcripts were differentially expressed (DE, Supplementary Tables 1–3), of which the vast majority were unique to T2 (Fig. 1a). RNA-seq results were vali-dated by qPCR using independent RNA samples (Supplementary Tables 4 and 5).
In KO pathway (level 1, Fig. 1b) and GO-term (Fig. 1c) enrichment analyses the frequency of a given term in the entire transcriptome was compared with frequency of the same term in the DE transcript dataset, show-ing that a number of functions were significantly enriched in the latter. This is an indication that these func-tions might be involved in turbulence perception and/or response. This result was corroborated by plotting onto KEGG pathways the DE datasets for T2 (Supplementary Fig. 3a) and T3 (Supplementary Fig. 3b). The most reg-ulated pathways were Calvin cycle, fatty acid (FA) biosynthesis, glycolysis and pentose phosphate pathway (PPP) (Supplementary Table 3). Transcripts from the inositol and methylerythritol phosphate (isoprenoid biosynthesis)
Figure 1. Differential expression analyses in Chaetoceros decipiens. (a) Venn diagram of DE transcripts at time
points T2 and T3. Number of transcripts and percentage are shown. Venn diagrams have been produced using Venny 2.0 online software71. (b,c) Representation of (b) KO pathway level 1 and (c) GO terms significantly
enriched for DE transcripts. The charts show the proportion of transcripts associated to the significant classes for DE transcripts at time points T2 (green) and T3 (yellow) and their respective proportion in the assembled reference transcriptome (red). Colour shades indicate cellular components (ochre); biological processes (blue); molecular function (pink). On the x-axis, the percentage of transcripts associated to a given KO (b) or to a specific GO term (c) calculated over the total number of transcripts in the given dataset is reported.
pathways were regulated in presence of turbulence (Supplementary Table 6). Three transcripts annotated as nucle-otide diphosphate protein kinase (NDPK) were up-regulated in turbulent condition (Supplementary Table 6). FA biosynthesis requires, besides substrates, reducing power in the form of NADPH+ that can be provided by the
pentose phosphate pathway (PPP), which was up-regulated in our experiments. The differential expression anal-ysis indicated that PPP produced NADPH+ and GAP with the ribulose-5-phosphate preferentially following the
non-oxidative way of the PPP. GAP is the substrate for one of the two isoprenoid biosynthesis pathways, namely the methylerythritol phosphate pathway (MEP) that in turbulence-exposed cultures presented seven out of the nine transcripts up-regulated.
Morphological changes in diatom cultures exposed to turbulence.
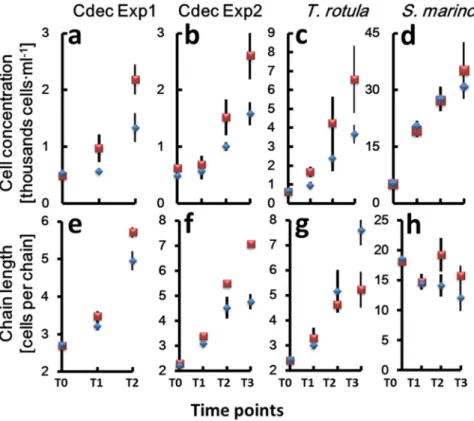
Besides RNA extraction and sequencing, culture samples were collected for microscopic inspection and cell counts every 24 hours from the beginning of the experiment (Supplementary Fig. 1). In addition to the experiments with C. decipiens, we used the TURBOGEN with the same experimental set up to study the response of two more chain-forming diatoms,Thalassiosira rotula and Skeletonema marinoi. Cell counts (Supplementary Table 7, Fig. 2a–d) and chain length measurements were performed (Fig. 2e–h) and division rates calculated. C. decipiens cultures presented a one-day lag phase of growth (Fig. 2a,b) and this behaviour was recorded also in T. rotula exposed to turbulence (Fig. 2c). S.
marinoi did not show such a lag phase (Fig. 2d). Overall, division rates between control and treated cultures were comparable (Table 2), with slightly different values recorded only for C. decipiens in experiment 2.
Figure 2. Growth curves expressed as cells · ml−1 (y-axis) (a–d) and mean chain length expressed as
number of cells per chain (y-axis) (e–h) over the time points (x-axis). (a,e) Chaetoceros decipiens experiment 1; (b,f) Chaetoceros decipiens experiment 2; (c,g) Thalassiosira rotula; (d,h) Skeletonema marinoi. Blue diamonds = turbulence exposed cells. Red squares = still condition. Vertical lines indicate standard deviation. Values have been averaged over the three replicates.
Species Division rate Turbulent Still C. decipiens Exp 1 1.2 ± 0.20 1.2 ± 0.54 C. decipiens Exp 2 0.8 ± 0.27 1.1 ± 0.14 T. rotula 1.0 ± 0.08 1.0 ± 0.17 S. marinoi 1.2 ± 0.11 1.2 ± 0.01
Table 2. Division rates calculated as the first derivative of the steepest portion of the growth curve.
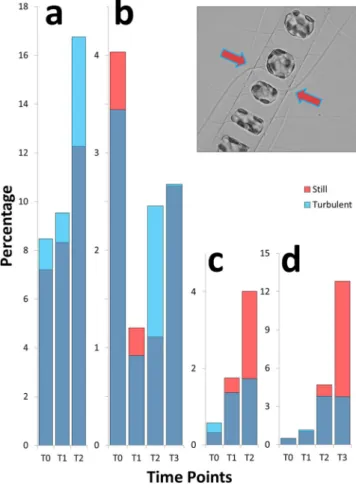
In C. decipiens, the metabolic response depicted above was accompanied by a morphological modification in the average chain length (Fig. 2e,f) and chain spectra; namely shorter chain classes resulted significantly enriched in turbulent condition (Fig. 3a and Supplementary Tables 8 and 9), in accordance with the observed reduction of the average chain length. One of the interesting features characterising C. decipiens is that broken chains can be easily recognised in this species because, when a chain mechanically breaks, the apices of the resulting chains will lack apical cells discernible by their thicker setae spanning parallel to the chain length. In our experiments the overall incidence of broken chains was ∼1% and ∼2% in turbulent and still conditions respectively for exper-iment 1 and ∼3% and ∼6% for experexper-iment 2 (Fig. 4c,d; Supplementary Table 10). The frequency was higher in still conditions where no grids passed through fluid and disturbed cells (Fig. 4c,d). When a C. decipiens chain naturally splits into two or more subchains upon mitosis, a so-called separation point appears. A separation point is characterised by two adjacent separating cells that synthesise apical setae instead of intercalary setae (Fig. 4, inlet). These will become apical cells of the new subchains deriving from the separation. The number of chains that presented at least one separation point was higher in turbulence than in still condition at T2 (Fig. 4a,b) thus
C. decipiens chains were more prone to separation.
The reason for such a response is not clear, but that chain length regulation is the most evident read-out for diatoms exposed to turbulence was validated by the experiments carried out on T. rotula and S. marinoi (Fig. 2g,h). The three diatom species used in our experiments responded differently to the turbulent stimulus applied. T. rotula exposed to turbulence responded producing significantly (Supplementary Tables 8 and 9) longer chains (Fig. 3b and Supplementary Fig. 3c). For S. marinoi the response was not statistically significant (Fig. 3c
and Supplementary Table 8). Internal controls, i.e. statistical tests run between replicates (e.g. turbulent cylinder A vs turbulent cylinder C) showed that from time point T1 onward the replicates were not statistically similar among each other (Supplementary Table 8). If the accuracy level was reduced from 99.9% to 95%, internal con-trols resulted consistent with statistically comparable replicates at T0 and T1 but not at T2 and T3. Mercurialness of replicates can be due to intrinsic variability of the species. Nevertheless, the mean chain length was slightly reduced in presence of turbulence as compared to still condition (Fig. 2h) although the standard deviations overlapped.
Discussion
One of the tenets in biological oceanography is that non-motile organisms below a certain threshold scale are not able to perceive turbulence2, 3, 41. Consequently diatoms, incapable of active movements, are universally believed
to do better in turbulent waters only because turbulence mobilises nutrients and distorts the boundary layer around the cells, enhancing nutrient gradients towards the cell wall and therefore uptake. This implies that in nutrient repletion (i.e. when nutrients are never limiting for growth) diatoms should not be affected by turbu-lence. Previous studies have demonstrated that diatoms are favoured by turbulence in mesocosm experiments7, 9,
42, 43 and in situ44, but how the response is triggered is unclear.
We compared morphology and gene expression profile of Chaetoceros decipiens cultures exposed to natural levels27 of microscale turbulence to cultures kept in still condition. We believe that turbulence is the main factor
these responses can be ascribed to, because all the other growth parameters were kept constant in the two sets of triplicates, including nutrient concentrations and light supply. In nutrient replete condition, the medium concen-trations of the three main nutrients (i.e. nitrates, phosphates and silicates) could sustain a flux toward the cell wall in still water from seven to eight orders of magnitude larger than the uptake rate, thus preventing any diffusion limitation in still water. This means that the boundary layer around the cells is never depleted of nutrients and therefore turbulence would not affect nutrient uptake and consumption. Light intensity cannot be a driver for the observed changes either. Considering that the cell concentrations in all cylinders were comparable, there was no effect of light attenuation. We also considered that cells in turbulence experienced a fluctuating light regime with respect to those in still45 but since the illumination was from the side and the cylinder radius was 0.12 m28,
the maximum light variation between the wall and the centre of the cylinder was less than 5%, and overall fluctu-ation in the 3D space of the cylinder accounted for no more than 13%, even at the maximum cell concentrfluctu-ation recorded.
Turbulence should not be a stressor like nutrient depletion or predators46, 47 nor a strong source of signals like
light can be for photosynthetic organisms19, 21, still the cell response after 48 hours from the onset of turbulence
was remarkable, with ∼12% of the total C. decipiens transcripts differentially expressed. The response was less strong at T3, with ∼2% of differentially expressed transcripts, and this could reflect an adaptation or a reduced sensitivity to the imposed turbulent regime, suggesting that the strongest changes occur in the first 48 hours after turbulence is applied. Cell-to-cell communication is likely occurring in a chain to regulate its length. The tran-scriptional changes related to this communication would be hard to capture with transcriptomics as i) the portion of the population that responds to turbulence by tuning chain spectrum is small and the transcriptional signal would be diluted in the background noise; ii) cells may communicate also in still condition29.
In the first reported evidence that a diatom, Phaeodactylum tricornutum, could sense and respond to a mechanical stimulus, the response was followed by measuring calcium waves within seconds after the applica-tion of the stimulus17. In our DE analyses different enzymes catalysing phosphorylation of phosphatidylinositol
were variably regulated at T2. These molecules are involved in G protein signalling pathway and in cytoplasmic calcium release to trigger a cascade of protein modifications that lead to a cellular response. Further functional studies would be required to clarify if in C. decipiens G proteins are involved in turbulence perception. NDPKs as well are involved in signal transduction and in our experiments three transcripts were regulated. This can be a starting point for further investigations, which will examine earlier phases of the response.
Gene expression changes on the other hand indicate more clearly that metabolic changes are occurring, most likely in the entire cell population. Fatty acid (FA) biosynthesis was one of the significantly enriched pathways among DE genes (Fig. 1b,c, adjusted p-value 0.007). FA can be employed in at least three different ways in a cell48,
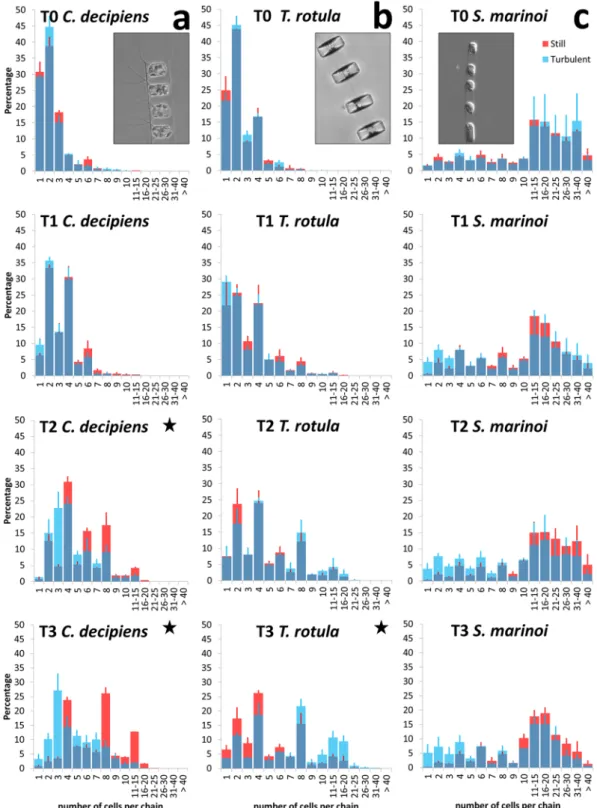
Figure 3. Chain spectra over time (T0-T3) in the three tested species. (a) Chaetoceros decipiens, (b) Thalassiosira rotula, (c) Skeletonema marinoi. A representative chain of each species is depicted in the inlets
(courtesy of I. Percopo). On the x-axis the chain length expressed as number of cells per chain is reported, on the y-axis the frequency of each chain class expressed in percentage. Dark blue portions of the histograms indicate overlap, red histograms indicate enrichment of a given chain class in the still condition, blue histograms indicate enrichment in the turbulent condition. The reported values are average of three replicates; vertical bars indicate standard deviations (red for still and blue for turbulent conditions, respectively). All results were statistically validated by Kolmogorov-Smirnov two-sample (KS2) and Wilcoxon non parametric tests (Supplementary Tables 8 and 9), a black star indicates that test outcome equals 1.
i.e. as cell-to-cell signalling molecules, as storage compounds or to produce cell membranes. A lipid content increase was measured and correlated to Si-NaCl double deprivation stress49 or to culture senescence50 in a
con-generic species (Chaetoceros gracilis) and FA in those experiments represented up to 93% of the total lipid cellular content. Also in Thalassiosira pseudonana FA accumulation was related to nutrient stress51. In our case, cells did
not experience any nutrient stress, as confirmed by data from a similar experiment52.
The up-regulation of FA biosynthesis was recorded when P. tricornutum cells experienced the transition from dark to light53. When light turns on, cells start fixing carbon very intensively and possibly the excess of energy
produced is deviated to the synthesis of FA that can be turned into triacylglycerols (TAG) for storage as oil drop-lets54. Similarly to what reported in P. tricornutum when light turns on53, also in C. decipiens under turbulent
conditions some desaturase-encoding genes55 were up-regulated together with an elongase. In P. tricornutum,
reactivation of photosynthesis after a period of inactivity induces cells to redirect the surplus of fixed carbon to FA production53; in turbulence C. decipiens showed a similar transcriptional response. As mentioned above,
the fate of the FA synthesised can be storage, or they can be used for membrane polar glycerolipids. FA can also serve as substrate for oxylipin production56, compounds that play a role as signalling molecules. Isoprenoids are
important compounds among which sterols, hormones, and carotenoids are the most known. We observed an over-expression of the PPP that would increase the GAP content in the cells that can be used to produce precur-sors for sterols. These compounds are known to serve a function as membrane signal transducers57, 58 and possible
involvement of sterols in C. decipiens response to turbulence is corroborated by the up-regulation of a transcript containing squalene cyclase domains (c9513, Supplementary Table 1). Squalene cyclase is involved in the first crucial steps of all sterol biosynthesis, i.e. cyclisation of linear precursors57.
Besides annotated genes, a relevant number of unknown transcripts showed regulation in turbulent vs. still condition. This very high rate of unknown DE transcripts can be an indication of uniqueness of these fascinating algae, characterised by a peculiar chimeric genome59 or of very peculiar responses that diatoms carry out to cope
with fluid motion.
We cannot exclude that the differences in expression patterns between the two treatments may partly reflect the weighted average of responses of cells in still conditions which were experiencing a larger inhomogeneity in growth conditions on the time scale of a day.
Figure 4. Frequency of separating chains (a,b) and mechanically broken chains (c,d) in C. decipiens. (a,c)
experiment 1; (b,d) experiment 2. On the x-axis time points are reported, on the y-axis the frequency of separating (a,b) and mechanically broken (c,d) chains expressed as percentage are reported. Colour code follows Fig. 3. Inlet: a separation point with two adjacent separating cells. Arrows indicate thicker terminal setae produced by the separating cells.
Specifically, small differences in division rates and inhomogeneous exposure to light might contribute to, but certainly not entirely account for, the response. We believe that none of these factors on its own is relevant enough to justify the changes and, more importantly, that nutrient fluxes and light fluctuations, the two processes so far considered as mostly affected by turbulence, might not be considered the drivers of the observed response.
The transcriptional response was accompanied in C. decipiens with a morphological modification and a one-day lag phase of growth. The latter can be due to the metabolic switch from active growth to accumulation. And in fact the same lag-phase was observed in T. rotula cultures exposed to turbulence but not in still T. rotula cells. The three species examined here are characterised by different junction modes, chain shape and stiffness60, 61,
and also different cell sizes. These three species presumably interact differently with the mechanical movements of the fluid13.
Possible scenarios to explain how diatoms sense turbulence can be advocated; fluid movement causes a pres-sure wave that is perceived on the cell wall via transmembrane proteins that change conformation and send a signal to the cell interior. Membrane curvature sensing (MCS) mechanism62 could be hypothesised63, with SYLF
domain containing proteins involved64. In our differential expression analysis the transcript c9791 contains a
SYLF domain and results slightly up-regulated in turbulent condition (Supplementary Table 1).
Further investigations are needed to decipher molecular and physiological mechanisms devoted to turbulence sensing in diatoms, but the intriguing question that can have profound ecological implications is why do diatoms respond to turbulence ? For a diatom, incapable of active movements, turbulence means mixing and mixing can lead to a displacement out of the euphotic zone. A possible scenario would be that if diatoms can promptly cope with a period in the dark relying on the FA accumulated then they can survive to a passage out of the euphotic zone. Once in the dark they can convert FA to energy and wait for turbulence to bring them back in the upper layers. FA may also serve as buoyancy regulators65 and their accumulation upon turbulence perception can be
interpreted as a way to balance the movement toward the deep dark ocean.
Conclusions
The results presented here suggest that diatoms sense turbulence in nutrient repletion conditions and respond to it by varying chain spectra and presumably metabolic state, suggested by gene expression changes. This was com-pletely unexpected based on previous physical and biological knowledge5, 11, 14, 66. Our observations on chain
spec-tra and separating chains in turbulence vs. still conditions testify the existence of a mechanism to perceive fluid movements. The present work showed that diatoms not only perceive and respond to mechanical stimuli within seconds from the application of the stimulus17, but also respond morphologically as well as transcriptionally in
the first days after turbulence is applied. Furthermore, different marine centric diatom species showed individual responses to the same stimulus. Understanding how this can shape the lower levels of the oceanic food web can shed light on the possible evolution of marine ecosystems in response to physical environment.
Methods
Strains and experimental plan.
The non-axenic Chaetoceros decipiens SZN-Cdec and Thalassiosira rotula SZN-Trot cultures were obtained by single chain isolation from net samples. The non-axenic Skeletonema marinoi strain V32 was a kind gift of Dr. Anna Godhe (University of Gothenburg, Sweden). Cultures were grown in F/2 medium67. Temperature for culture maintenance was set at 18 ± 1 °C, photoperiod at 12 L:12D and irradiance at80 µmol photons·m−2·s−1. Experiments were run using TURBOGEN28, a prototypic instrument composed of six
13-L cylinders for algal growth. Supplementary Fig. 1 depicts the workflow of the experiments run in the present investigation.
Chaetoceros decipiens experiments.
Two experiments, named ‘experiment 1’ and ‘experiment 2’, were carried out with Chaetoceros decipiens strain (cell diameter ∼23 µm). The strain was kept in active and expo-nential growth phase for two weeks before the experiment by serial dilutions. One week before the experiment a 5 L Pyrex®
sterile Erlenmeyer flask was inoculated and the growth was followed for 6 days. At the moment of the inoculum of the TURBOGEN cylinders for experiment 1, a cell count was carried out by Sedgwick-Rafter counting chamber68 in an inverted light microscope at 400× magnification and the cell concentration estimatedat 1.3 × 10⁴ cells·ml−1. Cells were in exponential growth phase. The total amount of F/2 medium needed for
the experiment (13 L per cylinder × 6 = 78 L) was inoculated with 1.95 × 10⁷ cells to get to a final concentration
of 250 cells·ml−1. Five hundred ml of the culture used for the inoculum were diluted in the same 5 L Pyrex
®
Erlenmeyer flask to be used for the next experiment. After one week, during which experiment 1 was carried out, cells in the Erlenmeyer flask were counted to be used as inoculum for experiment 2; the cell concentration was estimated at 1.5 × 10⁴ cells·ml−1. 1.95 × 10⁷ cells were then inoculated as before to get to a final cell concentration
of 250 cells·ml−1. For both experiments, the 78 L were then distributed over the six cylinders composing the
TURBOGEN (time point T-1) and left 24 hours for acclimation after inoculum. Temperature, photoperiod and light intensity in the TURBOGEN were set as for maintenance. After 24 hours from the inoculum (time point T0), all the cylinders were very gently stirred for 15 seconds (∼60 r.p.m.) with a 25-ml-strippette (Corning
®
Costar®
Stripette®
, cat. n. 4490, Corning Incorporated NY 14831, USA) in order to homogenise the cell suspen-sion. A 30-ml-sample was then taken from each cylinder and fixed with neutralised formaldehyde (final concen-tration 1% v/v) and stored at 4 °C in the dark until analysis. At T0 vertically oscillating grids were mounted in TURBOGEN and turbulence was activated in three out of the six cylinders (namely cylinders A, C, and E) with the following settings: stroke 240 mm, grid speed 100 mm·s−1, acceleration 1000 mm·s−2. The turbulent kineticenergy dissipation rate, ε, was in the order of 10–4 m2·s−3, i.e. in a range where nutrient fluxes around cells below
30 µm are not enhanced by turbulent motion14. In cylinders B, D, and F no turbulence was imposed in order
to have a negative control condition referred to as ‘still condition’. Experiment 1 lasted 3 days (from time point T0 to T2; i.e. 48 hours of continuous turbulence), while experiment 2 lasted 4 days (from time point T0 to T3;
i.e. 72 hours of continuous turbulence). At time point T2 for experiment 1 and time point T3 for experiment 2, cells were collected by filtration for RNA isolation and sequencing. Every day at the same time stirring and sam-pling were carried out as described above. The turbulent cylinders were not stirred. In pilot experiments, cells in still cultures in two cylinders were counted before and after stirring, to verify that no sinking occurred, and we obtained the following values: cylinder 1 at T2, 1635 cells·ml−1 before and 1609 cells·ml−1 after stirring, cylinder
2 at T2, 1305 cells·ml−1 before and 1255 cells·ml−1 after stirring; cylinder 1 at T3, 3311 cells·ml−1 before and 3710
cells·ml−1 after stirring, cylinder 2 at T3, 2733 cells·ml−1 before and 2776 cells·ml−1 after stirring.
Thalassiosira rotula and Skeletonema marinoi experiments.
The experiment with T. rotula and S.marinoi were conducted exactly like what reported above for C. decipiens (Supplementary Fig. 1). At the moment of the inoculum of the cylinders, cell concentrations were estimated at 7.6 × 10³ and 9.8 × 10⁴ cells·ml−1 for T.
rot-ula and S. marinoi respectively. Cells were in exponential growth phase. The total amount of filtered F/2 medium
(78 L) was inoculated with 3.9 × 10⁷ and 1.95 × 10⁸ cells to get to a final concentration of 500 and 2.5 × 10³
cells·ml−1 for T. rotula and S. marinoi respectively.
RNA-seq and qPCR.
For C. decipiens experiments cells were gathered by filtration and RNA isolated by Roche TriPure®
reagent following manufacturer’s instructions. RNA samples were analysed at an Agilent 2100 Bioanalyzer platform to assess integrity, at a NanoDrop 2000 Spectrophotometer to assess purity, and quantified at a Qubit fluorometer. 1.5 µg RNA from two still and two turbulent samples from each time point were sent to EMBL Gencore Facility for sequencing on the Illumina HiSeq2000 platform; single end 50 bp reads were pro-duced. RNA-seq data are available in ArrayExpress under accession number E-MTAB-5031.1 µg RNA from three turbulent and three still condition samples from each time point was reverse transcribed using Qiagen QuantiTect Reverse Transcription Kit following manufacturer’s instructions for qPCR validation of RNA-seq results.
Cell counts and data analyses.
Cell counts were used to define chain distribution over time as well as to draw growth curves. On average 427 chains per sample were counted in Sedgwick-Rafter or Utermöhl69 countingchambers. Statistical relevance of results was estimated by applying Wilcoxon and Kolmogorov-Smirnov two sample (KS2) tests (99.9% accuracy, α 0.001) in MatLab.
Bioinformatics analyses.
The fastq files from RNA-seq experiments were inspected using FastQC tool and further cleaned and trimmed using Trimmomatic. Trinity software (ver. trinity_201407) was used for the assem-bling of the reads. We quantified transcript expression levels by mapping reads against the assembled transcrip-tome using Bowtie (ver. 1.1). To count the reads mapped we used Samtools (ver. 0.1.19-44428 cd). The resulting reference transcriptome was annotated using Annocript70 software that aligns transcripts against known proteins,domains and non-coding RNAs (Supplementary Information). In order to refine domain annotation we used META-CLADE (Ugarte et al., unpublished), a software designed on the basis of CLADE71 with the purpose to
annotate metagenomics and metatranscriptomics reads. META-CLADE exploits multiple probabilistic models representing protein domains and characterising different evolutionary pathways. Multiple models have been constructed for all known Pfam domains. META-CLADE combines this multiple source annotation strategy with domain based learned estimators of domain annotation. We mapped Pfam domains into contig sequences, annotated the contigs and made the analysis (counting) on each sample. The importance of a functional class is highlighted by the abundance of the domains within the class. To compare the estimations obtained on each sam-ple, we normalised the abundance with respect to the size of each sample (annotation per megabase).
Differential expression analysis.
We used EdgeR to select transcripts differentially expressed (DE) between still and turbulent conditions. Transcripts were considered as DE if the false discovery rate (FDR) was smaller or equal to 0.05 and the fold change greater than 2. Enrichment analyses for GO terms and Pathways were performed exploiting the Fisher exact test and the Benjamini and Hochberg correction of the p-values. GO terms and Pathways were considered enriched when associated to at least 10 DE transcripts with an adjusted p-value smaller than 0.1.Supplementary Information contains detailed descriptions of all the methods reported in the present section.
References
1. McKiver, W. J. & Neufeld, Z. Resonant plankton patchiness induced by large-scale turbulent flow. Phys. Rev. E 83, 016303, doi:10.1103/PhysRevE.83.016303 (2011).
2. Stocker, R. Marine microbes see a sea of gradients. Science 338, 628–633, doi:10.1126/science.1208929 (2012).
3. Taylor, J. R. & Stocker, R. Trade-offs of chemotactic foraging in turbulent water. Science 338, 675–679, doi:10.1126/science.1219417
(2012).
4. Pasciak, W. J. & Gavis, J. Transport limitation of nutrient uptake in phytoplankton. Limnol. Oceanogr. 19, 881–888, doi:10.4319/ lo.1974.19.6.0881 (1974).
5. Margalef, R. Life-forms of phytoplankton as survival alternatives in an unstable environment. Oceanol. Acta 1, 493–509 (1978). 6. Arin, L., Morán, X. A. G. & Estrada, M. Phytoplankton size distribution and growth rates in the Alboran Sea (SW Mediterranean):
short term variability related to mesoscale hydrodynamics. J. Plankton Res. 24, 1019–1033, doi:10.1093/plankt/24.10.1019 (2002). 7. Machado, D. A., Marti, C. L. & Imberger, J. Influence of microscale turbulence on the phytoplankton of a temperate coastal
embayment, Western Australia. Estuar. Coast. Shelf S 145, 80–95, doi:10.1016/j.ecss.2014.04.018 (2014).
8. Peters, F., Arin, L., Marrasé, C., Berdalet, E. & Sala, M. M. Effects of small-scale turbulence on the growth of two diatoms of different size in a phosphorus-limited medium. J. Marine Syst. 61, 134–148, doi:10.1016/j.jmarsys.2005.11.012 (2006).
9. Romero, E., Peters, F. & Marrasé, C. Dynamic forcing of coastal plankton by nutrient imbalances and match-mismatch between nutrients and turbulence. Mar. Ecol-Prog. Ser. 464, 69–87, doi:10.3354/meps09846 (2012).
10. Pahlow, M., Riebesell, U. & Wolf-Gladrow, D. A. Impact of cell shape and chain formation on nutrient acquisition by marine diatoms. Limnol. Oceanogr. 42, 1660–1672, doi:10.4319/lo.1997.42.8.1660 (1997).
11. Margalef, R. Turbulence and marine life. Sci. Mar. 61, 109–123 (1997).
12. Wyatt, T. Margalef’s mandala and phytoplankton bloom strategies. Deep Sea Res. Pt II 101, 32–49, doi:10.1016/j.dsr2.2012.12.006
(2014).
13. Karp-Boss, L. & Jumars, P. A. Motion of diatom chains in steady shear flow. Limnol. Oceanogr. 43, 1767–1773, doi:10.4319/ lo.1998.43.8.1767 (1998).
14. Barton, A. D., Ward, B. A., Williams, R. G. & Follows, M. J. The impact of fine-scale turbulence on phytoplankton community structure. Limnol. Oceanogr. Fluids Environ 4, 34–49, doi:10.1215/21573689-2651533 (2014).
15. Doney, S. C., Abbott, M. R., Cullen, J. J., Karl, D. M. & Rothstein, L. From genes to ecosystems: the ocean’s new frontier. Front. Ecol.
Environ. 2, 457–466, doi:10.1890/1540-9295(2004)002[0457:FGTETO]2.0.CO;2 (2004).
16. Giraud, X., Le Quéré, C. & da Cunha, L. C. Importance of coastal nutrient supply for global ocean biogeochemistry. Global
Biogeochem. Cy. 22, GB2025, doi:10.1029/2006gb002717 (2008).
17. Falciatore, A., Ribera d’Alcalà, M., Croot, P. & Bowler, C. Perception of environmental signals by a marine diatom. Science 288, 2363–2366, doi:10.1126/science.288.5475.2363 (2000).
18. Tuteja, N. & Mahajan, S. Calcium signaling network in plants: an overview. Plant Signal. Behav. 2, 79-85 PMCID: PMC2633903 (2007).
19. Bailleul, B. et al. An atypical member of the light-harvesting complex stress-related protein family modulates diatom responses to light. Proc. Natl. Acad. Sci. USA 107, 18214–18219, doi:10.1073/pnas.1007703107 (2010).
20. Coesel, S. et al. Diatom PtCPF1 is a new cryptochrome/photolyase family member with DNA repair and transcription regulation activity. EMBO Rep. 10, 655–661, doi:10.1038/embor.2009.59 (2009).
21. Depauw, F. A., Rogato, A., Ribera d’Alcalà, M. & Falciatore, A. Exploring the molecular basis of response to light in marine diatoms.
J. Exp. Bot. 63, 1575–1591, doi:10.1093/jxb/ers005 (2012).
22. Villar, E. et al. Environmental characteristics of Agulhas rings affect interocean plankton transport. Science 348, 10.1126/ science.1261447 (2015).
23. Falkowski, P. G., Barber, R. T. & Smetacek, V. Biogeochemical controls and feedbacks on ocean primary production. Science 281, 200–206, doi:10.1126/science.281.5374.200 (1998).
24. Field, C. B., Behrenfeld, M. J., Randerson, J. T. & Falkowski, P. G. Primary production of the biosphere: integrating terrestrial and oceanic components. Science 281, 237–240, doi:10.1126/science.281.5374.200 (1998).
25. Wang, P., Shen, H. & Xie, P. Can hydrodynamics change phosphorus strategies of diatoms?–Nutrient levels and diatom blooms in lotic and lentic ecosystems. Microb. Ecol. 63, 369–382, doi:10.1007/s00248-011-9917-5 (2012).
26. Falkowski, P. G. Ocean Science: The power of plankton. Nature 483, S17–S20, doi:10.1038/483S17a (2012).
27. Lozovatsky, I., Figueroa, M., Roget, E., Fernando, H. J. S. & Shapovalov, S. Observations and scaling of the upper mixed layer in the North Atlantic. J. Geophys. Res.-Oceans 110, C05013, doi:10.1029/2004JC002708 (2005).
28. Amato, A. et al. TURBOGEN: Computer-controlled vertically oscillating grid system for small-scale turbulence studies on plankton.
Rev. Sci. Instrum. 87, 035119, doi:10.1063/1.4944813 (2016).
29. Gherardi, M. et al. Regulation of chain length in two diatoms as a growth-fragmentation process. Phys. Rev. E 94, 022418, doi:10.1103/PhysRevE.94.022418 (2016).
30. de Vargas, C. et al. Eukaryotic plankton diversity in the sunlit ocean. Science 348, doi:10.1126/science.1261605 (2015).
31. Allen, A. E. et al. Evolution and metabolic significance of the urea cycle in photosynthetic diatoms. Nature 473, 203–207, doi:10.1038/nature10074 (2011).
32. Ashworth, J. et al. Genome-wide diel growth state transitions in the diatom Thalassiosira pseudonana. Proc. Natl. Acad. Sci. USA 110, 7518–7523, doi:10.1073/Pnas.1300962110 (2013).
33. Bender, S. J., Durkin, C. A., Berthiaume, C. T., Morales, R. L. & Armbrust, E. V. Transcriptional responses of three model diatoms to nitrate limitation of growth. Front. Mar. Sci. 1, doi:10.3389/fmars.2014.00003 (2014).
34. Levitan, O. et al. Remodeling of intermediate metabolism in the diatom Phaeodactylum tricornutum under nitrogen stress. Proc.
Natl. Acad. Sci. USA 112, 412–417, doi:10.1073/pnas.1419818112 (2015).
35. Park, S., Jung, G., Hwang, Y.-s & Jin, E. Dynamic response of the transcriptome of a psychrophilic diatom, Chaetoceros neogracile, to high irradiance. Planta 231, 349–360, doi:10.1007/s00425-009-1044-x (2010).
36. Carvalho, R. N., Bopp, S. K. & Lettieri, T. Transcriptomics responses in marine diatom Thalassiosira pseudonana exposed to the polycyclic aromatic hydrocarbon benzo[α]pyrene. PLoS ONE 6, e26985, doi:10.1371/journal.pone.0026985 (2011).
37. Armbrust, E. V. et al. The genome of the diatom Thalassiosira pseudonana: ecology, evolution, and metabolism. Science 306, 79–86, doi:10.1126/science.1101156 (2004).
38. Bowler, C. et al. The Phaeodactylum genome reveals the evolutionary history of diatom genomes. Nature 456, 239–244, doi:10.1038/ nature07410 (2008).
39. Di Dato, V. et al. Transcriptome sequencing of three Pseudo-nitzschia species reveals comparable gene sets and the presence of Nitric Oxide Synthase genes in diatoms. Sci. Rep 5, 12329, doi:10.1038/srep12329 (2015).
40. Keeling, P. J. et al. The Marine Microbial Eukaryote Transcriptome Sequencing Project (MMETSP): Illuminating the functional diversity of eukaryotic life in the oceans through transcriptome sequencing. PLoS Biol. 12, e1001889, 10.1371/journal.pbio.1001889 (2014). 41. Batchelor, G. K. Small-scale variation of convected quantities like temperature in turbulent fluid Part 1. General discussion and the
case of small conductivity. J. Fluid Mech. 5, 113–133, doi:10.1017/S002211205900009X (1959).
42. Garrison, H. S. & Tang, K. W. Effects of episodic turbulence on diatom mortality and physiology, with a protocol for the use of Evans Blue stain for live–dead determinations. Hydrobiologia 738, 155–170, doi:10.1007/s10750-014-1927-0 (2014).
43. Iversen, K. R. et al. Effects of small-scale turbulence on lower trophic levels under different nutrient conditions. J. Plankton Res. 32, 197–208, doi:10.1093/plankt/fbp11 3 (2010).
44. Landeira, J. M. et al. Biophysical interactions control the size and abundance of large phytoplankton chains at the Ushant tidal front.
PLoS ONE 9, e90507, doi:10.1371/journal.pone.0090507 (2014).
45. Esposito, S., Botte, V., Iudicone, D. & Ribera d’Alcalà, M. Numerical analysis of cumulative impact of phytoplankton photoresponses to light variation on carbon assimilation. J. Theor. Biol. 261, 361–371, doi:10.1016/j.jtbi.2009.07.032 (2009).
46. Bergkvist, J., Thor, P., Jakobsen, H., Ngberg, S. A. W. & Selander, E. Grazer-induced chain length plasticity reduces grazing risk in a marine diatom. Limnol. Oceanogr. 57, 318–324, doi:10.4319/lo.2012.57.1.0318 (2012).
47. Diekmann, A. B. S., Peck, M. A., Holste, L., St John, M. A. & Campbell, R. W. Variation in diatom biochemical composition during a simulated bloom and its effect on copepod production. J. Plankton Res. 31, 1391–1405, doi:10.1093/plankt/fbp073 (2009). 48. Stonik, V. & Stonik, I. Low-molecular-weight metabolites from diatoms: Structures, biological roles and biosynthesis. Mar. Drugs 13,
3672–3709, doi:10.3390/md13063672 (2015).
49. Adams, C. & Bugbee, B. Enhancing lipid production of the marine diatom Chaetoceros gracilis: synergistic interactions of sodium chloride and silicon. J. Appl. Phycol. 26, 1351–1357, doi:10.1007/s10811-013-0156-7 (2014).
50. Pratiwi, A. R., Syah, D., Hardjito, L., Panggabean, L. M. G. & Suhartono, M. T. Fatty acid synthesis by indonesian marine diatom.
Chaetoceros gracilis. HAYATI J. Biosci. 16, 151–156, doi:10.4308/hjb.16.4.151 (2009).
51. Bromke, M. A., Giavalisco, P., Willmitzer, L. & Hesse, H. Metabolic analysis of adaptation to short-term changes in culture conditions of the marine diatom Thalassiosira pseudonana. PLoS ONE 8, e67340, doi:10.1371/journal.pone.0067340 (2013). 52. Dell’Aquila, G. et al. Nutrient consumption and chain tuning in diatoms exposed to storm-like turbulence. Sci. Rep. 7, 1828,
53. Skogen Chauton, M., Winge, P., Brembu, T., Vadstein, O. & Bones, A. M. Gene regulation of carbon fixation, storage, and utilization in the diatom Phaeodactylum tricornutum acclimated to light/dark cycles. Plant Physiol. 161, 1034–1048, doi:10.1104/pp.112.206177
(2013).
54. Boudière, L. et al. Galvestine-1, a novel chemical probe for the study of the glycerolipid homeostasis system in plant cells. Mol.
BioSyst. 8, 2023–2035, doi:10.1039/c2mb25067e (2012).
55. Dolch, L.-J. & Maréchal, E. Inventory of fatty acid desaturases in the pennate diatom Phaeodactylum tricornutum. Mar. Drugs 13, 1317–1339, doi:10.3390/md13031317 (2015).
56. Mosblech, A., Feussner, I. & Heilmann, I. Oxylipins: Structurally diverse metabolites from fatty acid oxidation. Plant Physiol. Bioch.
47, 511–517, doi:10.1016/j.plaphy.2008.12.011 (2009).
57. Hannich, J. T., Umebayashi, K. & Riezman, H. Distribution and functions of sterols ands phingolipids. Cold Spring Harb. Perspect.
Biol. 3, a004762, doi:10.1101/cshperspect.a004762 (2011).
58. Lingwood, D. & Simons, K. Lipid rafts as a membrane-organizing principle. Science 327, 46–50, doi:10.1126/science.1174621 (2010). 59. Moustafa, A. et al. Genomic footprints of a cryptic plastid endosymbiosis in diatoms. Science 324, 1724–1726, doi:10.1126/
science.1172983 (2009).
60. Nguyen, H. & Fauci, L. Hydrodynamics of diatom chains and semiflexible fibres. J. R. Soc. Interface 11, 20140314, doi:10.1098/ rsif.2014.0314 (2014).
61. Young, A. M., Karp-Boss, L., Jumars, P. A. & Landis, E. N. Quantifying diatom aspirations: Mechanical properties of chain-forming species. Limnol. Oceanogr. 57, 1789–1801, doi:10.4319/lo.2012.57.06.1789 (2012).
62. Bhatia, V. K. et al. Amphipathic motifs in BAR domains are essential for membrane curvature sensing. EMBO J. 28, 3303–3314, doi:10.1038/emboj.2009.261 (2009).
63. Hatzakis, N. S. et al. How curved membranes recruit amphipathic helices and protein anchoring motifs. Nat. Chem. Biol. 5, 835–841, doi:10.1038/nchembio.213 (2009).
64. Madsen, K. L., Bhatia, V. K., Gether, U. & Stamou, D. BAR domains, amphipathic helices and membrane-anchored proteins use the same mechanism to sense membrane curvature. FEBS Lett. 584, 1848–1855, doi:10.1016/j.febslet.2010.01.053 (2010).
65. Gross, F. & Zeuthen, E. The buoyancy of plankton diatoms: a problem of cell physiology. P. Roy. Soc. Lond. B Bio 135, 382–389, doi:10.1098/rspb.1948.0017 (1948).
66. Estrada, M. & Berdalet, E. Phytoplankton in a turbulent world. Sci. Mar. 61, 125–140 (1997).
67. Guillard, R. R. L. in Culture of Marine Invertebrate Animals (eds W.L. Smith & M.H. Chanley) 29–60 (Plenum Press, 1975). 68. Woelkerling, W., Kowal, R. & Gough, S. Sedgwick-rafter cell counts: a procedural analysis. Hydrobiologia 48, 95–107, doi:10.1007/
bf00040161 (1976).
69. Edler, L. & Elbrächter, M. In Microscopic and molecular methods for quantitative phytoplankton analysis (eds B. Karlson, C.K. Cusack, & E. Bresnan) 13–20 (UNESCO (IOC Manuals and Guides n. 55), 2010).
70. Musacchia, F., Basu, S., Petrosino, G., Salvemini, M. & Sanges, R. Annocript: a flexible pipeline for the annotation of transcriptomes able to identify putative long noncoding RNAs. Bioinformatics 31, 2199–2201, doi:10.1093/bioinformatics/btv106 (2015). 71. Bernardes, J., Zaverucha, G., Vaquero, C. & Carbone, A. Improvement in protein domain identification is reached by breaking
consensus, with the agreement of many profiles and domain co-occurrence. PLoS Comput. Biol. 12, e1005038, doi:10.1371/journal. pcbi.1005038 (2016).
72. Oliveros, J. C. Venny. An interactive tool for comparing lists with Venn’s diagrams. http://bioinfogp.cnb.csic.es/tools/venny/index.html
(2007–2015).
Acknowledgements
A.A., M.I.F., D.I., N.M., F.M. and M.R.dA. thank the Flagship project RITMARE (Ricerca ITaliana per il MARE, Italian Research for the Sea) for support coordinated by the Italian National Research Council and funded by the Italian Ministry of Education, University and Research within the National Research Program 2011–2013. A.A. was funded by the European Union under FP7-People, GA n. 600407 and RITMARE Flagship Project. A.C. acknowledges funding from grant ANR-11-LABX-0037-01, ANR-11-IDEX-0004-02, and from the Institut Universitaire de France. Isabella Percopo (SZN) is thanked for T. rotula and S. marinoi pictures used as inlets in Fig. 3b,c. The authors thank Wiebe Kooistra (SZN) for kindly isolating the Chaetoceros decipiens strain Na54B3 used for pilot experiments.
Author Contributions
D.I., M.I.F., M.R.d.A., and A.A. conceived the study. A.A., M.I.F. and D.I. designed experiments. A.A. run and analysed C. decipiens and T. rotula experiments. G.D.A. run the S. marinoi experiment. R.A. performed pilot experiments for C. decipiens. A.A. (with the help of M.I.F., D.I., R.S. and M.R.d.A.) analysed results. F.M. and R.S. assembled and annotated C. decipiens transcriptome and carried out differential expression analyses. A.C. and A.U. run Meta-Clade domain annotation. N.M. produced iPath representations. A.A. wrote the paper, all the authors contributed to the final version of the manuscript and approved it.
Additional Information
Supplementary information accompanies this paper at doi:10.1038/s41598-017-03741-6 Competing Interests: The authors declare that they have no competing interests.
Publisher's note: Springer Nature remains neutral with regard to jurisdictional claims in published maps and
institutional affiliations.
Open Access This article is licensed under a Creative Commons Attribution 4.0 International
License, which permits use, sharing, adaptation, distribution and reproduction in any medium or format, as long as you give appropriate credit to the original author(s) and the source, provide a link to the Cre-ative Commons license, and indicate if changes were made. The images or other third party material in this article are included in the article’s Creative Commons license, unless indicated otherwise in a credit line to the material. If material is not included in the article’s Creative Commons license and your intended use is not per-mitted by statutory regulation or exceeds the perper-mitted use, you will need to obtain permission directly from the copyright holder. To view a copy of this license, visit http://creativecommons.org/licenses/by/4.0/.